In today’s fast-paced digital world, social media has become the voice of customers. People share their opinions, experiences, and complaints about brands across platforms like Twitter, LinkedIn, Facebook, Instagram, and even online forums. For businesses, ignoring this massive flow of real-time conversations can mean missed opportunities, reputational risks, and loss of customer trust. This is where Social Listening plays a critical role.
By tracking and analyzing what customers say online, companies can improve engagement, monitor brand perception, and respond proactively to trends or crises. However, handling large volumes of data across multiple channels can become overwhelming without a structured system. That’s why businesses rely on a Social Listening KPI Dashboard in Excel.
This dashboard is not just a spreadsheet. It is a powerful analytical tool that organizes raw data into actionable insights through structured KPIs (Key Performance Indicators). With clear visuals, monthly comparisons, and year-to-date trends, it empowers managers to take quick, data-driven decisions.
Click to buy Social Listening KPI Dashboard in Excel
In this article, we’ll explore everything you need to know about the Social Listening KPI Dashboard in Excel — its features, benefits, advantages, best practices, and how you can implement it effectively in your business.
What Is a Social Listening KPI Dashboard in Excel?
A Social Listening KPI Dashboard in Excel is a ready-to-use template designed to track all essential metrics related to customer conversations, engagement, and brand reputation across digital platforms. Instead of relying on scattered reports and manual analysis, this dashboard consolidates everything into a single, easy-to-navigate platform.
It allows teams to monitor metrics like:
- Brand mentions across platforms
- Sentiment analysis (positive, neutral, negative)
- Engagement rate (likes, shares, comments)
- Response time to customer queries
- Influencer impact on brand perception
By using Excel’s built-in formulas, charts, conditional formatting, and dropdown selections, the dashboard becomes interactive and dynamic. Managers can filter results by month, compare performance against targets, and even track year-over-year trends.
Key Features of the Social Listening KPI Dashboard in Excel
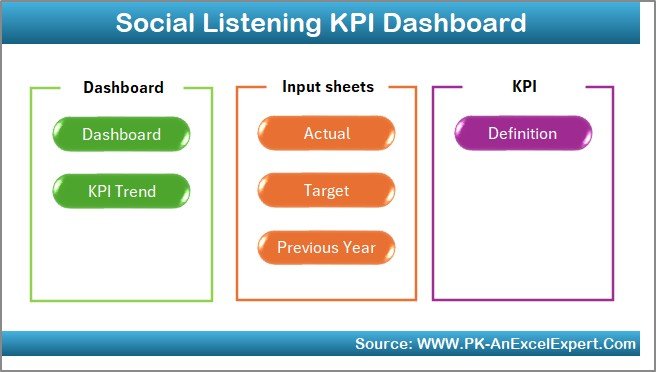
This dashboard is structured across 7 worksheet tabs, each serving a unique purpose:
Home Sheet
- Acts as the index page.
- Includes 6 clickable buttons for quick navigation.
- Saves time by allowing users to jump directly to the required sheet.
Click to buy Social Listening KPI Dashboard in Excel
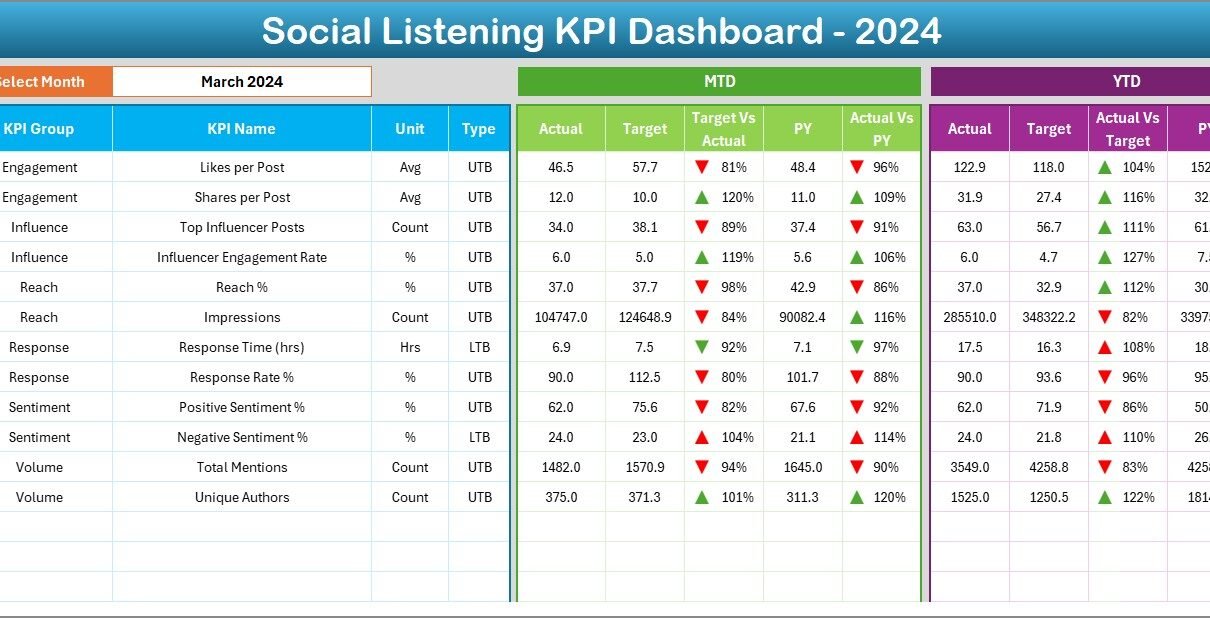
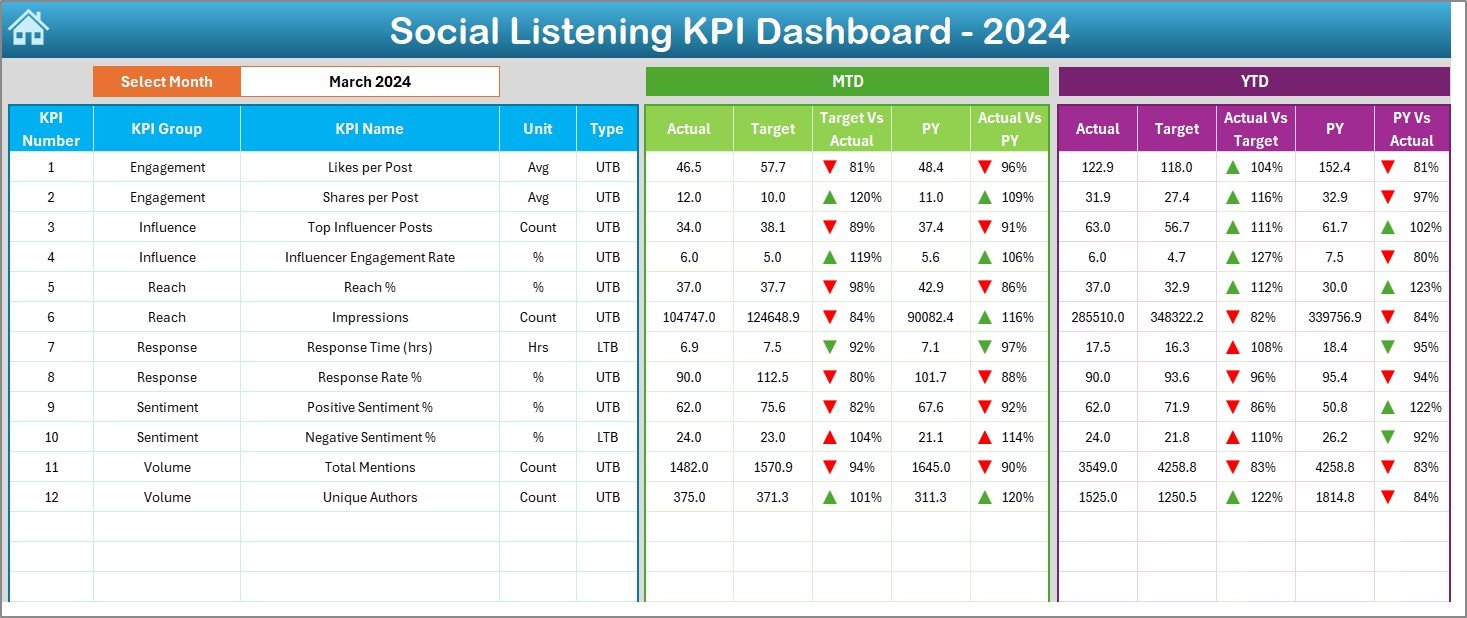
Dashboard Sheet
- The main analysis sheet of the tool.
- A dropdown menu in cell D3 lets you select a month, updating all KPIs instantly.
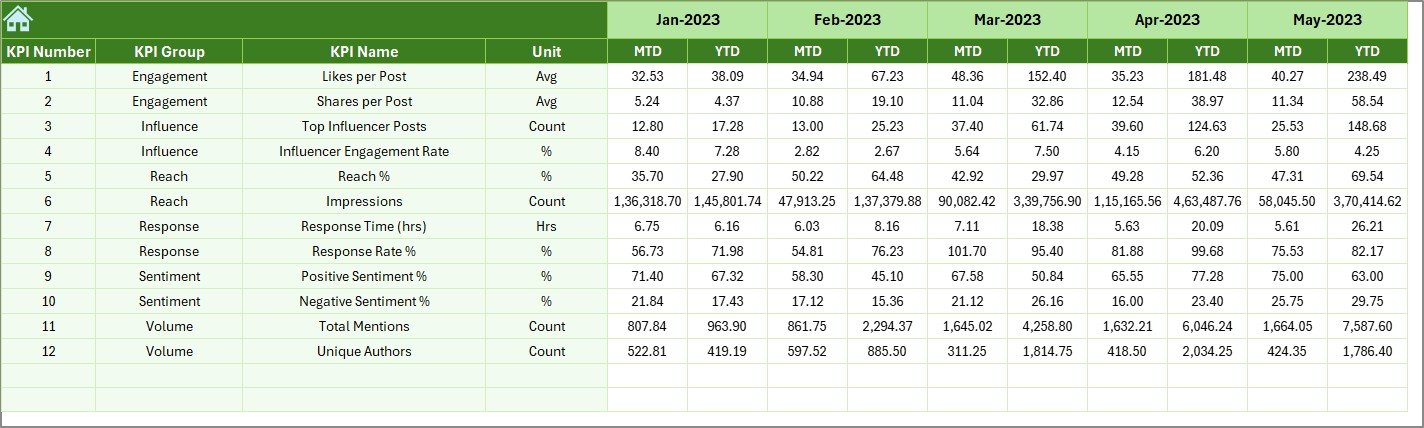
- Displays:
- MTD (Month-to-Date) values: Actual vs Target vs Previous Year.
- YTD (Year-to-Date) values: Actual vs Target vs Previous Year.
- Includes conditional formatting arrows (green up, red down) for quick performance checks.
Click to buy Social Listening KPI Dashboard in Excel
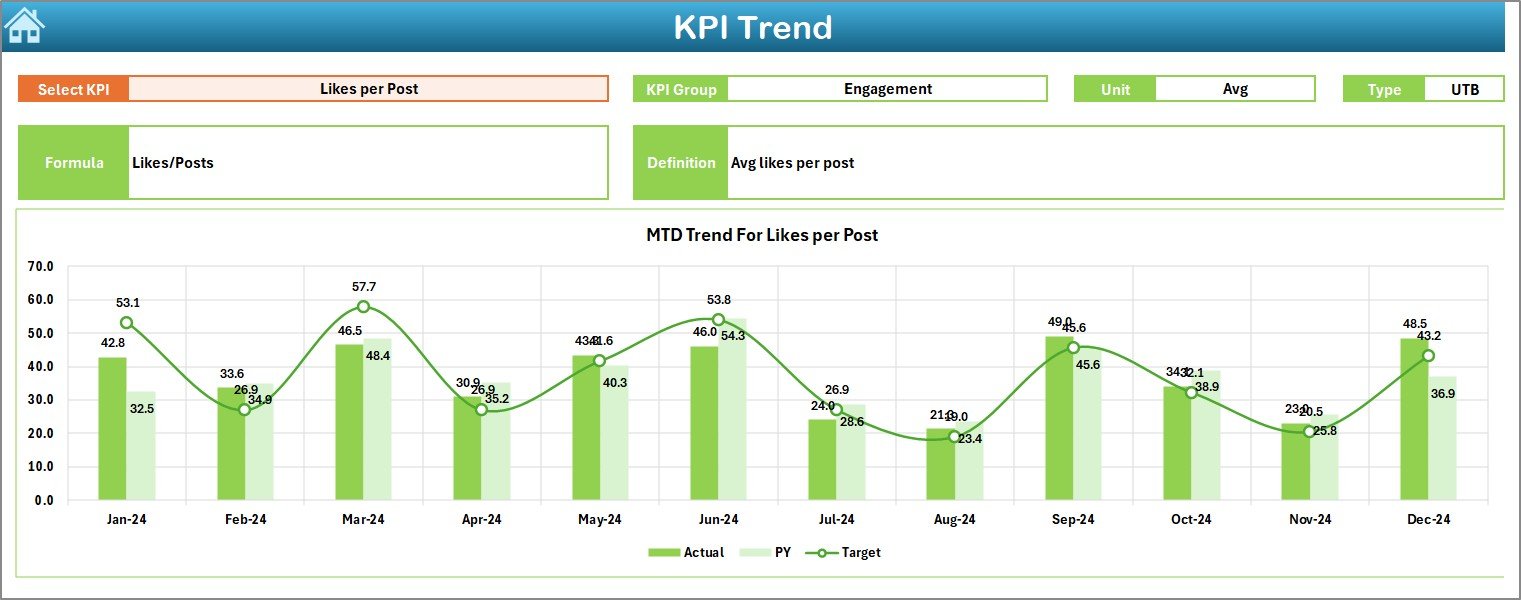
KPI Trend Sheet
- Interactive chart where you can select a KPI from a dropdown in C3.
- Displays key details like:
- KPI Group
- Unit of measurement
- Type (Lower the Better / Upper the Better)
- Formula
- Short definition
- Shows both MTD and YTD trend charts (Actual, Target, and Previous Year).
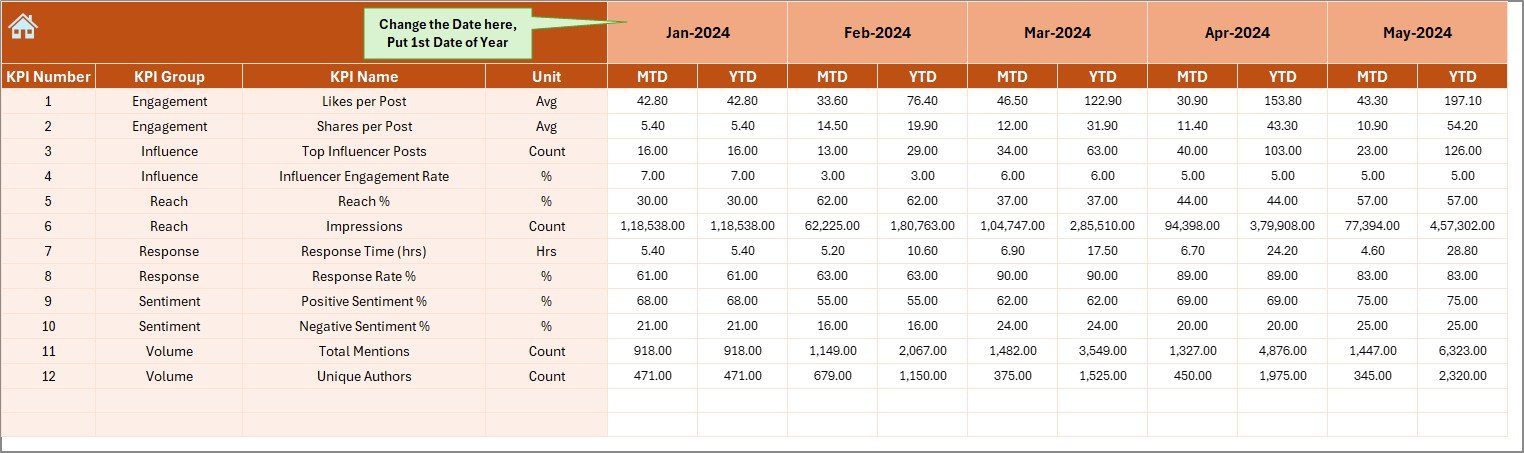
Actual Numbers Input Sheet
- Dedicated space to input actual monthly data.
- Update YTD and MTD values by simply entering numbers.
- Month selection available in cell E1, making updates flexible.
Click to buy Social Listening KPI Dashboard in Excel
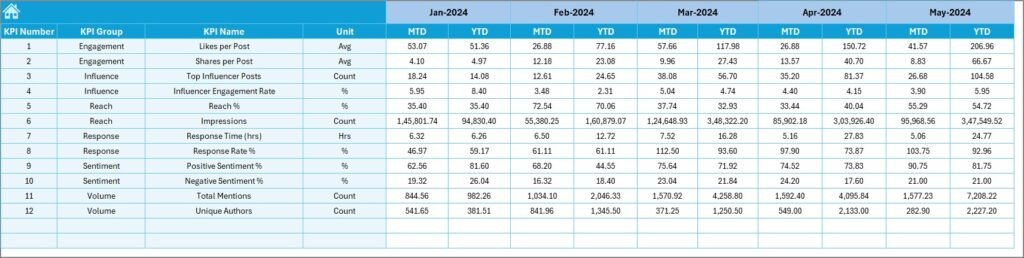
Target Sheet
- Used to enter target numbers for each KPI.
- Includes both MTD and YTD targets for each month.
Previous Year Numbers Sheet
- Stores the previous year’s KPI data.
- Enables direct comparison between current and past performance.
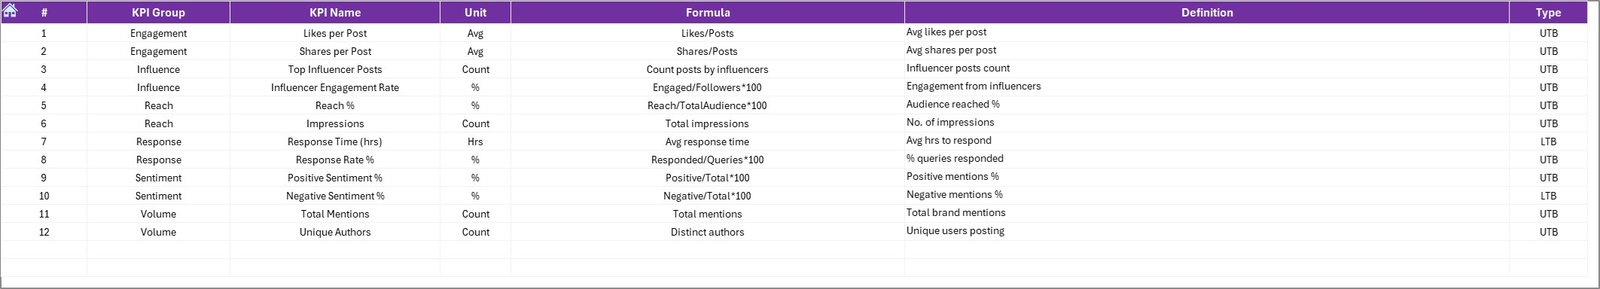
KPI Definition Sheet
- Contains the list of KPIs with details:
- Name
- Group
- Unit
- Formula
- Definition
- This ensures clarity for users who may not be familiar with specific KPI terminology.
Why Do Businesses Need a Social Listening Dashboard?
Monitoring social media manually can lead to incomplete data, slow responses, and missed patterns. A structured dashboard helps businesses by:
- Consolidating multiple sources into one view.
- Allowing quick performance checks against targets.
- Offering visual trends and comparisons for better decision-making.
- Enabling faster response times to customer complaints.
- Tracking influencer campaigns and brand impact more effectively.
In short, this dashboard is not just a reporting tool — it is a decision-support system for marketing, customer service, and leadership teams.
Advantages of the Social Listening KPI Dashboard in Excel
Implementing this dashboard offers several clear benefits:
- Improved Decision-Making
Managers can view real-time KPI performance, compare with previous years, and adjust strategies quickly.
- Enhanced Customer Engagement
By tracking sentiment and response times, brands can engage with customers more effectively.
- Cost-Effective Solution
Unlike expensive BI tools, Excel offers a low-cost yet powerful platform.
- Easy Customization
Since the template is Excel-based, businesses can modify formulas, add new KPIs, or change visuals easily.
- Better Cross-Team Collaboration
Marketing, customer service, and management teams can work together using a shared, structured framework.
Opportunities for Improvement in Social Listening Dashboards
Even though the dashboard is highly effective, there are areas where organizations can enhance its use:
- Integration with APIs: Automating data collection from platforms like Twitter or LinkedIn instead of manual entry.
- Advanced Visualization: Adding Power BI integration for deeper trend analysis.
- Sentiment Accuracy: Using AI tools to improve sentiment scoring beyond manual coding.
- Cross-Channel Comparison: Expanding the dashboard to include competitor benchmarking.
Best Practices for Using the Social Listening KPI Dashboard in Excel
To maximize the benefits of this tool, follow these best practices:
- Define KPIs clearly before rolling out the dashboard.
- Update data regularly (monthly or weekly) to keep insights relevant.
- Train teams on reading KPIs and using Excel features.
- Automate wherever possible to reduce manual errors.
- Review trends, not just numbers, to gain deeper insights into performance.
- Use conditional formatting for quick identification of risks and opportunities.
How to Use the Dashboard Effectively?
Here’s a simple step-by-step workflow:
- Enter Actual Data → Update monthly actuals in the Actual Numbers Input Sheet.
- Set Targets → Enter target values in the Target Sheet.
- Load Previous Year Data → Fill in historical data in the Previous Year Numbers Sheet.
- Navigate from Home Sheet → Use buttons to access specific analysis sheets.
- Check Dashboard Tab → Select a month from the dropdown (D3) and review KPIs.
- Analyze Trends → Open the KPI Trend Sheet and check charts for each KPI.
- Refer Definitions → Use the KPI Definition Sheet to clarify meanings.
Conclusion
Social media has become the new marketplace where customer opinions shape brand success. A Social Listening KPI Dashboard in Excel empowers organizations to track performance, spot risks, and act on opportunities faster. With structured KPI tracking, real-time comparisons, and flexible input sheets, businesses gain the confidence to make smarter decisions and improve engagement.
This dashboard is not only practical but also scalable — making it suitable for startups, mid-sized firms, and large enterprises alike. By following the best practices and continuously improving the framework, companies can transform raw social media chatter into valuable business intelligence.
Frequently Asked Questions (FAQs)
- What is a Social Listening KPI Dashboard in Excel?
It is a prebuilt Excel template that helps businesses track social media mentions, sentiment, engagement, and other KPIs in one place.
- Why should I use Excel for social listening instead of other tools?
Excel offers a cost-effective, customizable, and easy-to-use platform compared to expensive BI or SaaS tools.
- Can I customize the dashboard to include my own KPIs?
Yes, the KPI Definition Sheet allows you to add or edit KPIs based on your business needs.
- How often should I update the dashboard?
Ideally, update it monthly. However, for high-volume brands, weekly updates ensure real-time responsiveness.
- Does this dashboard support competitor tracking?
By default, it focuses on your brand. However, you can extend it to include competitor mentions and sentiment by adjusting input sheets.
- Can this dashboard integrate with automation tools?
Yes, with additional setup (e.g., APIs or Power Query), data from Twitter, LinkedIn, or Facebook can be pulled automatically into Excel.
- Who can benefit from this dashboard?
Marketing teams, customer support managers, PR professionals, and leadership teams benefit the most from using it.
Visit our YouTube channel to learn step-by-step video tutorials
Watch the step-by-step video tutorial:
Click to buy Social Listening KPI Dashboard in Excel