Maintaining compliance is one of the most critical aspects of modern business management. Whether your organization operates in finance, healthcare, manufacturing, or education, ensuring that all processes meet internal policies and external regulations is essential.
Yet, tracking compliance metrics manually can be challenging — especially when dealing with multiple departments, policies, and performance indicators. This is where a Compliance KPI Scorecard in Excel becomes a game-changer.
In this article, we will explore what a Compliance KPI Scorecard is, why it matters, and how you can use Excel to build an efficient compliance performance management system. We will also go through its advantages, best practices, and frequently asked questions to help you use it effectively.
Click to buy Compliance KPI Scorecard in Excel
What Is a Compliance KPI Scorecard in Excel?
A Compliance KPI Scorecard is an Excel-based performance tracking tool designed to measure how well your organization follows compliance standards, policies, and regulations.
It provides a structured way to track key performance indicators (KPIs) related to compliance, such as audit completion rates, policy adherence, corrective action timelines, and regulatory reporting accuracy.
Unlike complex enterprise software, Excel offers flexibility, simplicity, and familiarity — allowing teams to monitor compliance metrics without the need for expensive systems or coding.
The scorecard visually represents data in tables, charts, and conditional formats, helping managers quickly identify gaps, trends, and areas that require immediate attention.
Why Is Compliance KPI Tracking Important?
Compliance failures can result in heavy fines, legal penalties, or damage to reputation. Regular tracking of compliance KPIs ensures transparency and accountability across departments.
Here are a few reasons why compliance tracking is essential:
- Improved Accountability: Assign responsibility for each KPI to ensure ownership and action.
- Better Decision-Making: Make informed decisions based on accurate, real-time performance data.
- Proactive Issue Resolution: Identify compliance risks before they escalate into serious problems.
- Audit Readiness: Maintain organized, up-to-date records for audits and inspections.
- Operational Efficiency: Streamline compliance activities to reduce duplication and inefficiencies.
Overview of the Compliance KPI Scorecard Template
The Compliance KPI Scorecard in Excel template is ready-to-use and includes four main worksheets. Each sheet serves a specific purpose, allowing users to manage, analyze, and visualize compliance performance effectively.
Let’s explore each worksheet in detail.
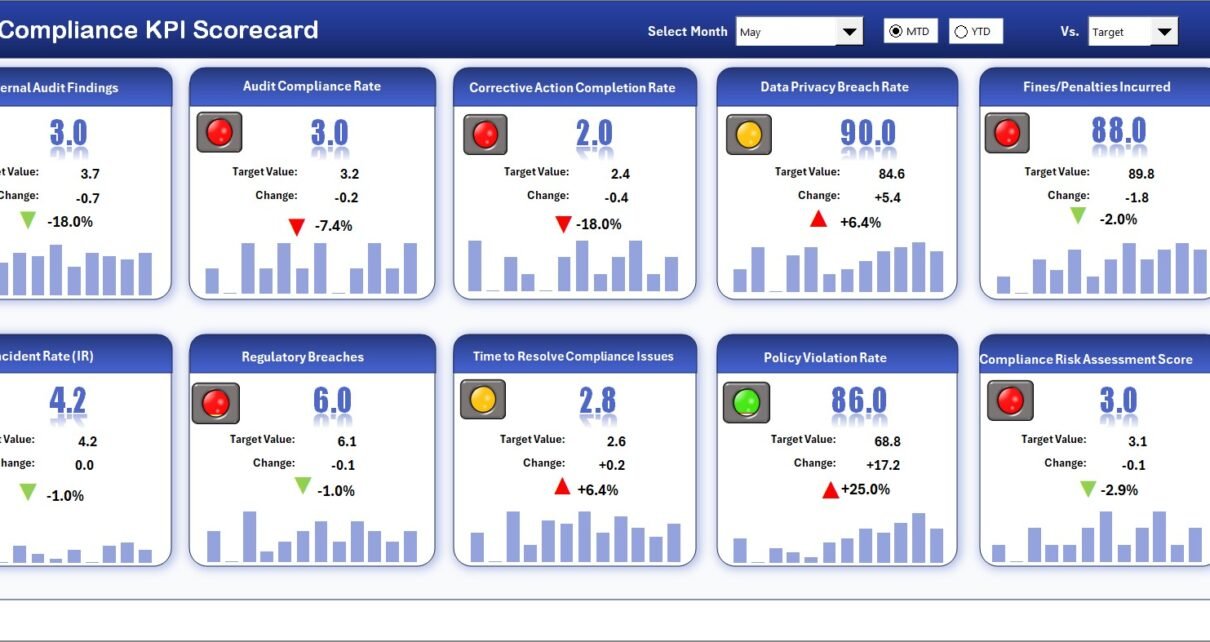
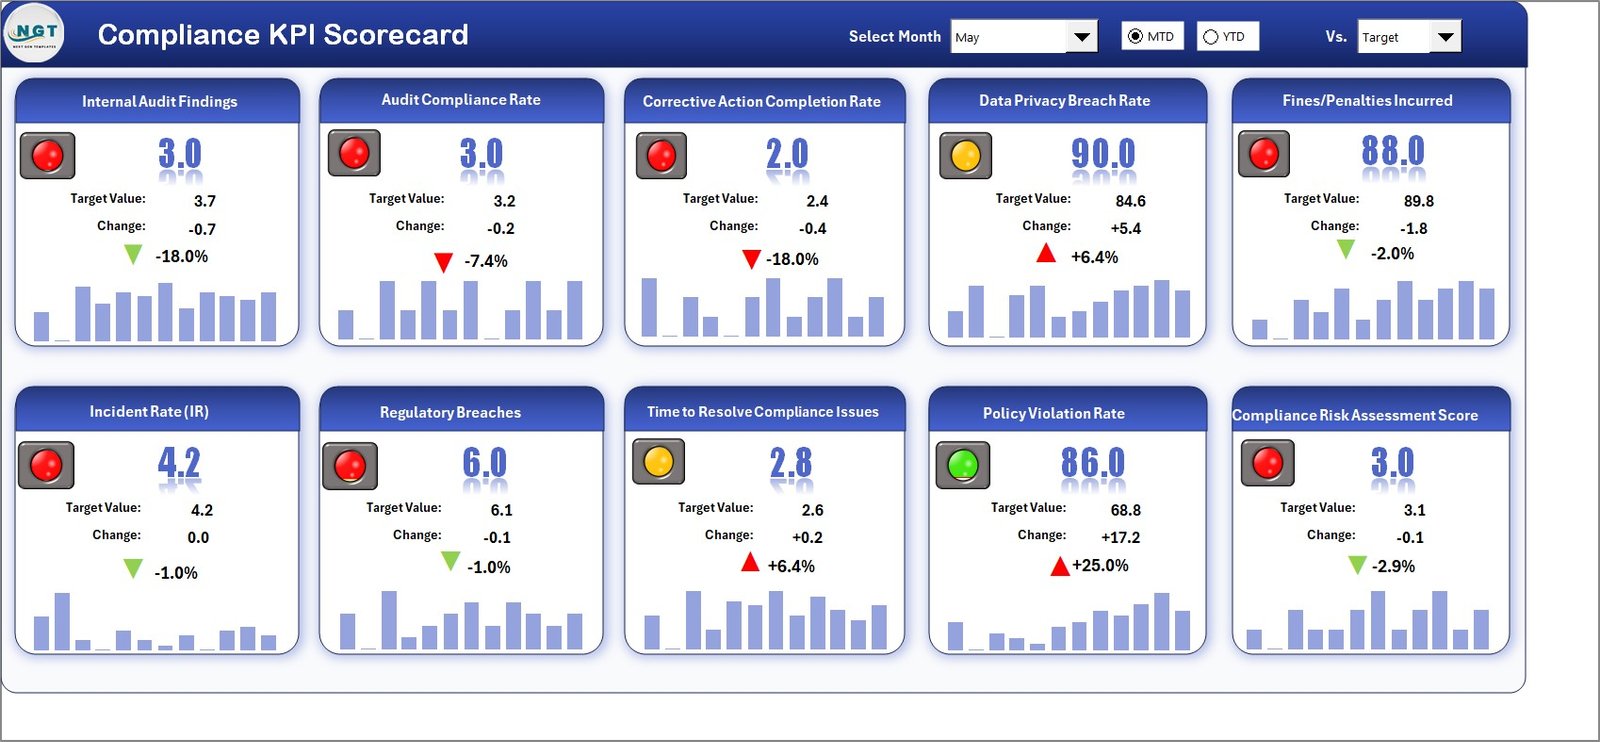
Scorecard Sheet — Your Main Dashboard
The Scorecard Sheet acts as the front-end interface where you can view all KPI performance in one place.
Key Features:
- Dropdown Menus: Select a specific month, MTD (Month-to-Date), or YTD (Year-to-Date) for dynamic analysis.
- Actual vs Target Values: Compare real results against targets for every KPI.
- Visual Indicators: Conditional formatting shows green for success, yellow for caution, and red for underperformance.
- Comprehensive KPI Overview: Displays all essential details, including KPI name, group, unit, and trend indicators.
- Multi-KPI View: You can review up to 10 KPIs at once for a quick snapshot of performance.
This sheet turns raw data into insights — empowering compliance managers to make timely, data-driven decisions.
Click to buy Compliance KPI Scorecard in Excel
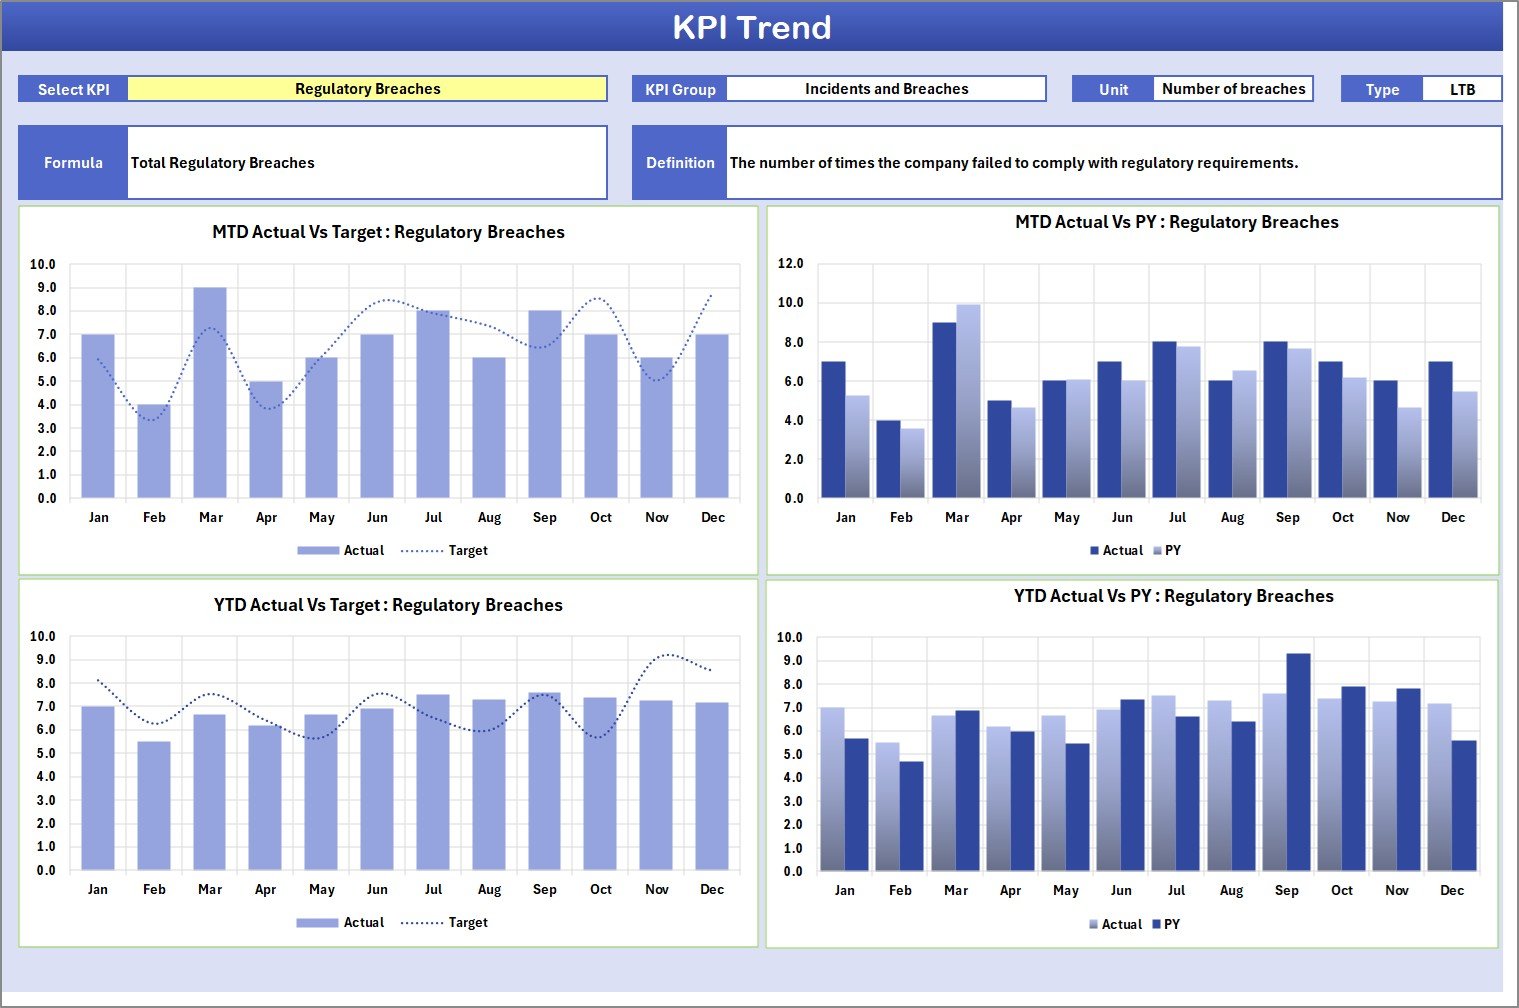
KPI Trend Sheet — Tracking Progress Over Time
The KPI Trend Sheet provides an in-depth view of each compliance metric’s historical trend.
Highlights:
- KPI Selection Dropdown: Choose the KPI you want to analyze from a simple drop-down list.
- Detailed Information: Shows KPI Group, Unit, Type (Lower the Better or Upper the Better), Formula, and Definition.
- Trend Charts: Displays MTD and YTD performance trends for Actual, Target, and Previous Year values.
These visuals make it easy to spot long-term improvements or declines, helping teams adjust strategies quickly.
Click to buy Compliance KPI Scorecard in Excel
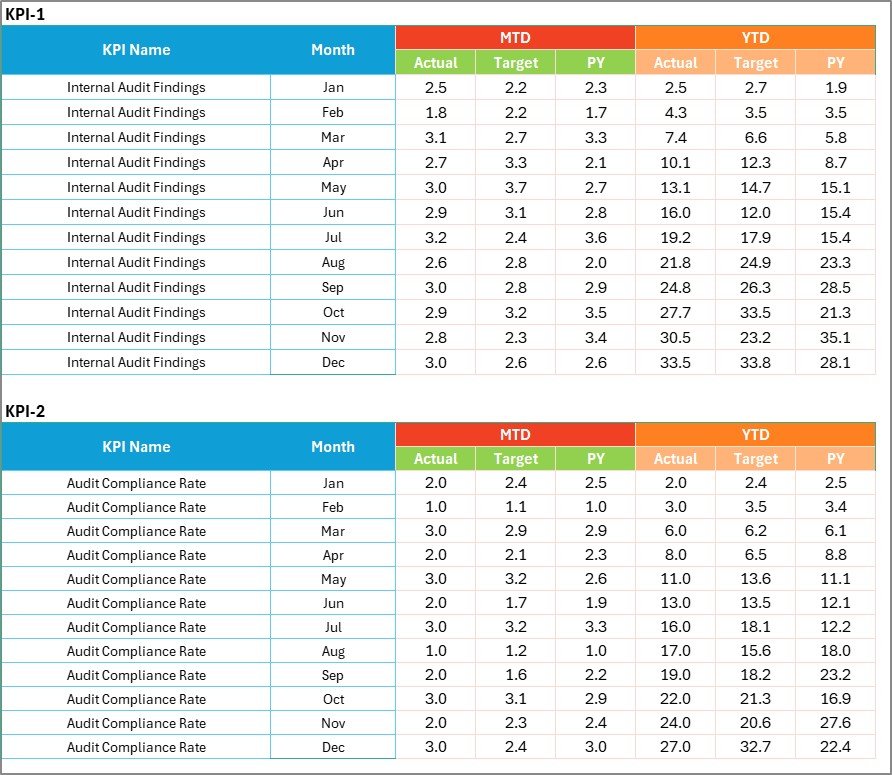
Input Data Sheet — Centralized Data Entry
The Input Data Sheet is the foundation of the scorecard. It’s where all actual and target data are recorded.
Key Features:
- Data Entry Columns: Record actual performance, targets, and previous year’s values.
- Easy Updates: Update data monthly as new results come in.
- Dynamic Connection: The dashboard and trend charts automatically update based on this data.
This setup minimizes manual calculations and ensures your reports always reflect the latest compliance metrics.
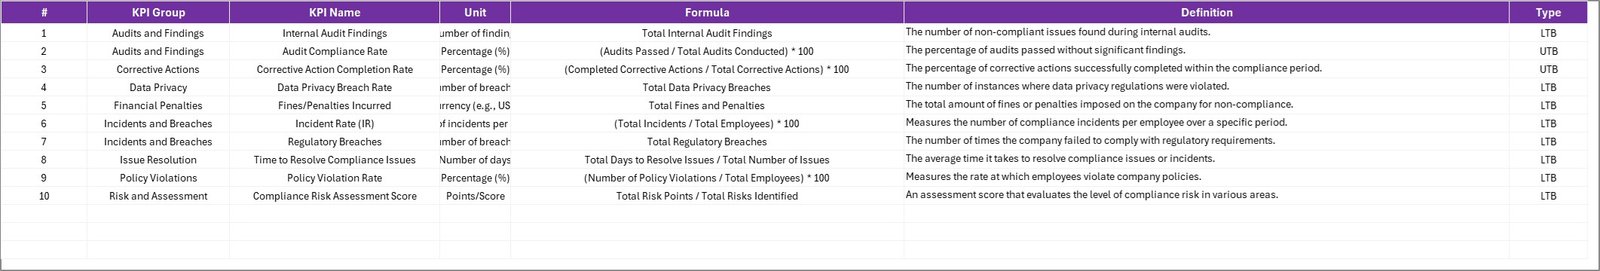
KPI Definition Sheet — The Knowledge Base
The KPI Definition Sheet stores all important details about each KPI.
Key Columns:
- KPI Name
- KPI Group
- Unit of Measurement
- Formula
- KPI Definition
This sheet ensures consistency and transparency in how compliance performance is measured. It helps all stakeholders understand what each KPI represents and how it’s calculated.
Click to buy Compliance KPI Scorecard in Excel
How to Use the Compliance KPI Scorecard in Excel
Using the scorecard is simple, even for non-technical users. Follow these steps:
- Open the Template: Start with the prebuilt Excel file.
- Enter KPI Definitions: In the KPI Definition Sheet, define each KPI’s group, unit, formula, and description.
- Input Data: Add monthly data for each KPI in the Input Data Sheet.
- Analyze Performance: Go to the Scorecard Sheet to view actual vs target results.
- Check Trends: Use the KPI Trend Sheet to visualize performance over time.
- Make Decisions: Use insights from the dashboard to improve compliance processes.
With proper updates, your scorecard becomes a living document that supports strategic decision-making.
Advantages of a Compliance KPI Scorecard in Excel
Let’s explore why this tool is so valuable for organizations of all sizes.
- Easy to Customize
You can easily modify KPIs, charts, and formulas according to your organization’s specific compliance requirements.
- Cost-Effective
Unlike expensive compliance management systems, Excel is affordable and readily available across most businesses.
- Real-Time Analysis
With built-in formulas and dynamic charts, users can monitor performance instantly.
- Enhanced Visibility
Visual indicators and dashboards provide a clear picture of where the company stands in terms of compliance.
- Better Collaboration
Different departments can input data and share insights using a single, centralized file.
- Supports Continuous Improvement
By reviewing trends regularly, organizations can implement corrective actions faster and strengthen compliance culture.
Understanding MTD and YTD in Compliance Reporting
- MTD (Month-to-Date) shows how a KPI performed within the current month.
- YTD (Year-to-Date) reflects cumulative performance from the beginning of the year.
For instance, if your compliance training completion rate is 85% MTD and 92% YTD, it means the organization is improving consistency over time.
Using both measures ensures balanced short-term and long-term visibility of performance.
Integrating the Scorecard with Other Reports
Although the Compliance KPI Scorecard is built in Excel, it can easily connect with other business tools such as:
- Power BI for interactive visualization
- SharePoint or Google Drive for team collaboration
- Power Automate or VBA for automated updates
These integrations help streamline data refresh and reporting cycles, saving time and reducing manual errors.
How to Design an Effective Compliance KPI Scorecard
To get the most from your scorecard, focus on structure and usability.
Key Design Tips:
- Keep KPIs limited to 10–15 to maintain clarity.
- Use consistent color codes for performance indicators.
- Add dropdowns for easy navigation.
- Include tooltips or notes explaining formulas.
- Automate charts using PivotTables or dynamic ranges.
A clean and professional layout increases adoption among teams and ensures accurate data interpretation.
best Practices for the Compliance KPI Scorecard
Follow these best practices to make your scorecard efficient and sustainable:
- Define SMART KPIs:
Ensure every KPI is Specific, Measurable, Achievable, Relevant, and Time-bound. - Update Regularly:
Keep data current by updating monthly or quarterly. - Validate Data Sources:
Cross-check information with audit records or compliance software. - Use Conditional Formatting Wisely:
Highlight poor performance automatically using red/yellow/green colors. - Protect Formula Cells:
Lock key formulas to avoid accidental edits. - Review and Revise:
Adjust KPIs annually to align with changing compliance regulations.
🏁 Conclusion
A Compliance KPI Scorecard in Excel is not just a reporting tool — it’s a complete performance management framework. It helps organizations stay compliant, maintain transparency, and continuously improve processes.
By tracking the right KPIs, updating data regularly, and using Excel’s built-in features, compliance teams can turn data into actionable insights.
Whether you’re managing audits, training programs, or policy adherence, this scorecard provides the clarity and control you need to maintain compliance excellence.
Frequently Asked Questions (FAQs)
- What is the purpose of a Compliance KPI Scorecard?
It helps organizations measure, monitor, and improve compliance performance by tracking key metrics such as audit completion, training, and reporting accuracy.
- How often should the scorecard be updated?
Most organizations update their compliance KPI scorecards monthly or quarterly, depending on data availability and reporting frequency.
- Can I use this scorecard for any industry?
Yes. The template is flexible and can be adapted to finance, healthcare, education, manufacturing, or any other sector that needs compliance tracking.
- What are the benefits of using Excel for compliance KPIs?
Excel is affordable, easy to use, and allows complete customization of KPIs, charts, and dashboards without additional software.
- How many KPIs can be tracked in one scorecard?
You can track as many as needed, but keeping it between 10–15 ensures readability and better management focus.
- Can I integrate this Excel file with Power BI?
Absolutely. You can import the data into Power BI to create advanced interactive dashboards.
- What does “Lower the Better” and “Upper the Better” mean?
These indicate KPI direction — for example, “Incidents Reported” is Lower the Better (LTB), while “Training Completion Rate” is Upper the Better (UTB).
Visit our YouTube channel to learn step-by-step video tutorials
Watch the step-by-step video tutorial:
Click to buy Compliance KPI Scorecard in Excel