In today’s competitive industrial environment, every manufacturing company needs real-time insights to make faster and better decisions. Monitoring production efficiency, cost, quality, and downtime manually can become overwhelming and error-prone. That’s where a Manufacturing KPI Dashboard in Excel becomes a powerful tool for operational excellence.
This article explores everything you need to know about building, using, and optimizing a Manufacturing KPI Dashboard in Excel — from its structure and features to its advantages, best practices, and frequently asked questions.
Click to buy Manufacturing KPI Dashboard in Excel
What Is a Manufacturing KPI Dashboard in Excel?
A Manufacturing KPI Dashboard in Excel is a data-driven reporting system that tracks, measures, and visualizes key performance indicators (KPIs) of a manufacturing plant. It transforms raw data into meaningful visuals, helping managers identify bottlenecks, measure productivity, and make informed decisions in real time.
Instead of analyzing multiple spreadsheets, this dashboard consolidates all your production data into one interactive interface. You can view performance across departments, track monthly trends, and compare results against targets — all within Excel.
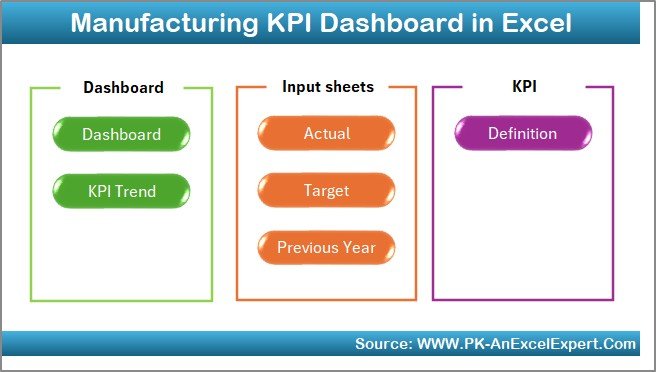
Key Components of the Manufacturing KPI Dashboard
The Manufacturing KPI Dashboard in Excel includes seven worksheet tabs, each designed for a specific purpose. Let’s explore how each one works.
Home Sheet – The Navigation Hub
The Home Sheet acts as an index page for your dashboard. It includes six navigation buttons, allowing users to jump directly to any section of the file with a single click.
This design ensures users can easily access data entry sheets, dashboards, and trend reports without scrolling or searching through the workbook. It improves usability and saves time for managers and operators alike.
Click to buy Manufacturing KPI Dashboard in Excel
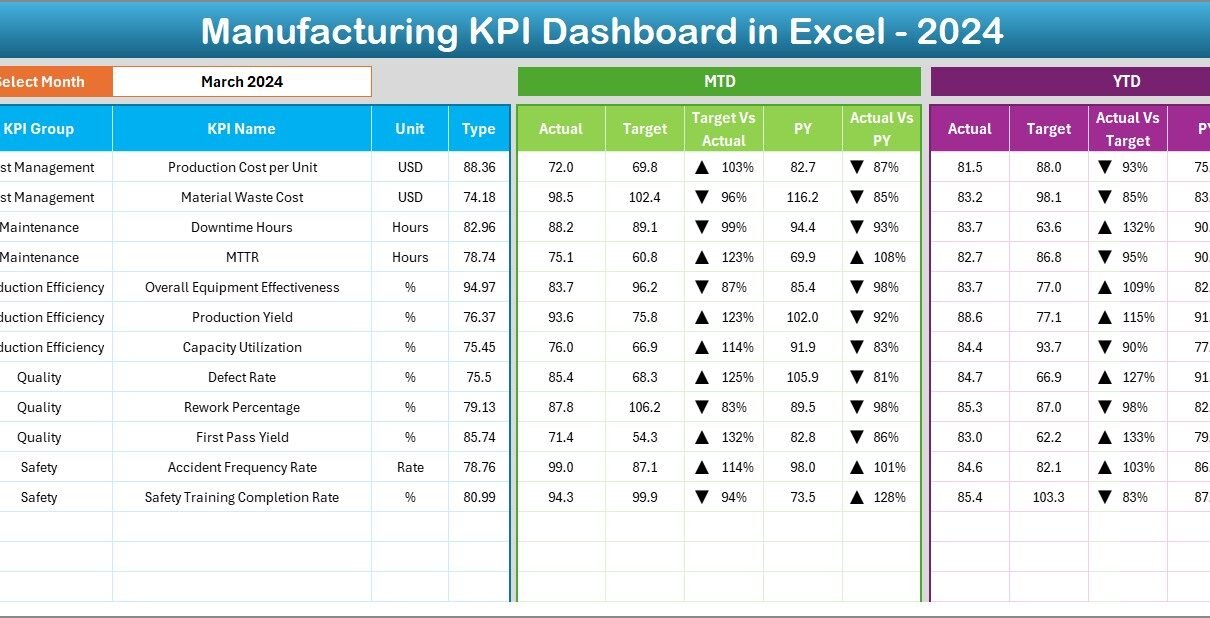
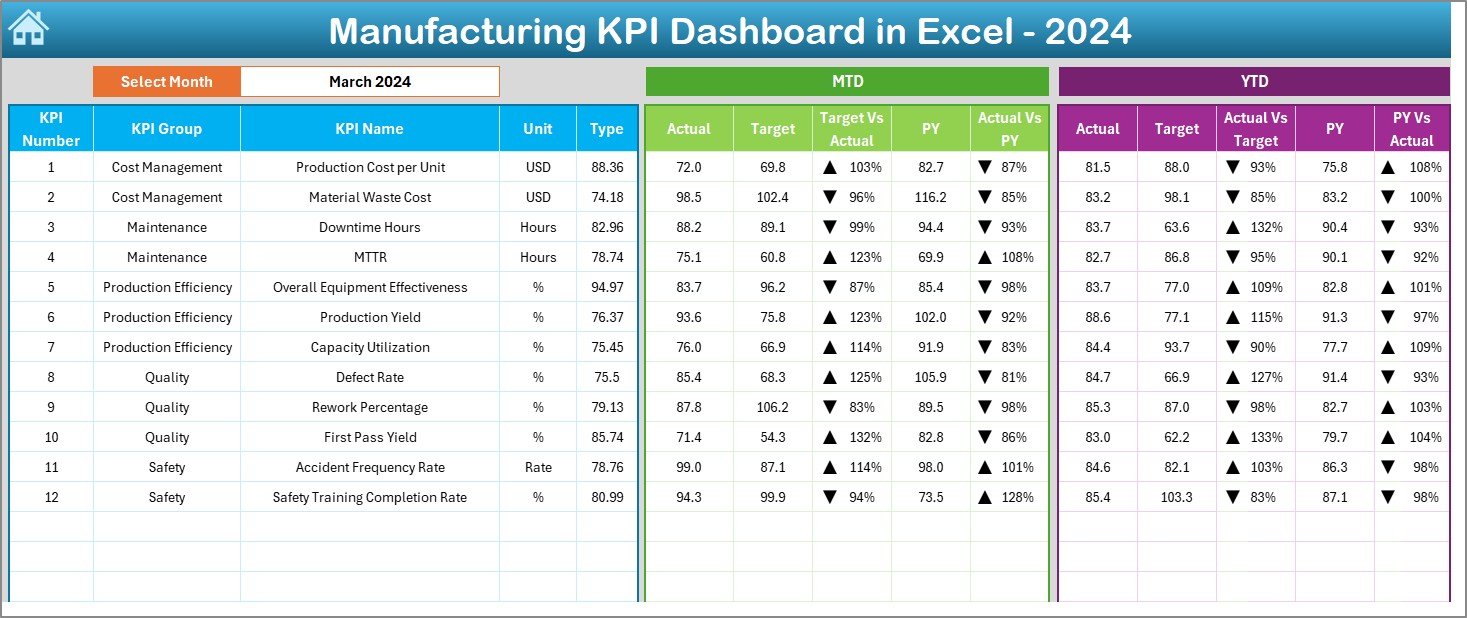
Dashboard Sheet – The Performance Overview
The Dashboard Sheet is the heart of the entire template. It visually presents all KPI metrics in one place.
Here’s what you can do on this sheet:
- Select the month from a dropdown in cell D3. Once you select a month, the entire dashboard updates dynamically.
- View Month-to-Date (MTD) and Year-to-Date (YTD) results for each KPI.
- Compare Actual, Target, and Previous Year (PY) values.
- Identify performance trends instantly using conditional formatting with up/down arrows.
- Green arrows indicate improvement.
- Red arrows signal decline.
This visual cue system helps managers make quick decisions during production reviews and meetings.
Click to buy Manufacturing KPI Dashboard in Excel
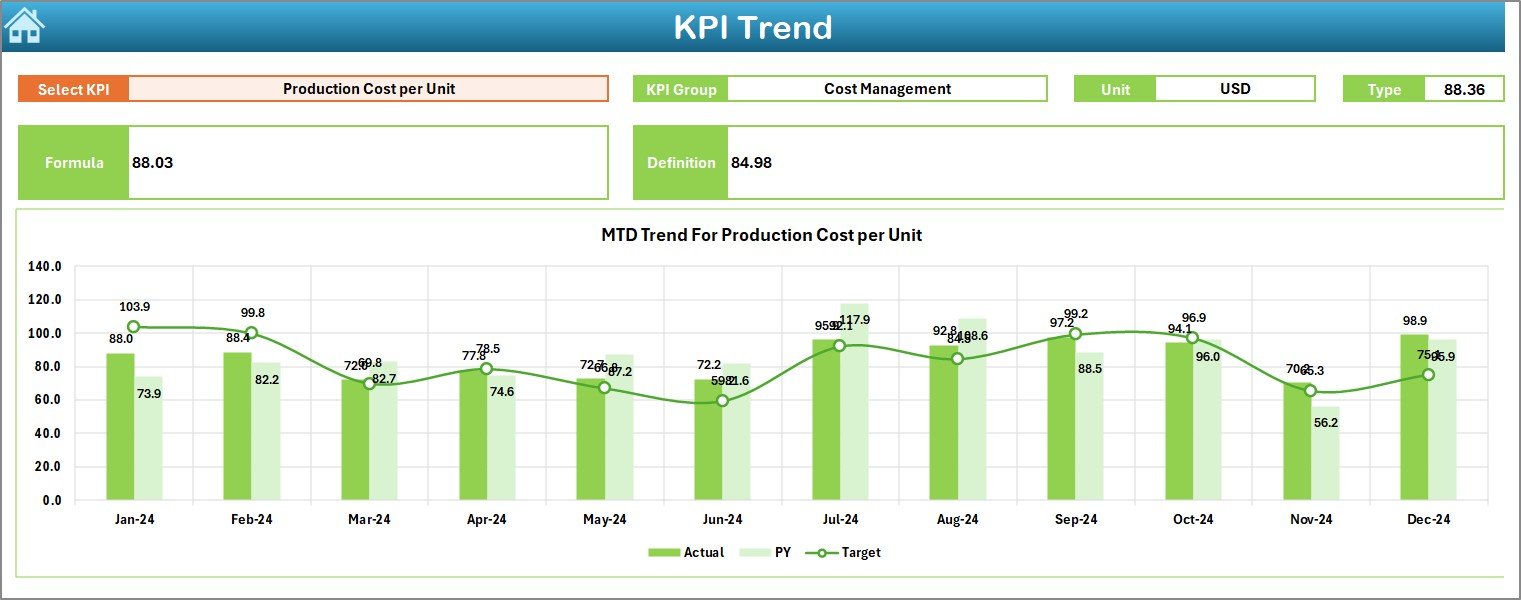
KPI Trend Sheet – Analyzing Performance Over Time
The KPI Trend Sheet offers a deeper look into each KPI’s historical behavior.
- You can select any KPI from a dropdown in cell C3.
- The sheet automatically displays KPI Group, Unit, Type (UTB or LTB), Formula, and Definition.
- It also features dynamic MTD and YTD trend charts for Actual, Target, and Previous Year values.
By analyzing trends, you can easily identify seasonal fluctuations, consistent underperformance, or areas needing improvement.
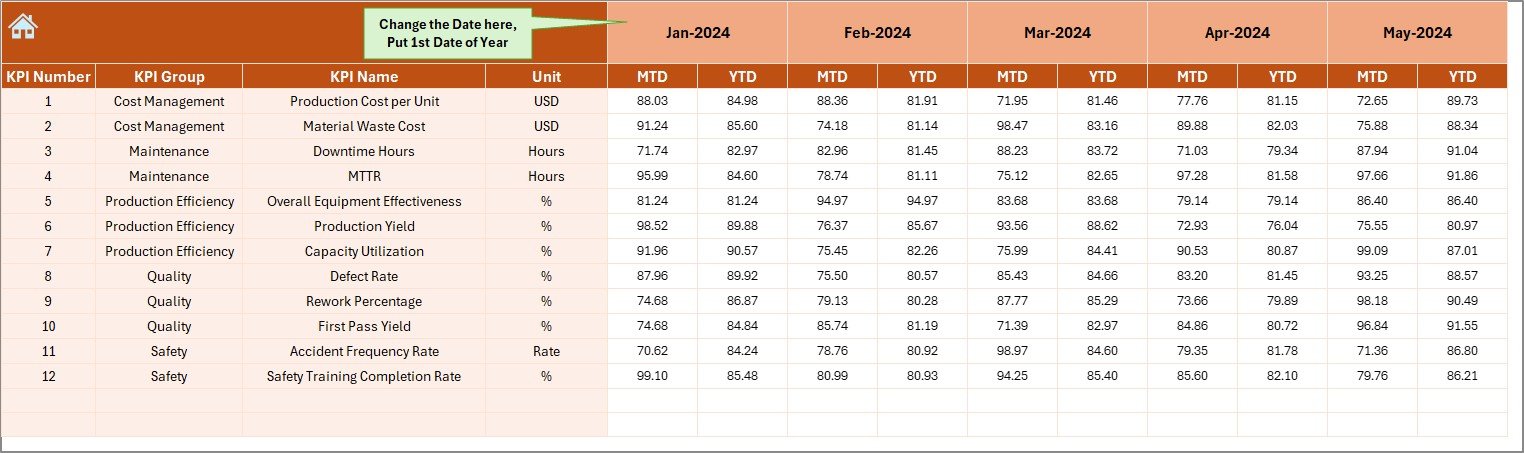
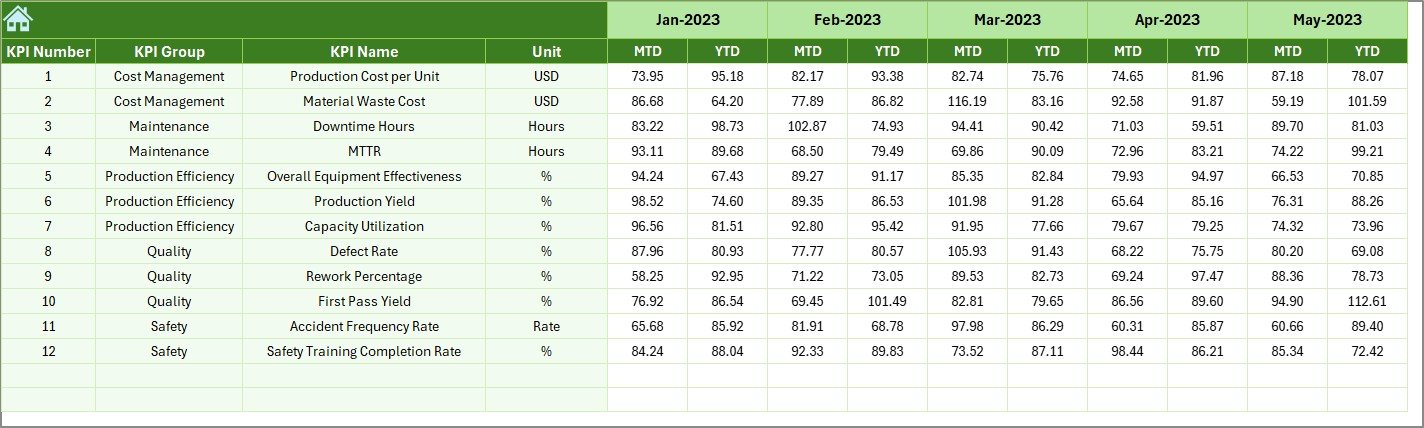
Actual Numbers Input Sheet – Capturing Real Data
This sheet is where users enter actual monthly values for each KPI.
- Enter the first month of the year in cell E1.
- The dashboard automatically adjusts its reporting period accordingly.
- Input MTD and YTD values for every KPI.
This structure ensures your dashboard always reflects accurate, up-to-date production data. It replaces manual report compilation with a single, standardized data entry point.
Click to buy Manufacturing KPI Dashboard in Excel
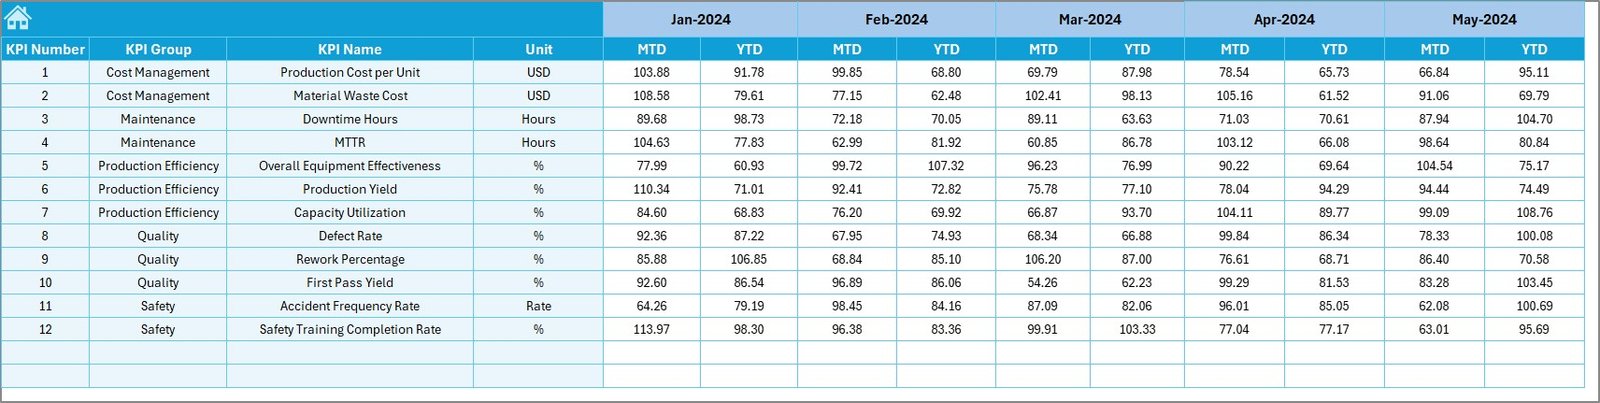
Target Sheet – Defining Success Benchmarks
Every manufacturing plant needs clear performance goals. The Target Sheet allows you to input MTD and YTD targets for each KPI.
These targets serve as reference points for comparison in the main dashboard. By aligning them with your strategic goals, you can measure whether your production processes are on track or need adjustment.
Click to buy Manufacturing KPI Dashboard in Excel
Previous Year Number Sheet – Benchmarking Against History
This sheet stores previous year’s data for each KPI. Comparing current results with historical data helps identify performance improvement or decline.
For example:
If your Defect Rate last year was 2.5% and this year it’s 1.8%, you can instantly recognize quality improvement. Similarly, tracking last year’s downtime or production cost helps evaluate process efficiency.
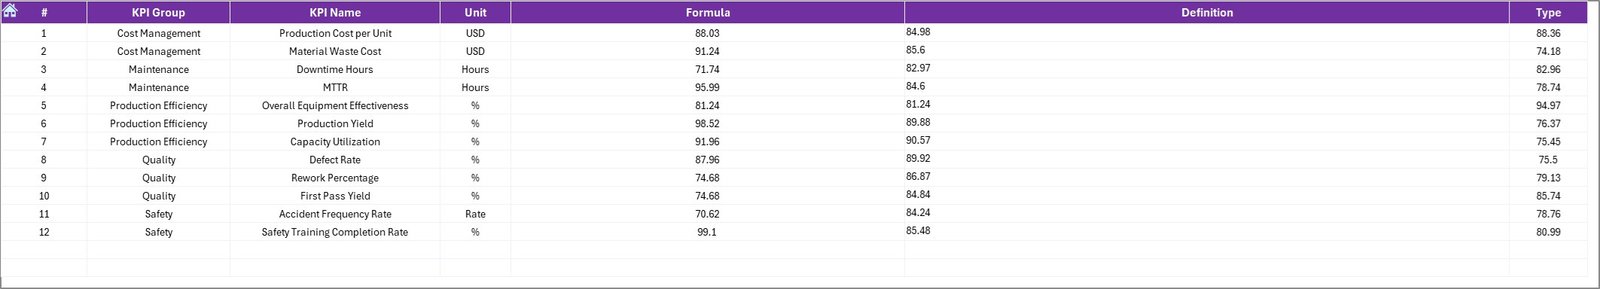
KPI Definition Sheet – Centralized Reference Guide
The KPI Definition Sheet contains essential information for each metric, including:
- KPI Name
- KPI Group
- Unit (e.g., %, Hours, Units)
- Formula
- Definition
- Type: UTB (Upper the Better) or LTB (Lower the Better)
This ensures every stakeholder understands what each KPI represents and how it’s calculated. It also keeps reporting consistent across teams and departments.
Click to buy Manufacturing KPI Dashboard in Excel
How Does the Manufacturing KPI Dashboard Work?
The dashboard follows a simple logic flow:
- Enter Data → Users input actual, target, and previous year numbers in respective sheets.
- Auto-Calculation → Excel formulas calculate MTD and YTD values automatically.
- Visualization → The dashboard presents KPIs with arrows, charts, and tables.
- Comparison → Users compare performance across months, targets, and last year’s results.
- Analysis → Managers review trends and make data-driven decisions.
This streamlined workflow helps manufacturing teams eliminate guesswork and focus on continuous improvement.
Why Use Excel for a Manufacturing KPI Dashboard?
Excel remains the most accessible, flexible, and widely used tool for business analytics. Here’s why it’s ideal for manufacturing dashboards:
- No coding or extra software required
- Easily customizable for any industry or department
- Data validation and drop-downs simplify input
- Conditional formatting highlights performance changes visually
- Charts and pivot tables enhance trend analysis
- Compatibility with Power BI, Google Sheets, and ERP data exports
With Excel, even small manufacturers can implement professional-grade reporting without expensive software licenses.
Advantages of the Manufacturing KPI Dashboard in Excel
- Real-Time Insights
The dashboard updates automatically as you enter new data. You can view real-time performance without manual recalculation.
- Better Decision-Making
Visual indicators like arrows and charts highlight problem areas, enabling faster and more confident decision-making.
- Enhanced Productivity
By eliminating multiple reports, the dashboard saves hours of manual data compilation every week.
- Data Accuracy
Standardized formulas reduce human error and maintain consistency across departments.
- Customization
You can add, remove, or modify KPIs as per your business needs, making the dashboard scalable for future growth.
- Cost-Effective
Unlike advanced BI software, Excel requires no subscription or integration cost, offering maximum value at minimal expense.
Best Practices for Using the Manufacturing KPI Dashboard in Excel
To maximize dashboard efficiency, follow these best practices:
1. Define Clear KPIs
Ensure each KPI has a clear definition, unit, and target aligned with company goals.
2. Use Consistent Data Entry
Set data validation rules to prevent input errors. Always maintain uniform units of measure.
3. Refresh Data Regularly
Update actuals at least weekly or monthly to ensure reports remain accurate.
4. Use Conditional Formatting Smartly
Limit colors and symbols to maintain clarity. Avoid overcrowding visuals.
5. Review Trends Monthly
Analyze the KPI Trend Sheet to identify deviations early and take corrective action.
6. Protect Sensitive Sheets
Lock formula cells and protect sheets to prevent accidental editing or deletion.
7. Backup Data
Save periodic backups of your Excel file to prevent data loss during updates or corruption.
How to Create Your Own Manufacturing KPI Dashboard in Excel
Building your own dashboard is easier than you think. Here’s a quick step-by-step outline:
- List Your KPIs
Identify 10–15 most critical metrics that impact production and profitability. - Create a Data Sheet
Record Actual, Target, and PY values month-wise. - Design a KPI Definition Sheet
Include KPI Group, Unit, Formula, and Type (UTB/LTB). - Add Dropdowns for Month Selection
Use Data Validation to make the dashboard interactive. - Use Conditional Formatting
Apply icons (▲ ▼) to show performance direction. - Insert Charts
Add combo charts or sparklines for visual storytelling. - Link All Sheets
Ensure all tabs feed into the main dashboard. - Test and Automate
Review formulas, protect sheets, and automate chart updates where possible. - If you prefer ready-to-use templates, tools like NextGenTemplates.com offer prebuilt dashboards with all these features configured.
Conclusion
A Manufacturing KPI Dashboard in Excel is more than a reporting tool — it’s a roadmap to process improvement and operational excellence.
By combining data visualization, trend analysis, and real-time monitoring, this dashboard empowers managers to make better, faster, and smarter decisions. Whether you manage a small workshop or a large plant, Excel gives you everything you need to track performance, reduce waste, and boost productivity.
Investing time in creating this dashboard will pay off with improved efficiency, reduced downtime, and a culture of continuous improvement.
Frequently Asked Questions (FAQs)
- What is a Manufacturing KPI Dashboard used for?
It’s used to track and visualize key manufacturing metrics such as production output, downtime, defects, and cost efficiency in one consolidated Excel file.
- Can small manufacturers use this dashboard?
Yes, small and medium manufacturers benefit the most because Excel dashboards are affordable, easy to maintain, and require no advanced software skills.
- How often should I update the dashboard?
You should update the dashboard monthly or weekly depending on your data collection frequency.
- What are the most important KPIs for manufacturing?
Key KPIs include OEE, Production Volume, Defect Rate, Cycle Time, and Machine Downtime.
- Can I link this Excel dashboard with other tools?
Yes, you can connect it with ERP exports, CSV files, or even Power BI for advanced analytics.
- Does the dashboard support visual alerts?
Absolutely! The dashboard uses conditional formatting (up/down arrows and color codes) to show real-time performance status.
- Is Excel suitable for large-scale manufacturing analysis?
Yes, Excel can handle thousands of rows efficiently, but for very large datasets, integration with Power BI or SQL is recommended.
Visit our YouTube channel to learn step-by-step video tutorials
Watch the step-by-step video tutorial:
Click to buy Manufacturing KPI Dashboard in Excel