In the insurance industry, tracking performance through data is no longer optional — it’s essential. Every policy, claim, premium, and customer interaction contributes to business success. But managing and analyzing this data across different departments can quickly become complicated. That’s where the Insurance KPI Scorecard in Excel comes in.
This powerful, ready-to-use Excel template helps insurers, brokers, and financial analysts monitor performance across key insurance functions. Whether you want to measure claims efficiency, customer satisfaction, underwriting performance, or profitability, this scorecard provides a structured, data-driven view — all in one place.
Click to buy Insurance KPI Scorecard in Excel
What Is an Insurance KPI Scorecard in Excel?
An Insurance KPI Scorecard is an Excel-based performance management tool that helps insurance companies measure, monitor, and evaluate their business metrics efficiently. It consolidates critical Key Performance Indicators (KPIs) from various domains such as claims management, underwriting, customer service, finance, and policy operations.
By combining data visualization, automated calculations, and dynamic drop-down filters, this scorecard gives teams a unified view of business performance. Managers can track MTD (Month-to-Date) and YTD (Year-to-Date) results, compare them against targets, and identify performance gaps instantly.
Structure of the Insurance KPI Scorecard
This Excel-based scorecard is divided into four main worksheets, each designed to simplify performance tracking and ensure efficient analysis.
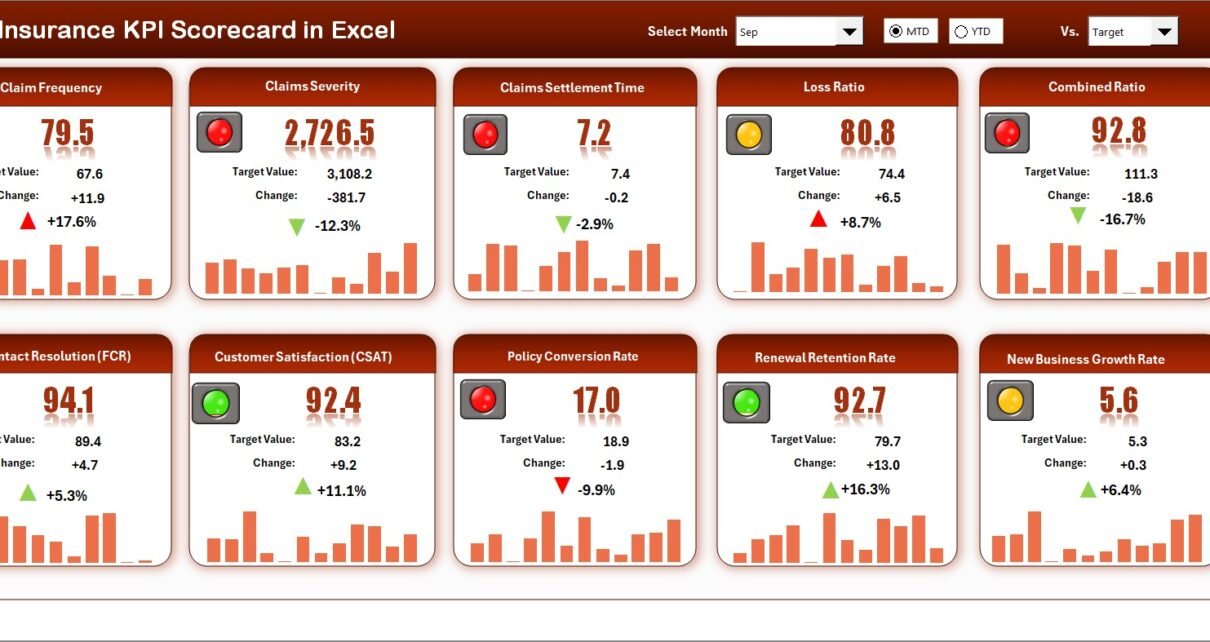
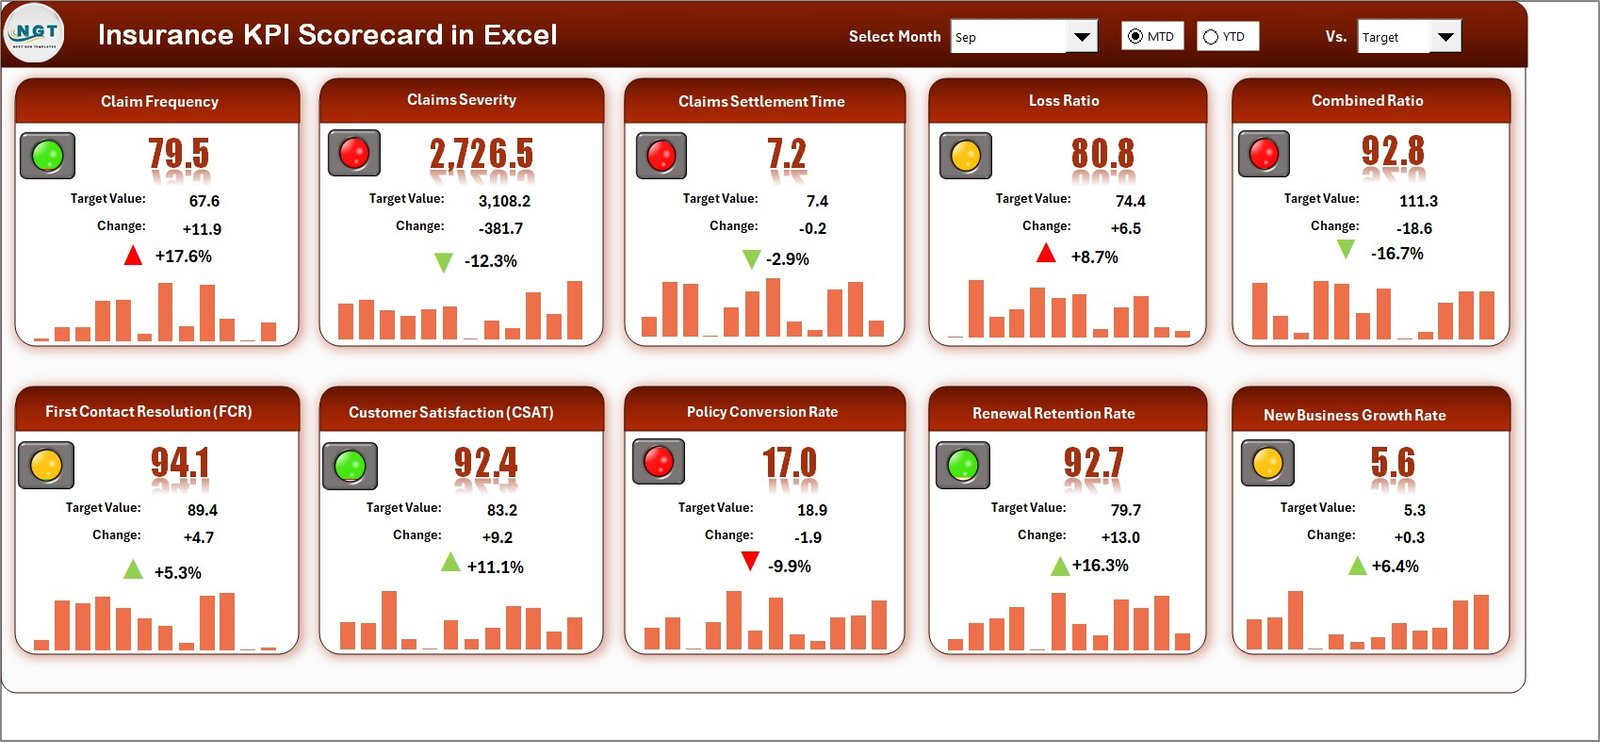
Scorecard Sheet – The Performance Dashboard
The Scorecard Sheet is the main interface of the template. It’s where you’ll see all your KPIs and visual performance indicators in one glance.
Key features include:
- Dropdown Menus: Select the month and choose whether to view MTD or YTD data for detailed analysis.
- Actual vs Target Comparison: Instantly compare performance results against defined targets.
- Color-Coded Indicators: Visual cues like red, green, or yellow highlight underperforming or exceeding KPIs.
- Comprehensive View: Display up to 10 KPIs simultaneously for a quick performance overview.
- Automatic Update: Data changes reflect automatically once the Input Data Sheet is updated.
This sheet acts as the executive summary — helping decision-makers focus on performance results and trends without deep diving into the raw data.
Click to buy Insurance KPI Scorecard in Excel
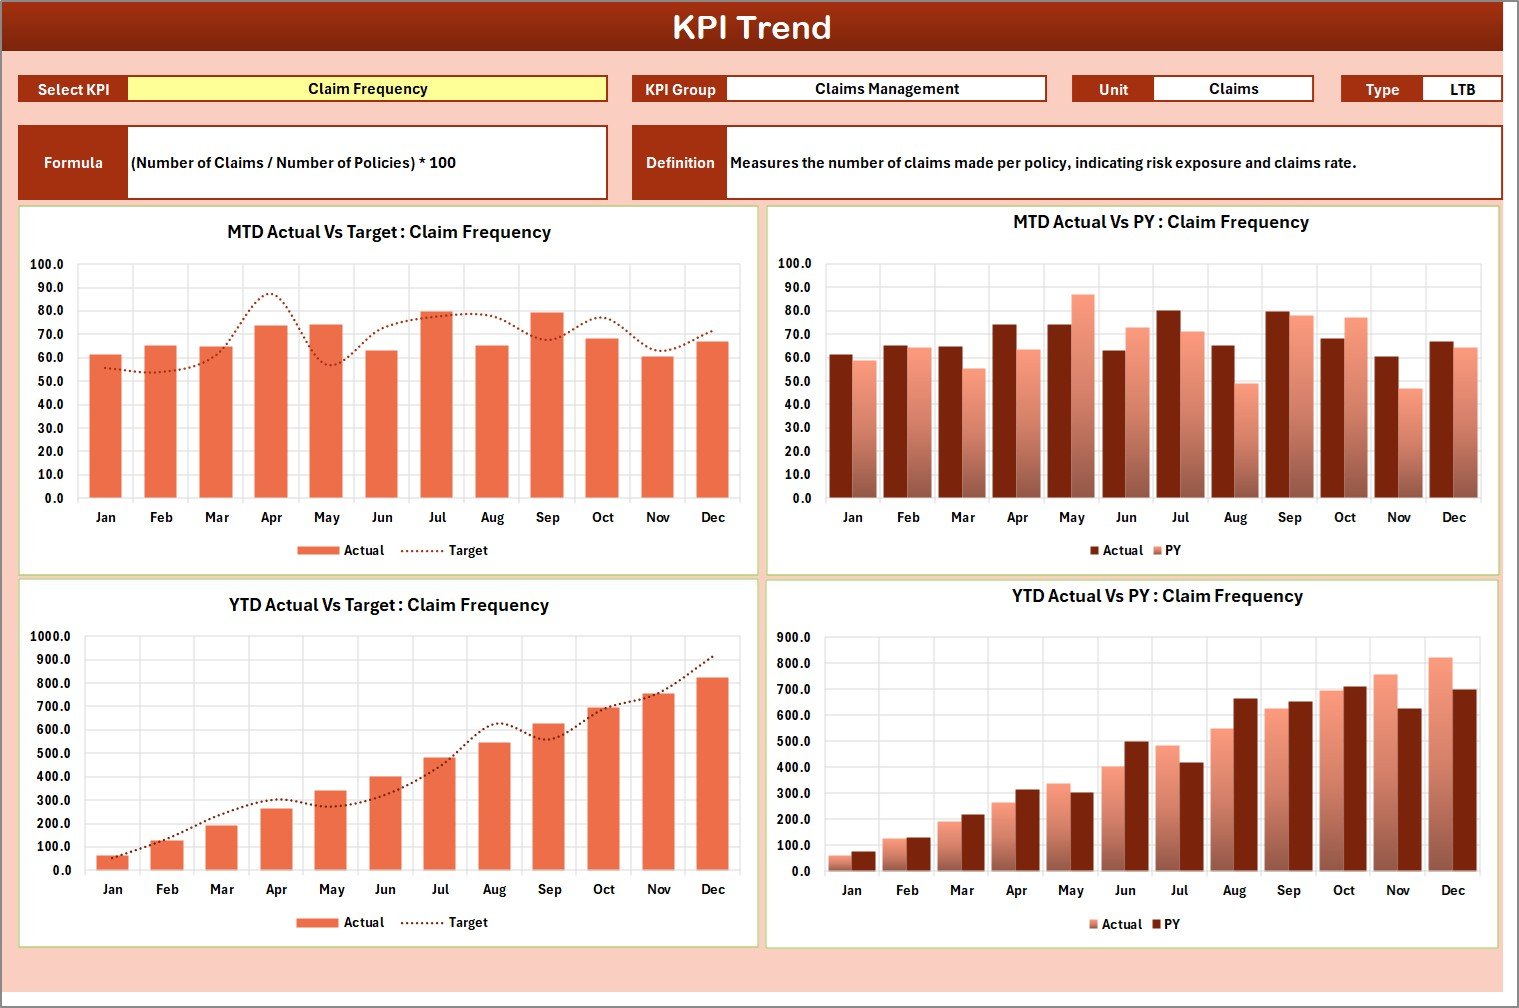
KPI Trend Sheet – Analyze Historical Trends
The KPI Trend Sheet allows you to explore data trends over time.
Here, users can select a KPI Name from the dropdown menu in cell C3 to view detailed performance analysis.
Displayed information includes:
- KPI Group
- Unit of Measurement
- Type of KPI (Lower the Better / Upper the Better)
- Formula and Definition of KPI
- MTD and YTD Trend Charts for Actual, Target, and Previous Year
These trend charts help identify whether KPIs are improving, stagnating, or declining. For instance, tracking “Claim Settlement Time” across months can reveal whether operational efficiency is improving or not.
Click to buy Insurance KPI Scorecard in Excel
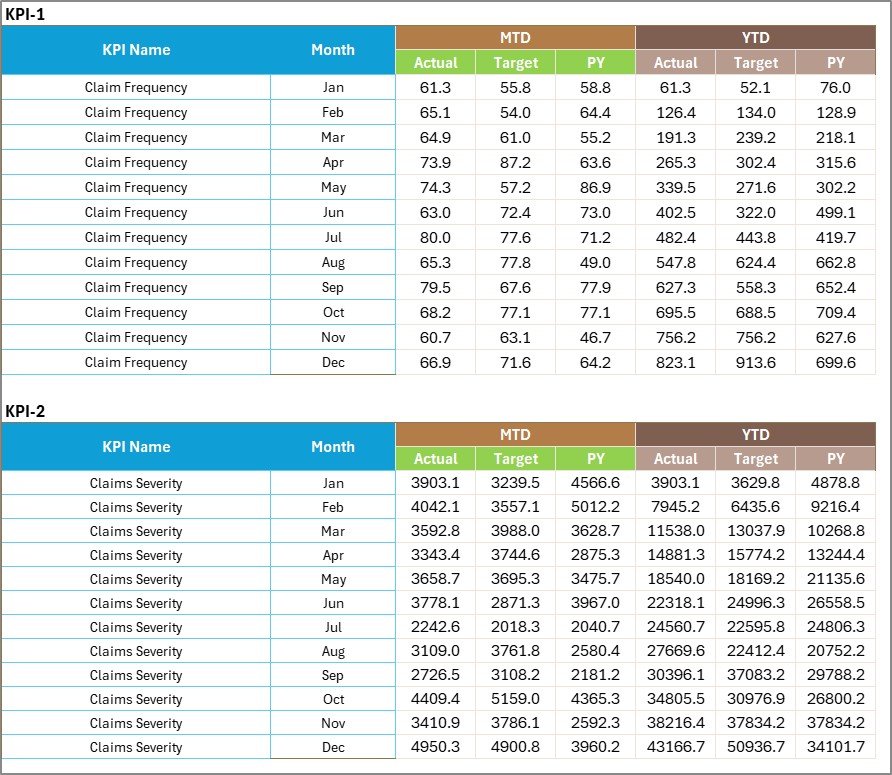
Input Data Sheet – Manage All KPI Data
The Input Data Sheet serves as the data foundation for the entire scorecard. It’s where all KPI-related values are entered and stored.
Key features include:
- Data Entry Columns: Enter actuals, targets, and other key metrics for each KPI.
- Editable and Expandable: Add or modify KPIs as your business grows.
- Seamless Updates: Once data is updated here, the entire dashboard recalculates automatically.
This sheet ensures the template remains flexible and adaptable to your organization’s changing reporting needs.
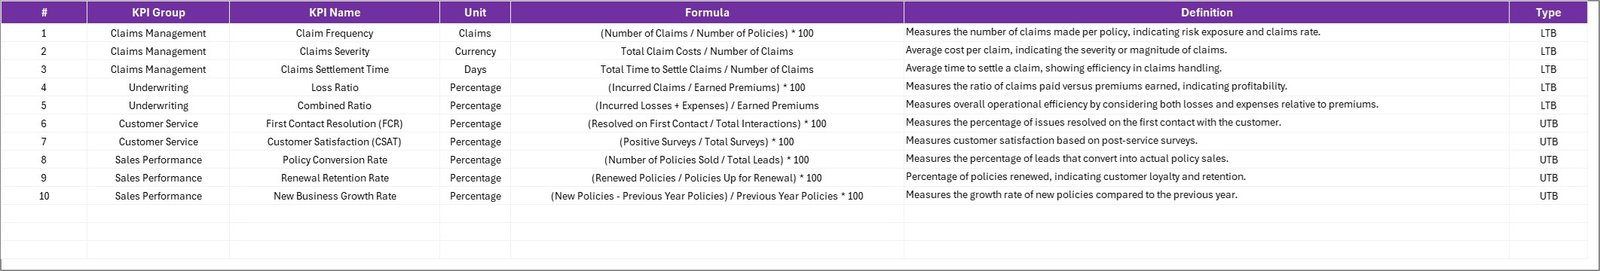
KPI Definition Sheet – Define and Standardize Metrics
The KPI Definition Sheet ensures consistency and understanding across teams. Each KPI is defined clearly to avoid confusion.
You’ll find fields for:
- KPI Name
- KPI Group
- Unit
- Formula
- Definition
- Type (UTB or LTB)
This standardization helps maintain uniformity across the organization and ensures that everyone interprets each KPI the same way.
Click to buy Insurance KPI Scorecard in Excel
Why Every Insurance Company Needs a KPI Scorecard
Insurance businesses generate massive amounts of data every day — from policy renewals to claims settlements. Without a proper tracking system, it’s nearly impossible to identify improvement areas.
Here’s why an Excel-based KPI Scorecard is essential:
- Real-time Decision-Making: Compare actual vs. target performance instantly.
- Centralized Data: Access all departmental metrics in one location.
- Cost-Effective Solution: No need for expensive BI tools; Excel does the job efficiently.
- Easy Customization: Add, modify, or remove KPIs to match your specific business processes.
- Data Visualization: Charts and conditional formatting make data easy to interpret.
In short, this scorecard turns raw numbers into actionable insights, enabling better forecasting and resource allocation.
Key KPIs You Can Track Using the Insurance KPI Scorecard
Below are some commonly tracked metrics in the insurance sector that can be included in this scorecard:
Financial KPIs
- Premium Growth Rate (%) – Measures the increase in earned premiums over time.
- Loss Ratio (%) – Compares claims paid to premiums earned.
- Expense Ratio (%) – Shows the percentage of expenses compared to total premiums.
- Combined Ratio (%) – The sum of loss and expense ratios to determine overall efficiency.
Customer KPIs
- Customer Retention Rate (%) – Percentage of policyholders renewing their policies.
- New Policy Conversion Rate (%) – Ratio of new policies sold to total leads generated.
- Claim Settlement Time (Days) – Average number of days taken to settle claims.
Operational KPIs
- Policy Issuance Accuracy (%) – Tracks accuracy of policy documentation.
- Claim Rejection Rate (%) – Percentage of claims rejected due to invalid reasons.
- Employee Productivity Index – Measures output per employee across processes.
By customizing these KPIs, you can tailor the dashboard to fit your company’s specific goals — whether you’re a life, health, or general insurance provider.
Advantages of Using the Insurance KPI Scorecard in Excel
An Excel-based scorecard provides more than just performance tracking — it enhances transparency, efficiency, and collaboration across departments.
- Centralized Reporting
All performance metrics are consolidated into one workbook. Managers no longer need to sift through multiple spreadsheets or reports.
- Improved Accuracy
Automated formulas and references reduce manual errors and ensure accuracy in reporting.
- Easy Visualization
Conditional formatting, traffic-light indicators, and trend charts make complex data visually intuitive.
- Cost Efficiency
Excel requires no additional investment — it’s already available and widely understood by most professionals.
- Flexibility and Scalability
You can easily add new KPIs, modify targets, or expand the data without redesigning the file.
- Better Strategic Decision-Making
With instant comparisons between actual and target data, leaders can make data-driven decisions faster and more effectively.
How to Use the Insurance KPI Scorecard in Excel
Implementing the scorecard is straightforward. Follow these steps to get started:
- Open the Template: Download and open the Excel file.
- Enter Data in the Input Sheet: Input your actual, target, and previous year’s figures.
- Review the Scorecard: Go to the Scorecard Sheet and select the desired month from the dropdown.
- Analyze Trends: Visit the KPI Trend Sheet to study performance over time.
- Customize KPI Definitions: Add or edit KPI details in the KPI Definition Sheet.
By following these steps, your organization can track both operational and strategic KPIs efficiently.
How the KPI Scorecard Supports Data-Driven Decision Making
The real strength of this scorecard lies in its ability to transform static data into dynamic insights.
- It aligns business objectives with measurable metrics.
- It highlights underperforming areas, prompting timely corrective actions.
- It simplifies communication between departments by standardizing performance reports.
- It enhances accountability, as every KPI is linked to specific teams or individuals.
Ultimately, this Excel tool acts as the bridge between raw data and business intelligence.
Opportunities for Improvement
Even the best scorecards can evolve further. Here are a few opportunities to enhance this Excel system:
- Automate Data Import: Link the Input Data Sheet to your CRM or ERP system for real-time updates.
- Add Interactive Buttons: Create navigation buttons for faster access to key sheets.
- Integrate VBA Automation: Add user forms for easy data entry and monthly summary reports.
- Expand KPI Library: Include more advanced metrics like Risk Exposure, Solvency Ratio, or Policy Renewal Cycle Time.
- Create Department-Wise Dashboards: Segment KPIs for Claims, Underwriting, and Finance for focused insights.
Best Practices for Using the Insurance KPI Scorecard
Follow these practical tips to get the most out of your scorecard:
Define Clear KPIs
Make sure every KPI has a defined purpose, formula, and responsible owner.
Maintain Data Accuracy
Regularly update the Input Data Sheet and cross-verify figures before analysis.
Review Performance Monthly
Monthly reviews keep teams aligned and help identify patterns early.
Use Conditional Formatting Effectively
Visual cues like green for good and red for poor performance enhance readability.
Keep It Simple
Avoid overloading the scorecard with unnecessary data — focus on actionable insights.
Protect the Workbook
Lock key formulas and sheets to prevent accidental changes.
By following these practices, your insurance scorecard becomes a reliable and long-term management tool.
Advantages for Different Stakeholders
For Executives
Quick overview of company performance through summarized KPIs.
For Department Heads
Ability to drill down into specific operational or departmental metrics.
For Analysts
Streamlined data preparation, easy export, and trend visualization for presentations.
For Employees
Transparency into how their efforts contribute to organizational success.
Real-World Benefits of an Insurance KPI Scorecard
Let’s look at how implementing this scorecard can transform insurance operations:
- Enhanced Performance Transparency: Everyone knows what success looks like and how it’s measured.
- Reduced Reporting Time: Automated calculations save hours of manual effort.
- Data-Driven Culture: Decisions are based on facts, not assumptions.
- Higher Customer Satisfaction: By tracking service metrics, insurers can resolve issues faster.
- Regulatory Compliance: Keeping accurate data ensures easier audit trails and compliance reporting.
These benefits make it clear that the KPI scorecard isn’t just a tool — it’s a management framework for continuous improvement.
Integration Possibilities
Though the Insurance KPI Scorecard works perfectly in standalone Excel mode, you can integrate it with other tools for even more value:
- Power BI: Convert it into an interactive dashboard with visuals and slicers.
- Google Sheets: Collaborate with teams online using shared access.
- Power Automate or VBA: Automate monthly updates and report generation.
- SQL or ERP Systems: Pull live data directly into the Input Sheet for real-time tracking.
These integrations help organizations scale from manual monitoring to smart analytics.
Conclusion
The Insurance KPI Scorecard in Excel is more than just a spreadsheet — it’s a complete performance monitoring ecosystem.
It allows insurers to track key metrics across departments, visualize trends, and make better strategic decisions. With its intuitive design, automated formulas, and data-driven insights, it simplifies the entire performance tracking process.
Whether you’re an insurance manager, analyst, or executive, this scorecard empowers you to lead with clarity, confidence, and measurable results.
Frequently Asked Questions (FAQs)
- What is the purpose of an Insurance KPI Scorecard?
It helps insurance companies track their operational and financial KPIs in one centralized Excel file, enabling better decision-making.
- Can I customize the KPIs in the template?
Yes. You can edit, add, or remove KPIs in the KPI Definition Sheet based on your organization’s goals.
- Is this scorecard suitable for all types of insurance?
Absolutely. It works for life, health, general, or specialty insurance businesses with slight KPI adjustments.
- How often should I update the data?
You can update it monthly or quarterly depending on your reporting cycle.
- Does the scorecard require any technical knowledge?
No. It’s completely Excel-based and user-friendly, designed for non-technical professionals.
- Can I integrate this scorecard with Power BI?
Yes. The Excel data can easily serve as a data source for Power BI dashboards for advanced visualization.
- What are the major KPIs to include?
Common KPIs include Loss Ratio, Claim Settlement Time, Premium Growth Rate, and Customer Retention Rate.
- How does conditional formatting help in this template?
It highlights performance using colors and symbols, allowing quick recognition of progress or concern areas.
Visit our YouTube channel to learn step-by-step video tutorials
Watch the step-by-step video tutorial:
Click to buy Insurance KPI Scorecard in Excel