In today’s fast-paced legal environment, data management and performance tracking are critical. Legal firms, compliance departments, and corporate legal teams deal with hundreds of cases, clients, and deadlines every month. Managing all this manually often leads to errors, inefficiency, and missed opportunities.
That’s where the Legal Dashboard in Excel comes in — a ready-to-use, data-driven solution that turns complex legal data into meaningful insights. Built entirely in Microsoft Excel, this dashboard provides a centralized view of all legal performance metrics such as total cases, costs, client satisfaction, and case progress.
Let’s explore how this dynamic tool empowers legal teams to make smarter decisions, improve productivity, and deliver better results.
Click to buy Legal Dashboard in Excel
What Is a Legal Dashboard in Excel?
A Legal Dashboard in Excel is an interactive reporting tool that consolidates all key data points from your legal operations into one centralized platform. It displays real-time analytics about cases, clients, departments, costs, and overall performance using dynamic charts and tables.
With automated formulas and pivot tables, this dashboard simplifies complex legal management processes. It allows lawyers, administrators, and executives to visualize data without relying on separate reports or manual calculations.
Key Metrics Tracked in the Dashboard
This dashboard focuses on the most essential metrics, including:
- Total Cases — The overall number of cases handled during a specific time period.
- Average Client Satisfaction Score — An indicator of service quality based on client feedback.
- Total Actual Costs — The total expenses incurred while managing all cases.
- Total Estimated Cost — The projected costs calculated before the case begins.
- Open Case % — The proportion of cases still pending compared to the total.
These key performance indicators (KPIs) provide a clear overview of legal team productivity and financial efficiency.
Structure of the Legal Dashboard in Excel
The Legal Dashboard in Excel is designed with multiple sheet tabs to organize and display data efficiently. Each tab serves a distinct analytical purpose.
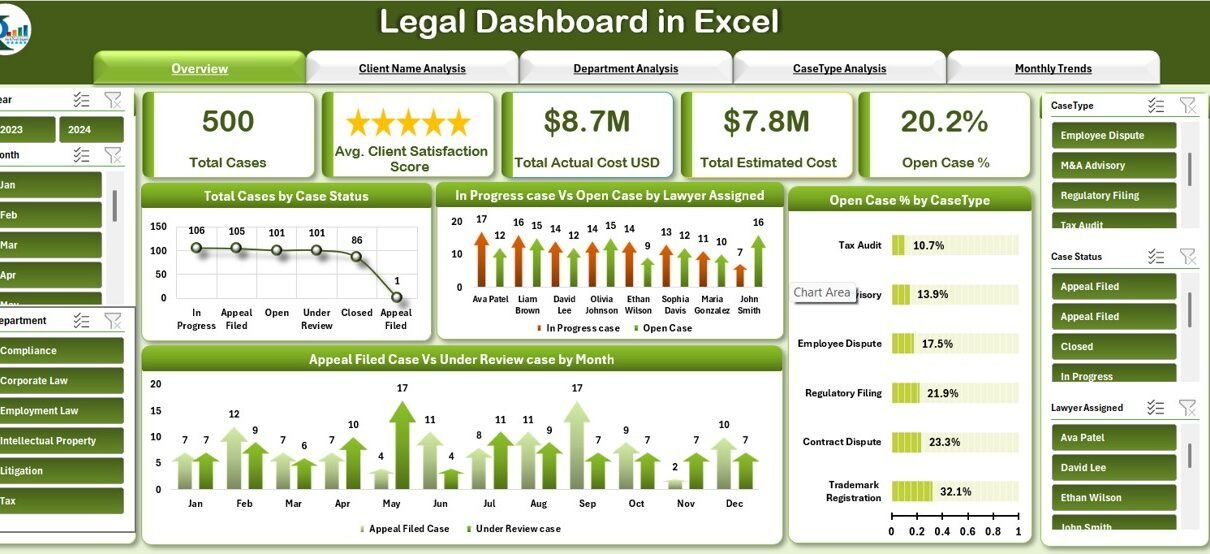
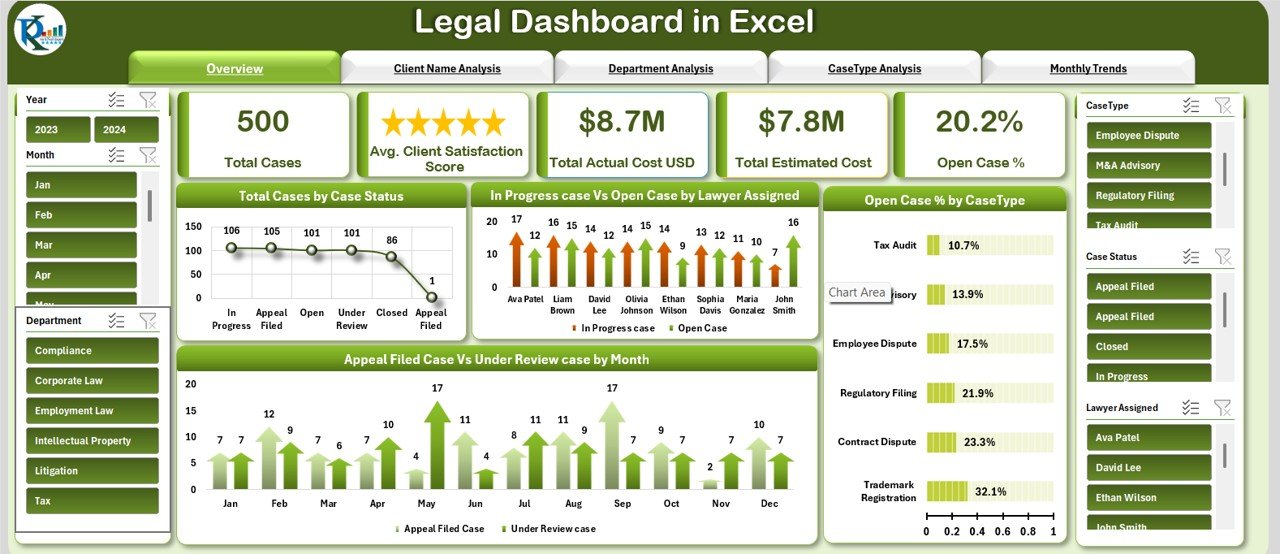
Overview Sheet Tab
The Overview Sheet acts as the main summary page. It highlights key metrics and provides a snapshot of your firm’s performance.
Cards Section:
- Total Cases
- Average Client Satisfaction Score
- Total Actual Costs
- Total Estimated Cost
- Open Case Percentage
Charts Section:
- Total Cases by Case Status
- Average Client Satisfaction Score by Client Name
- Total Estimated Hours by Client Name
- Total Estimated Cost (USD) by Client Name
This visual presentation helps users grasp performance at a glance. Whether you’re a partner, manager, or associate, you can instantly see how your firm is performing in terms of workload, cost, and client satisfaction.
Click to buy Legal Dashboard in Excel
Client Name Analysis Sheet Tab
This tab offers an in-depth view of client-level performance. Understanding client trends helps identify profitable relationships and areas for improvement.
Charts Included:
- Total Cases by Client Name
- Total Estimated Hours by Client Name
- Total Estimated Cost (USD) by Client Name
- Average Client Satisfaction Score by Client Name
With this view, you can easily track which clients have the most active cases, how much time is being spent on each, and whether client satisfaction aligns with cost and effort.

Click to buy Legal Dashboard in Excel
Department Analysis Sheet Tab
Every department within a legal organization contributes differently to overall performance. The Department Analysis Tab highlights departmental efficiency, resource allocation, and case load balance.
Charts Included:
- Total Cases by Department
- Average Client Satisfaction Score by Department
- Open Case vs. In-Progress Case by Department
- Cost Variance (USD) by Department
This helps management pinpoint departments that are under or overperforming, allowing for better staffing, budgeting, and strategic planning.

Click to buy Legal Dashboard in Excel
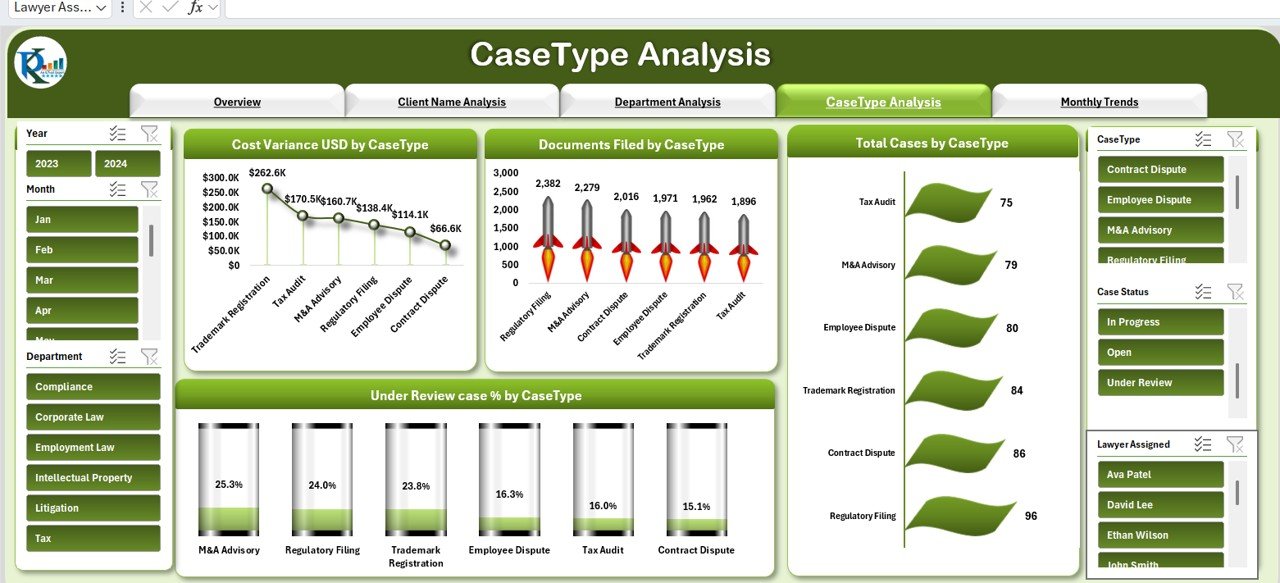
Case Type Analysis Sheet Tab
Legal cases often vary by type — litigation, arbitration, compliance, or advisory. Each case type carries different cost structures and timelines.
Charts Included:
- Cost Variance (USD) by Case Type
- Under Review Case % by Case Type
- Cost of Goods Sold (COGS) by Category
This section helps track which case types are consuming the most time and resources, and whether the estimated vs. actual costs align with expectations.
Click to buy Legal Dashboard in Excel
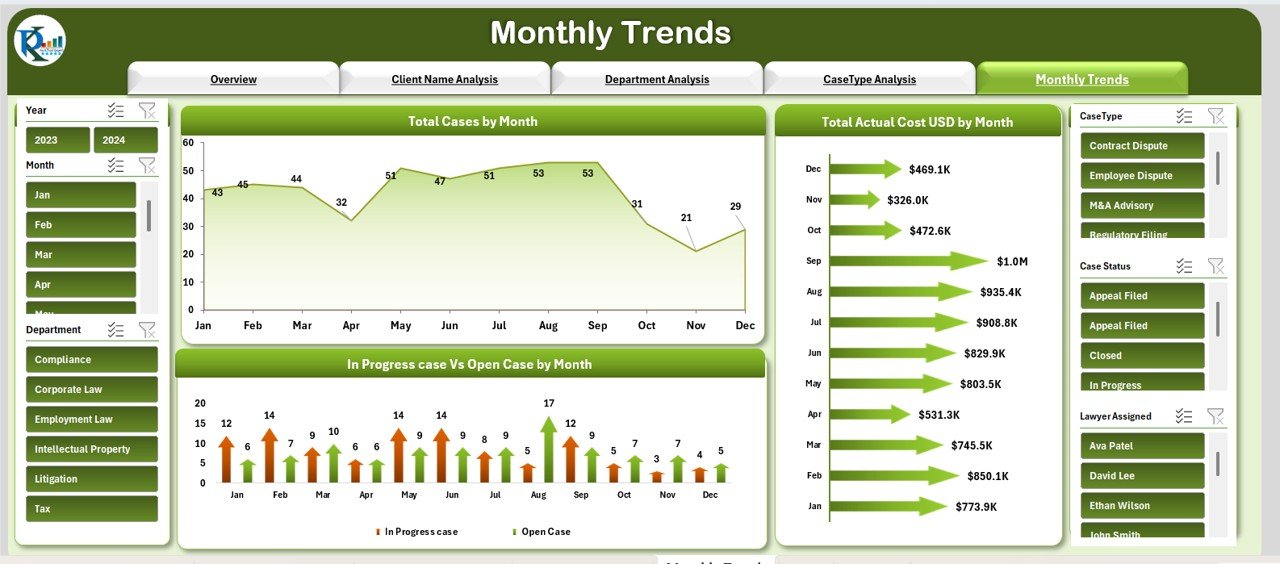
Monthly Trends Sheet Tab
Monitoring monthly progress is essential for continuous improvement. The Monthly Trends Tab focuses on time-based performance.
Charts Included:
- Total Cases by Month
- In-Progress vs. Open Cases by Month
- Total Actual Cost (USD) by Month
With these charts, legal managers can spot seasonal fluctuations, track monthly spending trends, and analyze whether workload and costs are increasing or stabilizing.
Data Sheet Tab
The Data Sheet is the foundation of the entire dashboard. It serves as the data entry and storage hub where all information is maintained. Every chart, card, and KPI in the dashboard pulls data from this sheet.
Users simply input or paste their case details here — including client name, department, case type, status, estimated hours, actual costs, and satisfaction scores — and the dashboard automatically updates all visuals.
This structure ensures transparency, consistency, and ease of use even for non-technical users.
Why Use a Legal Dashboard in Excel?
The legal industry is becoming increasingly data-driven. Relying on manual tracking or multiple spreadsheets can slow down decision-making and create inaccuracies. A Legal Dashboard in Excel addresses these challenges by offering automation, visualization, and analytical clarity.
Here are some major reasons why this tool is essential:
- Centralized Data Visibility
All critical legal metrics are available in one location. Users no longer need to switch between multiple reports.
- Real-Time Performance Monitoring
As soon as data changes in the Data Sheet, the entire dashboard updates automatically. This ensures you always view the latest insights.
- Improved Decision-Making
Charts and KPIs make it easy to identify trends — like which clients cost the most or which departments have the slowest response times.
- Cost Control and Transparency
By comparing estimated vs. actual costs, the dashboard helps identify budget variances and inefficiencies.
- Client Relationship Management
The client-level analysis empowers teams to enhance client satisfaction and retention.
How to Use the Legal Dashboard in Excel
Using this dashboard is simple and intuitive. Here’s a quick step-by-step guide:
- Enter Your Data: Fill out the Data Sheet with details like Client Name, Department, Case Type, Case Status, Costs, and Satisfaction Scores.
- Review the Overview Page: See the automatic updates across key cards and charts.
- Drill Down by Client or Department: Navigate through analysis sheets to identify patterns and outliers.
- Monitor Monthly Trends: Track how costs and cases evolve each month.
- Export and Share: You can easily print or export the dashboard to share performance reports with your team or clients.
Advantages of the Legal Dashboard in Excel
The Legal Dashboard in Excel offers multiple benefits for law firms and corporate legal departments:
1. Enhanced Productivity
Automated calculations save hours of manual reporting, allowing teams to focus on legal strategy instead of data management.
2. Better Financial Oversight
Visual comparisons of actual and estimated costs improve cost control and forecasting accuracy.
3. Smarter Resource Allocation
Department-wise insights help allocate staff and time where they’re most needed.
4. Improved Client Satisfaction
Tracking satisfaction scores ensures consistent quality service across all clients.
5. Data-Driven Decision-Making
Interactive visuals reveal actionable insights, helping leaders identify opportunities and challenges instantly.
6. Easy Implementation
Built in Excel, it doesn’t require special software or training. Anyone familiar with spreadsheets can use it.
Best Practices for Using the Legal Dashboard in Excel
To maximize the value of your Legal Dashboard, follow these best practices:
1. Keep Data Clean and Consistent
Ensure your Data Sheet has no missing values or duplicate records. Clean data ensures accurate charts and calculations.
2. Update Regularly
Refresh data at least weekly to keep your insights current and relevant.
3. Define KPIs Clearly
Before entering data, agree on standard definitions for terms like “Open Case,” “Closed Case,” or “Client Satisfaction.”
4. Customize Charts
Tailor charts to reflect what matters most to your firm — for example, focus on case types with the highest revenue or risk.
5. Use Conditional Formatting
Highlight key changes with color-coded indicators such as arrows for cost variance or satisfaction drops.
6. Automate Where Possible
Leverage Excel formulas or macros to calculate totals, averages, and percentages automatically.
How the Dashboard Supports Legal Strategy
Data visualization isn’t just about reporting — it’s about driving strategy. By analyzing patterns in costs, workloads, and client feedback, firms can:
- Identify unprofitable clients or case types
- Optimize staff allocation
- Improve client communication
- Set realistic performance targets
- Reduce turnaround time for critical cases
In other words, the dashboard acts as your digital command center for legal operations.
Who Can Benefit from the Legal Dashboard in Excel?
This dashboard isn’t limited to law firms. It’s equally beneficial for:
- Corporate Legal Departments managing compliance and litigation.
- Consulting Firms tracking client engagements.
- Independent Attorneys monitoring personal caseloads.
- Legal Process Outsourcing (LPO) Firms managing multiple clients simultaneously.
Whether you’re a solo practitioner or part of a large legal team, this Excel tool adapts to your operational needs.
Customization Ideas for Advanced Users
If you want to enhance your dashboard further, consider these creative customization ideas:
- Add slicers to filter by case status, department, or time period.
- Incorporate trend lines for forecasting.
- Create interactive buttons for easy navigation between sheets.
- Integrate pivot tables for detailed drill-down analysis.
- Add conditional icons (arrows or traffic lights) for visual KPI performance.
These additions make your dashboard even more powerful and interactive.
Conclusion
The Legal Dashboard in Excel transforms how legal professionals manage and analyze data. Instead of juggling spreadsheets and reports, you get a single, dynamic tool that simplifies performance tracking and decision-making.
By consolidating all your key metrics — from cases and costs to client satisfaction — this dashboard ensures transparency, efficiency, and strategic growth. Best of all, it’s built in Excel, so it’s accessible, customizable, and ready to use immediately.
When law firms embrace data-driven management, they gain a competitive edge. The Legal Dashboard in Excel helps you achieve exactly that — turning numbers into insights and insights into action.
Frequently Asked Questions (FAQs)
- What is a Legal Dashboard in Excel?
It’s an interactive Excel-based tool that visualizes legal performance metrics such as cases, costs, and client satisfaction in one centralized location.
- Who can use this dashboard?
It’s ideal for law firms, corporate legal departments, consultants, and individual attorneys who need to monitor performance efficiently.
- How often should I update the dashboard?
You should update it weekly or monthly, depending on your case activity, to keep insights accurate.
- Can I customize the dashboard?
Yes, absolutely. You can add new KPIs, modify charts, or include additional sheets according to your firm’s needs.
- Do I need advanced Excel skills to use it?
No. The dashboard is beginner-friendly and works with simple data entry and automated calculations.
- What’s the biggest advantage of using this dashboard?
It saves time, enhances decision-making, and improves client satisfaction through better visibility and control.
Visit our YouTube channel to learn step-by-step video tutorials
Watch the step-by-step video tutorial:
Click to buy Legal Dashboard in Excel