The world of music and performing arts thrives on creativity, passion, and expression — but behind every stage performance, concert, or art event lies a complex web of data-driven decisions. Managing finances, audience engagement, performer satisfaction, and event performance requires more than intuition — it requires data visualization and performance tracking.
That’s where the Music & Performing Arts KPI Dashboard in Excel comes in — a ready-to-use, fully automated, and interactive Excel-based solution that helps organizations, academies, and event managers analyze key performance indicators (KPIs) effortlessly.
Click to buy Music & Performing Arts KPI Dashboard in Excel
What Is a Music & Performing Arts KPI Dashboard?
A Music & Performing Arts KPI Dashboard is an analytical tool designed to monitor and visualize essential performance metrics across music academies, performing arts institutions, event organizers, and production houses.
This dashboard helps teams track performance, revenue, attendance, and operational efficiency across different departments — all in one place.
Instead of dealing with multiple spreadsheets and manual calculations, this Excel-based template provides real-time insights using charts, conditional formatting, and dropdown-driven interactivity.
Structure of the Dashboard
The Music & Performing Arts KPI Dashboard in Excel is thoughtfully designed with seven key worksheets, each serving a unique purpose to ensure smooth tracking and reporting.
Here’s a breakdown of each section:
Summary Page
This is the main navigation hub of the dashboard. It works as an index page containing six buttons that allow users to jump directly to respective sheets.
This layout helps users quickly navigate between different analytical pages without scrolling or searching manually. It’s ideal for professionals who want a clean, interactive, and organized interface.

Click to buy Music & Performing Arts KPI Dashboard in Excel
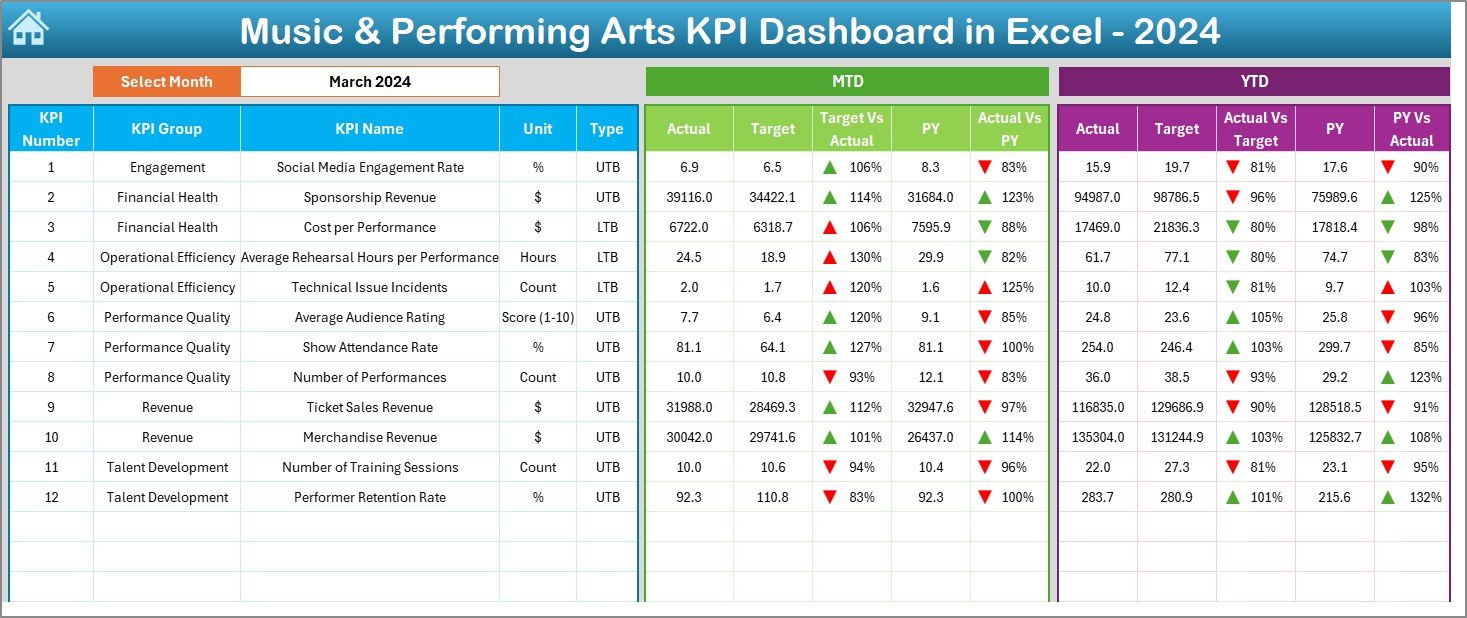
Dashboard Sheet Tab
The Dashboard Sheet is the heart of the entire workbook. It provides a comprehensive summary of all the KPIs for the selected month.
On the range D3, users can select a month from the dropdown list. Instantly, all charts and values across the dashboard update automatically.
What You’ll Find Here:
- (Month-to-Date) and YTD (Year-to-Date) data for each KPI.
- Comparisons between Actual, Target, and Previous Year (PY) data.
- Conditional formatting with up and down arrows indicating performance improvement or decline.
- Target vs Actual and PY vs Actual ratios for better insight into progress.
This dynamic layout helps managers, directors, and financial controllers instantly identify where the organization is performing well and where attention is needed.
Click to buy Music & Performing Arts KPI Dashboard in Excel
Trend Sheet Tab
The Trend Sheet adds a visual storytelling component to the dashboard. It helps users identify how performance changes over time for specific KPIs.
On the range C3, users can select any KPI name from a dropdown list. Automatically, the sheet displays:
- KPI Group
- Unit of KPI
- Type (LTB – Lower The Better or UTB – Upper The Better)
- Formula
- Definition
Additionally, this sheet features MTD and YTD trend charts for Actual, Target, and Previous Year data — enabling detailed time-based performance analysis.
This visual representation is ideal for identifying seasonal trends, recurring challenges, or performance spikes.

Click to buy Music & Performing Arts KPI Dashboard in Excel
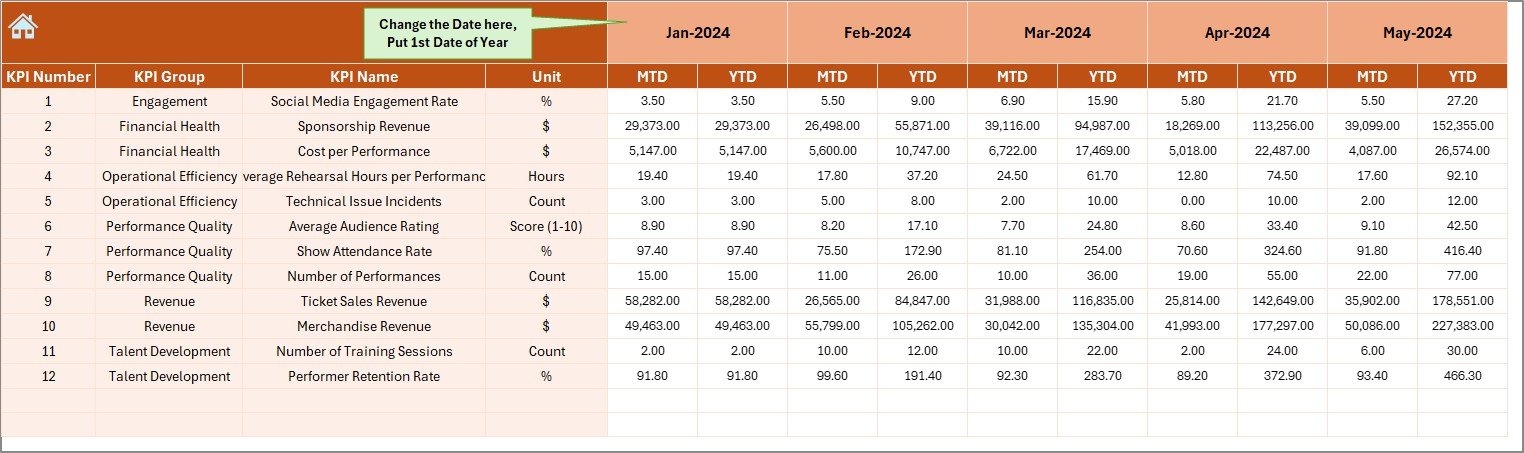
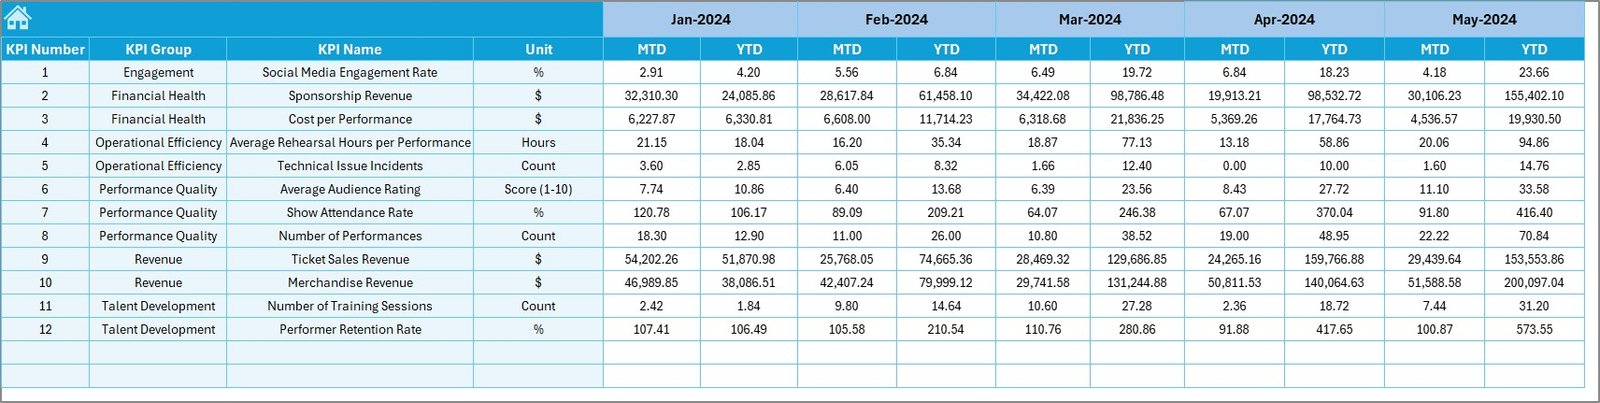
Actual Numbers Input Sheet
In this sheet, you can input actual MTD and YTD data for each KPI.
By changing the month in range E1, users can specify the first month of the year and enter performance numbers accordingly.
This ensures complete data flexibility and automation, reducing manual work while maintaining accuracy.
For example:
If your fiscal year starts in April, you can set E1 = “Apr” and all dashboard calculations will adjust automatically.
Click to buy Music & Performing Arts KPI Dashboard in Excel
Target Sheet Tab
Targets define success. In this sheet, users can enter monthly and yearly target values for each KPI.
Having well-defined targets allows stakeholders to:
- Compare Actual vs Target results
- Measure achievement rates
- Track performance improvement over time
These inputs drive the conditional formatting and arrow-based indicators visible on the main dashboard.
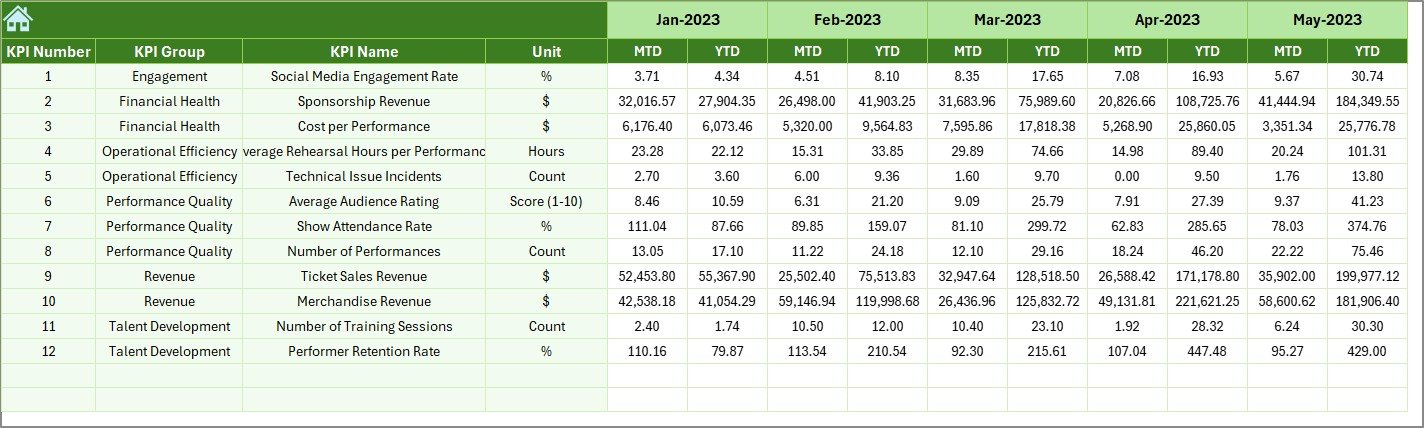
Previous Year Number Sheet Tab
Historical data is key for progress analysis.
This sheet captures previous year’s MTD and YTD data for each KPI, making it easy to compare growth patterns and long-term performance.
This year-over-year comparison helps managers evaluate whether current strategies are producing better results than before.
Click to buy Music & Performing Arts KPI Dashboard in Excel
KPI Definition Sheet Tab
This section contains metadata for every KPI used in the dashboard.
Users can document:
- KPI Name
- KPI Group
- Unit
- Formula
- Definition
This makes the dashboard self-explanatory and user-friendly, ensuring that even new users can understand the logic behind each metric.
Why Use a KPI Dashboard for Music & Performing Arts?
The performing arts sector involves diverse activities — from concerts and dance performances to film scoring, cultural programs, and art exhibitions.
Each of these activities generates data related to finance, performance, engagement, and productivity. Without proper monitoring, organizations may struggle to align goals, measure progress, and improve efficiency.
That’s where a KPI dashboard makes a huge difference.
Key Benefits of the Music & Performing Arts KPI Dashboard
- Centralized Data Management
All your data — from attendance to ticket sales — is in one place. This removes dependency on scattered spreadsheets.
- Real-Time Analysis
Interactive slicers and dropdowns allow real-time updates for instant analysis.
- Performance Comparison
Track how each KPI performs compared to previous years or target goals.
- Visual Insights
Charts, graphs, and conditional formatting make complex data visually appealing and easier to interpret.
- Strategic Decision-Making
Data-backed visuals help management identify success areas and problem zones.
- Customizable Framework
Fully editable structure allows institutions to modify KPIs as per specific operational goals.
- Saves Time & Effort
Automated formulas and interlinked sheets eliminate manual calculations and reduce reporting time.
Advantages of Using the Music & Performing Arts KPI Dashboard
Let’s dive deeper into the key advantages of implementing this dashboard in your organization:
Enhanced Visibility
Every stakeholder gets access to unified and real-time performance insights.
Improved Efficiency
Automated updates and calculations minimize manual entry errors.
Better Strategic Planning
Helps leaders set realistic goals based on previous trends and current performance.
Easy Customization
Add or remove KPIs, change visuals, or modify target benchmarks as needed.
Performance Accountability
By assigning responsibility for each KPI, departments can track accountability more effectively.
Scalability
Ideal for organizations of any size — from small performing groups to large institutions.
Cost-Effective Analytics
No need for expensive BI tools — Excel does it all with automation and clarity.
Best Practices for the Music & Performing Arts KPI Dashboard
To get the most out of your dashboard, follow these best practices:
Keep KPI Definitions Clear
Ensure every user understands the meaning and formula of each KPI.
Use Conditional Formatting Wisely
Green for positive performance, red for negative — simple and effective.
Regularly Update Actual & Target Data
Keep the dashboard relevant by updating monthly.
Maintain Consistent Units
Use the same units (USD, %, Count) across sheets to avoid confusion.
Automate as Much as Possible
Leverage Excel formulas, named ranges, and dropdowns for automation.
Review Historical Trends
Comparing YTD data with the previous year reveals valuable performance insights.
Validate Data Before Analysis
Double-check for missing or duplicate entries before finalizing reports.
Why Excel for Music & Performing Arts Dashboards?
While tools like Power BI or Tableau are great, Excel remains a universal favorite for small to mid-sized organizations due to:
- Simplicity of setup and use
- High flexibility for customization
- Easy data sharing and compatibility
- Low learning curve and maintenance
Excel combines accessibility, power, and automation — the perfect trio for managing creative and performance data efficiently.
Conclusion
The Music & Performing Arts KPI Dashboard in Excel is not just a spreadsheet — it’s a strategic partner for every institution, academy, or production team aiming for continuous improvement.
By combining creativity with data analytics, it empowers decision-makers to measure, analyze, and enhance performance — from financial health to artistic excellence.
Whether you’re managing a small music school or a national theatre company, this dashboard offers the clarity, precision, and control needed to turn data into meaningful insights.
Frequently Asked Questions (FAQs)
What is a Music & Performing Arts KPI Dashboard?
It’s an Excel-based analytical tool designed to track key performance indicators across music and arts-related activities, helping you monitor financial, operational, and audience metrics in one place.
Can I customize the KPIs?
Yes, all KPIs are fully customizable. You can add, edit, or delete them based on your organization’s unique goals.
How often should I update the data?
Ideally, you should update it monthly to keep the dashboard relevant and accurate.
4️ Do I need Excel expertise to use this dashboard?
No. Th I use this for performance comparison across years?
Abslutely! The dashboard allows you to compare current year vs previous year data for each KPI using visual charts and conditional formatting.
Is it suitable for small organizations?
Yes. Whether you manage a single studio or a multi-location academy, this dashboard scales to fit your needs.
Does this dashboard support automation?
Yes. Most calculations and visual updates are automated through Excel formulas and references.
Visit our YouTube channel to learn step-by-step video tutorials
Watch the step-by-step video tutorial:
Click to buy Music & Performing Arts KPI Dashboard in Excel