The animation and VFX industry grows fast, and production teams need strong monitoring tools to track quality, deadlines, resources, and performance. When studios handle multiple projects at once, they collect huge amounts of data every day—render hours, revision cycles, artist productivity, asset completion, and client review status.
Because this data sits across many files, teams struggle to see what works and what needs improvement.
That is why an Animation & VFX KPI Dashboard in Excel becomes one of the most powerful tools for production managers, creative leads, and studio owners. It organizes your KPIs in a clean, intelligent, and fully automated format. You can track all essential metrics month-wise and year-wise with a single click.
This article explains everything about this dashboard. You will learn how it works, its worksheets, how to use it, why it matters, key advantages, best practices, and answers to common questions.
Click to buy Animation & VFX KPI Dashboard in Excel
What Is an Animation & VFX KPI Dashboard in Excel?
An Animation & VFX KPI Dashboard in Excel tracks the performance of animation and visual effects activities using clear and measurable KPIs. It brings all your project performance numbers into one smart Excel file. You can monitor timelines, quality checks, artist efficiency, rendering progress, pipeline performance, and output consistency.
This dashboard uses slicers, trend charts, KPIs, conditional formatting, and structured worksheets to give you full control over your data. You can select any month or KPI, and the dashboard updates instantly.
Studios use this tool to:
- Compare target vs actual performance
- Improve production timelines
- Track monthly and yearly outputs
- Manage resource allocation
- Identify errors quickly
- Make better creative and operational decisions
Because Excel is flexible and user-friendly, every team member can use it without learning new software.
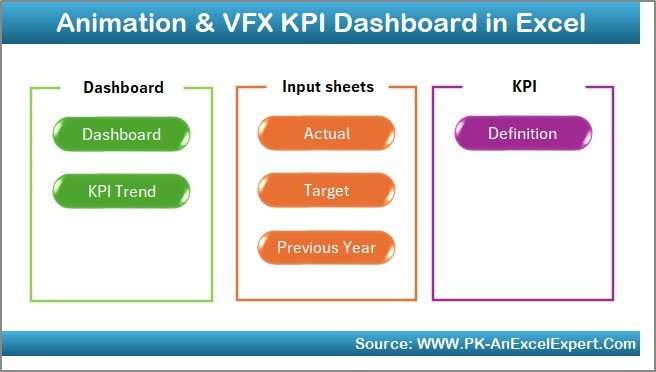
Key Features of the Animation & VFX KPI Dashboard in Excel
Below are the features included in this ready-to-use KPI Dashboard.
Summary Page – One-Click Navigation
Click to buy Animation & VFX KPI Dashboard in Excel
The Summary Page works like an index page.
This page includes 6 navigation buttons that help you jump instantly to each sheet.
It saves time and keeps the file organized, especially when production teams work on multiple KPIs.
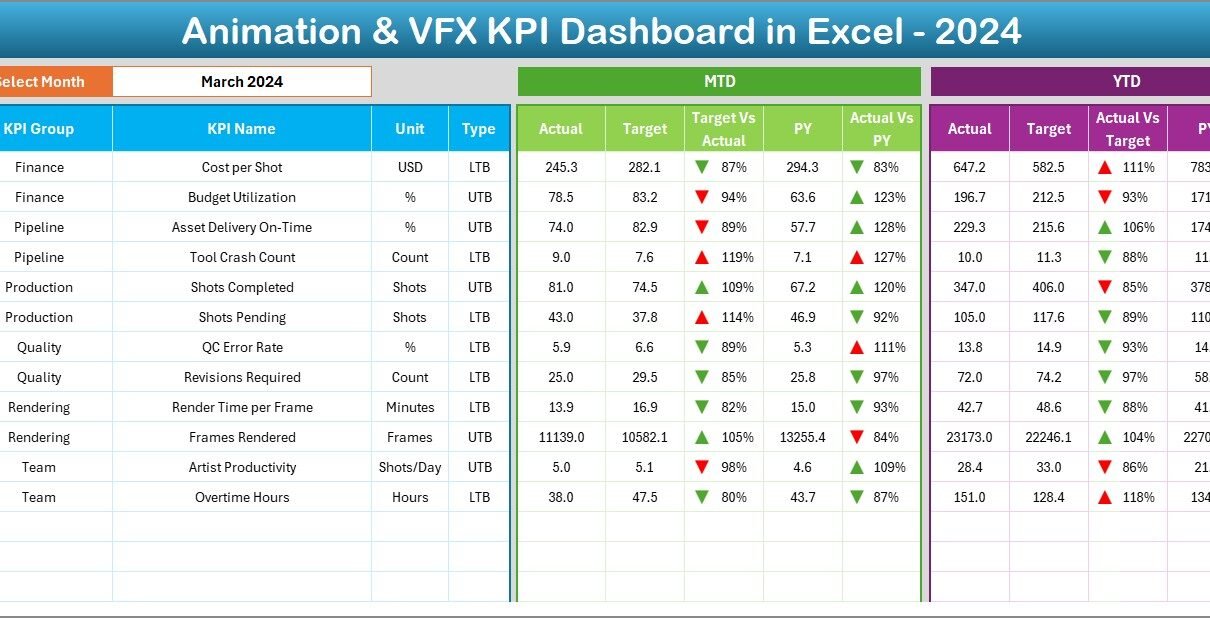
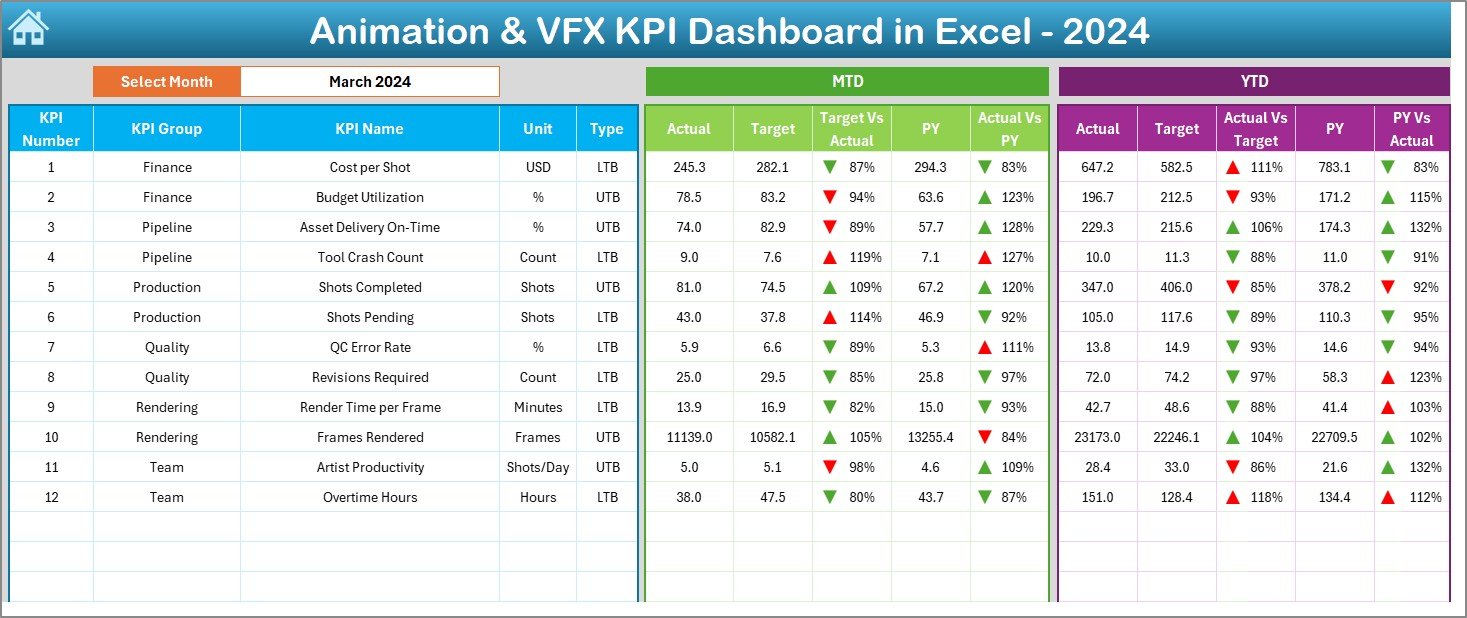
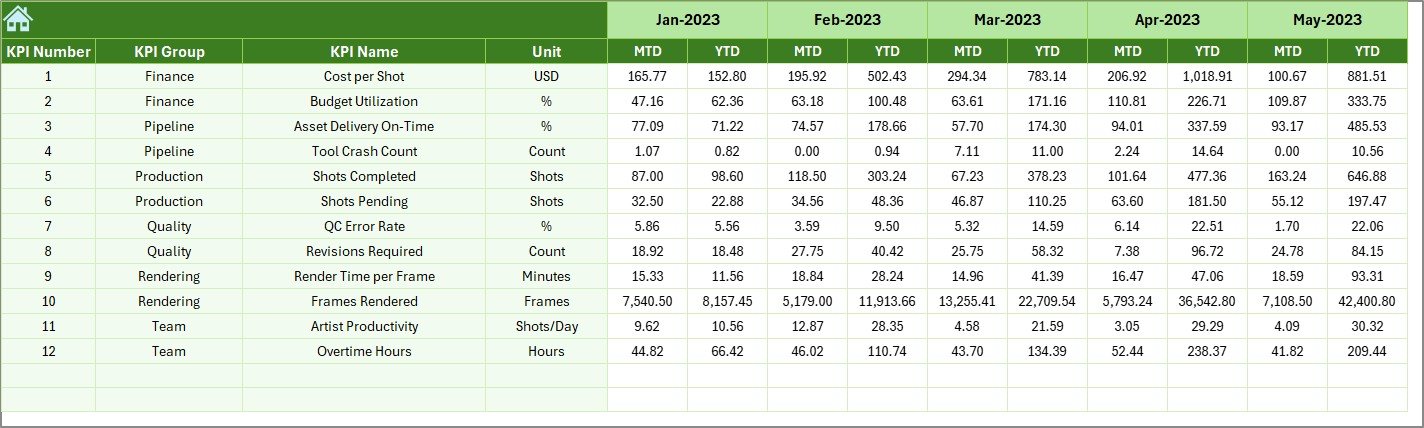
Dashboard Sheet – Complete Monthly and Yearly KPI Overview
The Dashboard Sheet is the main sheet that displays all the important KPIs.
You can select the month from the drop-down in cell D3, and the dashboard updates the whole report instantly.
This page displays:
- MTD Actual, Target, Previous Year
- Target vs Actual (MTD)
- PY vs Actual (MTD)
- YTD Actual, Target, Previous Year
- Target vs Actual (YTD)
- PY vs Actual (YTD)
Conditional formatting uses up/down arrows, which makes it easy to understand performance movements in seconds.
Click to buy Animation & VFX KPI Dashboard in Excel
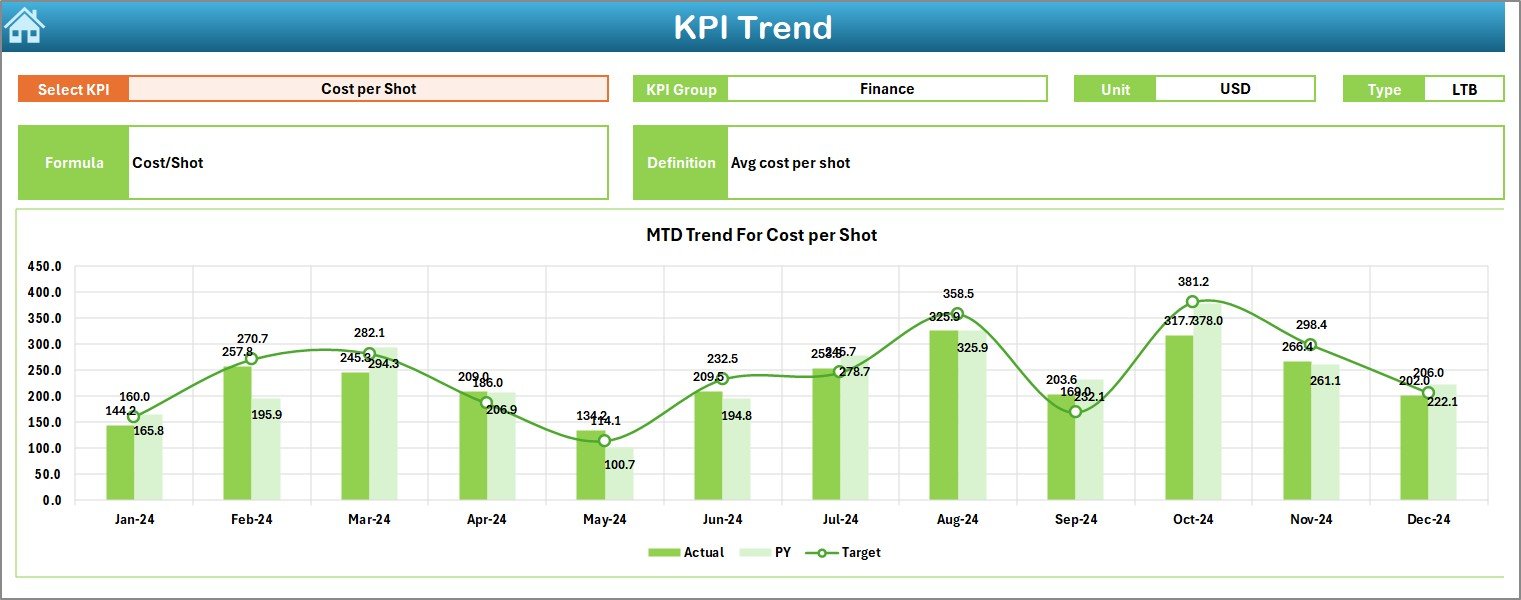
Trend Sheet – Detailed KPI Insights
The Trend Sheet helps you analyze performance patterns over time.
You can choose the KPI name from the drop-down in cell C3.
Once you select a KPI, the sheet displays:
- KPI Group
- Unit
- KPI Type (LTB or UTB)
- Formula
- KPI Definition
- MTD Trend Chart (Actual, Target, PY)
- YTD Trend Chart (Actual, Target, PY)
This sheet is useful for identifying improvement patterns and seasonal variations.
Click to buy Animation & VFX KPI Dashboard in Excel
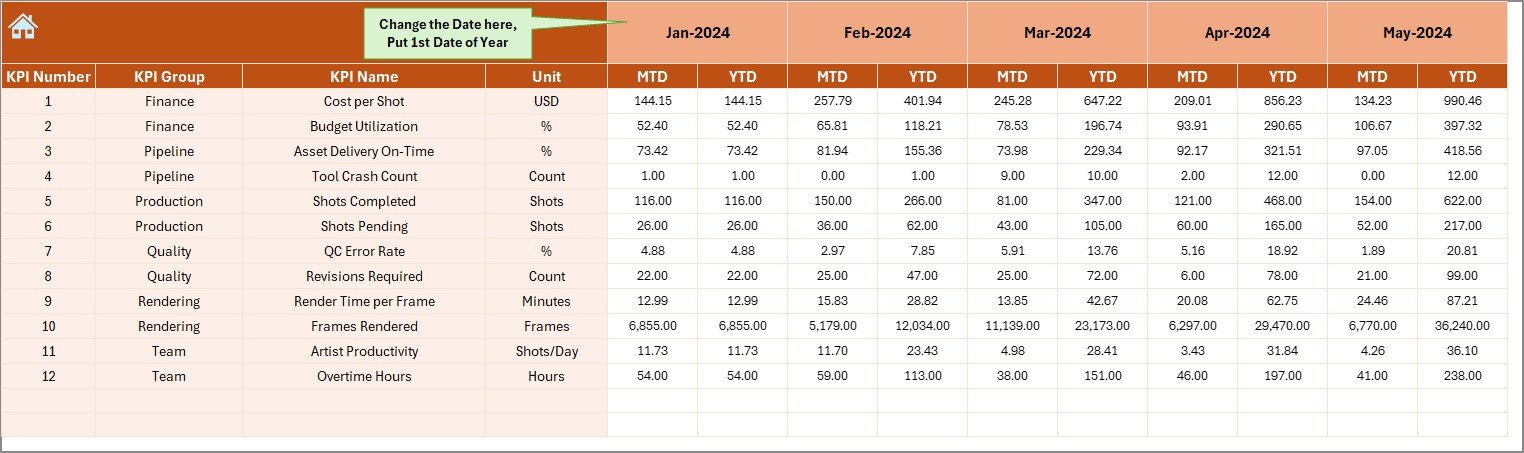
Actual Numbers Input Sheet – Enter Real Production Data
This sheet lets you enter the actual numbers for each month.
- Enter MTD and YTD actuals.
- Select the first month of the year from cell E1.
- Once you update numbers, the dashboard updates automatically.
This keeps your performance reports reliable and real-time.
Click to buy Animation & VFX KPI Dashboard in Excel
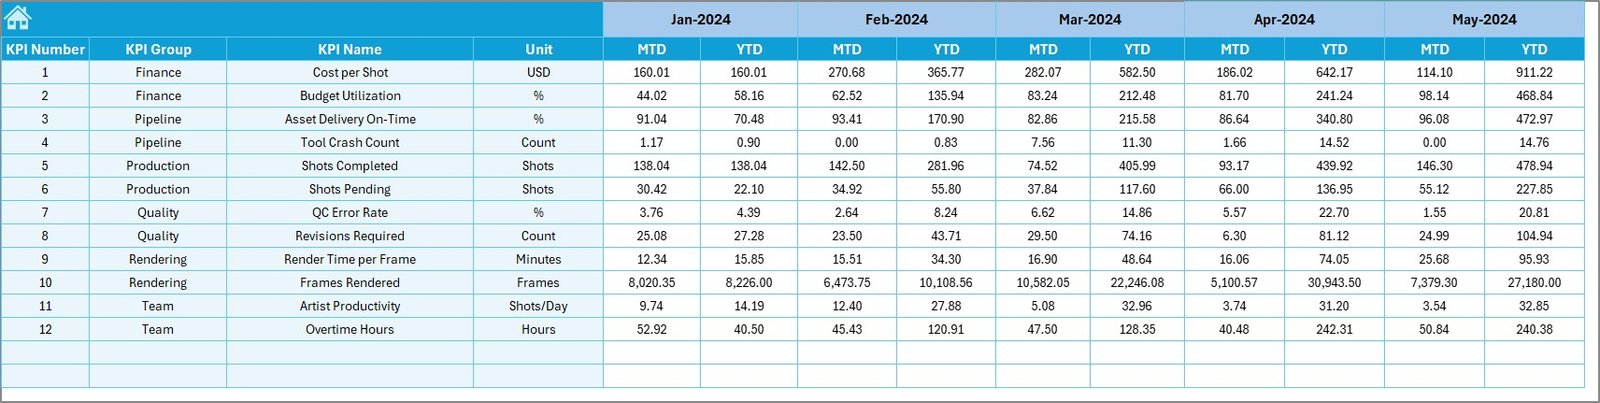
Target Sheet – Set Monthly and Yearly Targets
This sheet allows you to enter MTD and YTD targets for every KPI.
You can set production goals for:
- Rendering time
- Asset completion
- Artist output
- Review cycles
- Effect shots delivered
- Revision rates
Teams can use this to stay aligned with monthly production goals.
Click to buy Animation & VFX KPI Dashboard in Excel
Previous Year Numbers Sheet – Compare Last Year’s Performance
This sheet allows you to enter previous year’s MTD and YTD numbers.
Using this, the dashboard shows:
- Year-over-Year (YoY) comparison
- Growth trends
- Improvement and decline patterns
Studios use this insight to set realistic goals for current projects.
Click to buy Animation & VFX KPI Dashboard in Excel
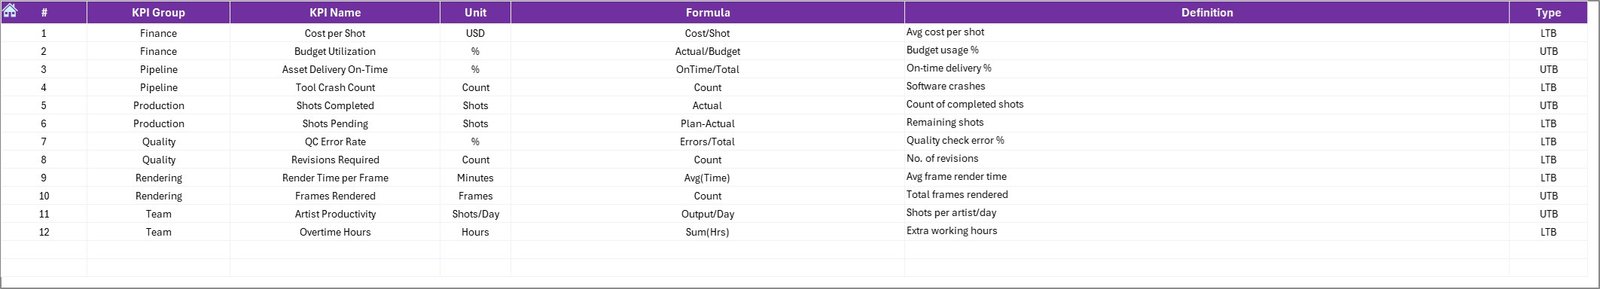
KPI Definition Sheet – Document All KPIs Clearly
This sheet includes:
- KPI Name
- KPI Group
- Unit
- Formula
- Definition
- Type (UTB or LTB)
This page ensures that everyone in the studio understands KPIs the same way.
Why Do Animation & VFX Studios Need KPI Tracking?
The animation and VFX process includes many steps:
- Storyboarding
- Modeling
- Texturing
- Rigging
- Animation
- Simulation
- Rendering
- Compositing
- Client review
- Final delivery
Each stage includes timelines, quality checks, and performance metrics.
Without a dashboard, it becomes tough to manage deadlines and deliver high-quality results.
A KPI dashboard solves this problem by giving clear numbers that show how your studio performs every month.
Important KPIs to Track in Animation & VFX Production
Below are some essential KPIs that most studios track using this dashboard:
- Asset Completion Rate
- Scene Completion Rate
- Rendering Hours
- Average Revision Cycles
- QC Accuracy
- Artist Productivity
- Shot Delivery Performance
- Pipeline Errors
- Review Turnaround Time
- Output Efficiency
- Resource Utilization
- Cost Variance
Tracking these KPIs helps you improve delivery timelines and creative output.
How to Use the Animation & VFX KPI Dashboard in Excel
Using this dashboard is simple. Follow these steps:
Step 1: Update the Actual Numbers
Go to the Actual Numbers Input Sheet and enter:
- MTD Actual
- YTD Actual
Choose the first month in cell E1.
Step 2: Enter Monthly Targets
Use the Target Sheet to input monthly and yearly targets.
Step 3: Enter Previous Year Values
Go to the Previous Year Numbers Sheet and add last year’s stats.
Step 4: View the Dashboard
Go to the Dashboard Sheet and select the month from cell D3.
Step 5: Analyze Trends
Go to the Trend Sheet and choose any KPI to view detailed insights.
This process keeps your KPI monitoring organized and efficient.
Advantages of Animation & VFX KPI Dashboard in Excel
- Studios receive several benefits when they use this dashboard.
Here are the major advantages:
- Faster Decision-Making
The dashboard displays results instantly.
Teams get the right insights at the right time.
- Better Production Control
- Managers can track:
- Delays
- Errors
- Output variance
- Revision cycles
This helps them maintain better workflow.
- Smooth Client Deliveries
When KPIs stay on track, studios meet deadlines with confidence.
- Clear Resource Utilization
You can see which artist or department performs better and where improvement is required.
- Historical Performance Comparison
Year-over-Year and Month-to-Month comparisons make planning easy.
- Reduced Errors
Since the dashboard uses structured formulas, data errors reduce drastically.
- Fully Customizable
You can add, remove, or modify KPIs anytime without changing the structure.
Best Practices for Using an Animation & VFX KPI Dashboard in Excel
Follow these best practices to get the most out of your dashboard:
- Update Data Regularly
Keep actual, target, and previous year numbers updated every month.
- Use Clear KPI Definitions
Avoid confusion by documenting each KPI in the KPI Definition Sheet.
- Review Trend Charts Weekly
Identify early signs of delays or quality issues through trend patterns.
- Set Realistic Targets
Set achievable targets based on past performance.
- Keep the File Lightweight
Do not add unnecessary formulas or charts that slow down the Excel file.
- Review MTD and YTD Together
MTD gives fresh updates, while YTD shows long-term performance.
- Share the Dashboard with Your Team
Involve leads, supervisors, and artists for better alignment.
How Does This Dashboard Improve Studio Operations?
This dashboard improves:
- Collaboration
- Clarity
- Speed
- Quality control
- Production accuracy
- Capacity planning
- Timeline tracking
When you use it every month, you build a culture of transparency and continuous improvement.
Conclusion
The Animation & VFX KPI Dashboard in Excel helps studios stay organized, improve timelines, and manage performance through clear and measurable KPIs. It simplifies your data, increases productivity, and gives you full control over your animation and VFX workflow.
If your studio wants a simple and powerful tool to track production performance, this dashboard is the best starting point. It keeps your team aligned, your KPIs updated, and your output consistent across all stages of animation and VFX creation.
Frequently Asked Questions (FAQ)
- What is an Animation & VFX KPI Dashboard?
It is an Excel-based dashboard that tracks the performance of animation and VFX production activities using measurable KPIs.
- Who can use this dashboard?
Studios, production houses, creative teams, freelancers, and VFX supervisors can use it.
- Do I need advanced Excel skills to use it?
No. You only need to enter numbers, select from drop-downs, and view the dashboard.
- Can I add more KPIs to the dashboard?
Yes. You can easily modify KPI definitions and add new ones.
- Does the dashboard support YTD and MTD tracking?
Yes. You can track both Month-to-Date and Year-to-Date performance.
- Can I compare my performance with last year?
Yes. The dashboard shows comparisons with previous year values.
- Is this dashboard suitable for all animation styles?
Yes. It works for 2D, 3D, CGI, VFX, motion graphics, and more.
- Can I use this dashboard for multiple projects?
Yes. Just enter numbers based on the project or team.
- Does the dashboard include trend analysis?
Yes. You can view MTD and YTD trend charts for every KPI.
- Can I customize the design?
You can modify colors, charts, formulas, and layouts based on your studio needs.
Visit our YouTube channel to learn step-by-step video tutorials
Watch the step-by-step video tutorial:
Click to buy Animation & VFX KPI Dashboard in Excel