A Balance Sheet Template in Excel helps businesses track their financial position in a structured and organized way. Instead of manually calculating financial statements every month, this template automatically summarizes assets, liabilities, and shareholders’ equity. As a result, business owners, accountants, and financial analysts can easily monitor the company’s financial health.
Moreover, Excel-based financial templates simplify financial reporting because they allow users to input monthly values and instantly generate totals. Therefore, companies can analyze trends, evaluate liquidity, and make better financial decisions.
What Is a Balance Sheet Template in Excel?
Click to Buy Balance Sheet Template in Excel
A Balance Sheet Template in Excel is a financial reporting spreadsheet built inside Microsoft Excel. It records and summarizes the company’s financial position at a specific time.
The balance sheet follows a fundamental accounting equation:
Assets = Liabilities + Shareholders’ Equity
Therefore, this template organizes financial data into three main sections:
1. Assets
Assets represent everything a company owns.
Examples include:
- Cash & Cash Equivalents
- Short-Term Investments
- Accounts Receivable
- Inventory
- Property, Plant & Equipment
- Intangible Assets
2. Liabilities
Liabilities represent financial obligations.
Examples include:
- Accounts Payable
- Short-Term Debt
- Accrued Liabilities
- Deferred Revenue
- Long-Term Debt
3. Shareholders’ Equity
Equity represents the owner’s investment in the company.
Examples include:
- Common Stock
- Retained Earnings
- Additional Paid-in Capital
Because the template calculates totals automatically, users quickly verify whether the balance sheet remains balanced.
Why Do Businesses Need a Balance Sheet Template?
Click to Buy Balance Sheet Template in Excel
Many businesses struggle with financial reporting when they rely on scattered spreadsheets. However, a structured Excel template solves this problem.
Here is why companies use it:
- It organizes financial data clearly
- It calculates totals automatically
- It reduces manual calculation errors
- It improves financial transparency
- It helps track monthly financial trends
Therefore, managers can make data-driven financial decisions with confidence.
Key Features of the Balance Sheet Template in Excel
The template shown above includes two main worksheets.
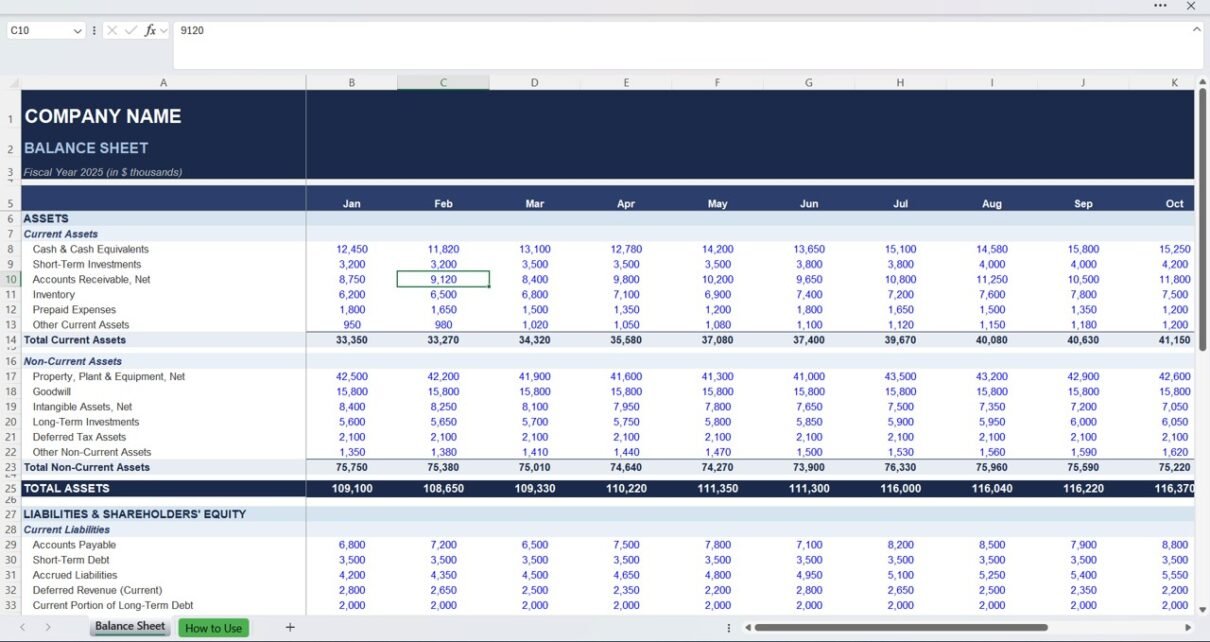
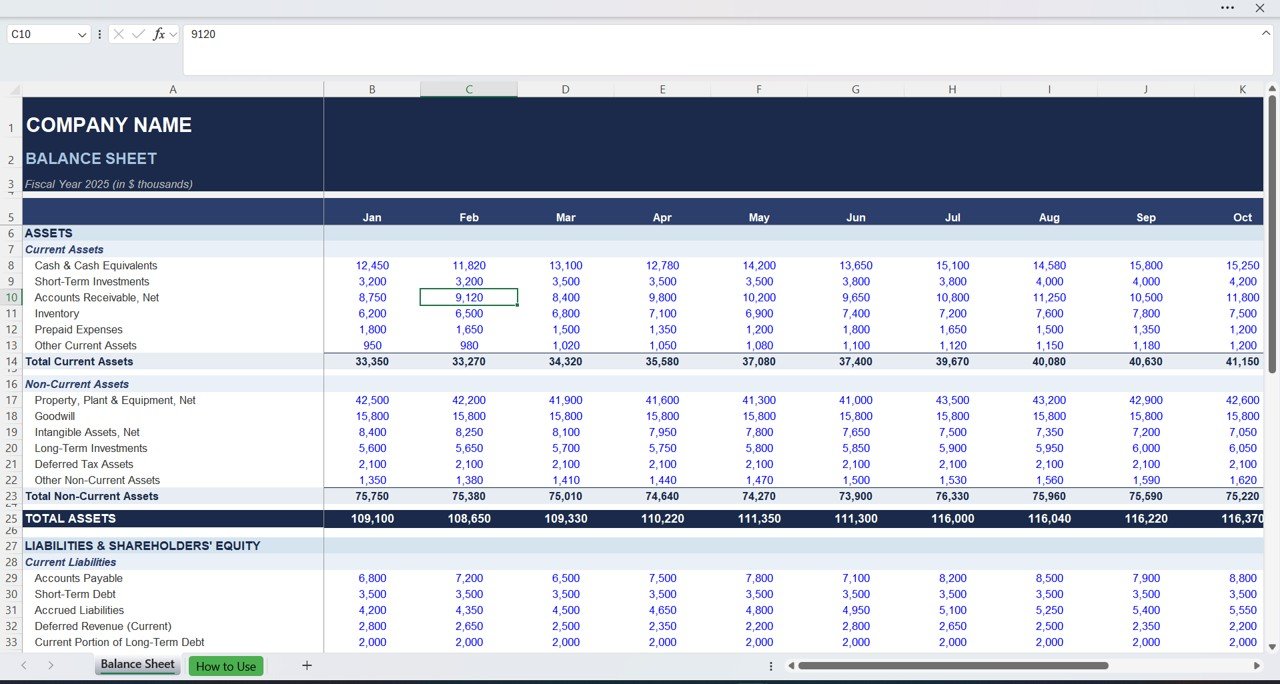
Balance Sheet Worksheet
This sheet contains the primary financial statement.
Header Section
At the top, users enter:
- Company Name
- Fiscal Year
- Reporting Format
After that, the template displays financial data across monthly columns from January to December.
Assets Section
Assets appear at the top of the balance sheet.
Current Assets
Current assets represent short-term resources.
Examples include:
- Cash & Cash Equivalents
- Short-Term Investments
- Accounts Receivable
- Inventory
- Prepaid Expenses
- Other Current Assets
The template automatically calculates:
Total Current Assets
Non-Current Assets
These represent long-term business investments.
Examples include:
- Property, Plant & Equipment
- Goodwill
- Intangible Assets
- Long-Term Investments
- Deferred Tax Assets
The template calculates:
Total Non-Current Assets
Finally, it summarizes:
Total Assets
Liabilities Section
Below the assets section, the template displays liabilities.
Current Liabilities
These represent obligations due within one year.
Examples include:
- Accounts Payable
- Short-Term Debt
- Accrued Liabilities
- Deferred Revenue
- Current Portion of Long-Term Debt
The template calculates:
Total Current Liabilities
Long-Term Liabilities
These represent long-term financial obligations.
Examples include:
- Long-Term Loans
- Bonds Payable
- Lease Obligations
The template calculates:
Total Liabilities
Shareholders’ Equity Section
This section reflects the owner’s share of company assets.
Common entries include:
- Share Capital
- Retained Earnings
- Treasury Stock
Finally, the template calculates:
Total Shareholders’ Equity
Balance Check
The template includes a built-in Balance Check formula.
This formula verifies:
Total Assets = Total Liabilities + Equity
If the statement balances, the template confirms the result automatically.
Click to Buy Balance Sheet Template in Excel
What Financial Insights Does This Template Provide?
A balance sheet helps answer important financial questions.
For example:
- Does the company have enough cash?
- How much debt does the company carry?
- What is the company’s net worth?
- Are assets growing over time?
Because the template tracks monthly financial balances, users analyze financial trends easily.
Advantages of Balance Sheet Template in Excel
Click to Buy Balance Sheet Template in Excel
Using an Excel balance sheet template offers several benefits.
1. Simple Financial Reporting
Excel provides an easy way to organize financial statements.
2. Automatic Calculations
Formulas automatically calculate totals and balances.
3. Error Reduction
Automated checks reduce accounting mistakes.
4. Monthly Financial Tracking
Businesses monitor financial performance throughout the year.
5. Easy Customization
Companies can add or remove account categories easily.
6. Cost-Effective Solution
Excel templates eliminate expensive accounting software.
Best Practices for Balance Sheet Management
To maintain accurate financial statements, follow these best practices.
1. Update Financial Data Regularly
Enter financial data monthly to maintain accurate reporting.
2. Maintain Consistent Account Categories
Avoid changing account structures frequently. Consistency improves analysis.
3. Verify Data Before Final Reporting
Always cross-check accounting entries with supporting documents.
4. Monitor Liquidity Ratios
Use the balance sheet to evaluate:
- Current Ratio
- Debt-to-Equity Ratio
- Asset Turnover
These metrics provide deeper financial insights.
5. Protect Formula Cells
Lock calculated cells to prevent accidental formula deletion.
How Does a Balance Sheet Improve Financial Decision-Making?
Click to Buy Balance Sheet Template in Excel
A balance sheet supports strategic decisions.
For example, managers can:
- Evaluate whether assets exceed liabilities
- Determine borrowing capacity
- Analyze investment opportunities
- Monitor financial stability
Therefore, businesses use balance sheets to guide financial planning.
Conclusion
A Balance Sheet Template in Excel provides a simple yet powerful way to manage financial reporting. Instead of relying on complex accounting software, businesses can organize assets, liabilities, and equity in one structured spreadsheet.
Moreover, automated formulas ensure accuracy, while monthly tracking reveals financial trends. As a result, companies gain better financial visibility and make smarter decisions.
If you want an efficient financial reporting system, this Excel balance sheet template offers a practical solution.
Frequently Asked Questions (FAQs)
Click to Buy Balance Sheet Template in Excel
1. What is the purpose of a balance sheet?
A balance sheet shows a company’s financial position by listing assets, liabilities, and equity.
2. Can small businesses use this Excel template?
Yes. Small businesses commonly use Excel balance sheet templates because they are simple and cost-effective.
3. Does the template calculate totals automatically?
Yes. Built-in formulas calculate totals for assets, liabilities, and equity.
4. Can I customize the template?
Yes. Users can add additional accounts or financial categories.
5. Why is the balance sheet important?
It helps evaluate financial stability, debt levels, and overall company value.
Visit our YouTube channel to learn step-by-step video tutorials
Watch the step-by-step video tutorial:
Click to Buy Balance Sheet Template in Excel