Every business dreams of growth, but managing that growth efficiently requires accurate insights, timely data, and actionable performance metrics. This is where the Business Growth Dashboard in Excel becomes a game-changer.
In this detailed article, we’ll explore everything you need to know about this dashboard—its structure, components, benefits, and best practices to make the most out of it.Business Growth Dashboard in Excel.
Click to buy Business Growth Dashboard in Excel
What Is a Business Growth Dashboard in Excel?
A Business Growth Dashboard in Excel is an analytical tool designed to monitor and visualize your company’s performance across different business dimensions. It combines financial, operational, and marketing data to provide a 360° view of your growth trajectory.
Unlike static reports, this Excel-based dashboard brings your data to life through interactive visuals, KPIs (Key Performance Indicators), slicers, and trend charts. It helps business leaders quickly identify what’s driving revenue, where costs are rising, and how marketing strategies are performing.
With this ready-to-use template, you no longer need multiple reports or systems—everything you need for growth tracking fits neatly inside a single, dynamic Excel file.
Why Should You Use a Business Growth Dashboard in Excel?
Growth management is not about collecting data—it’s about understanding trends and taking timely actions. The dashboard simplifies complex data by summarizing it into visual KPIs and charts. Here’s why businesses across industries use it:
- Track Performance in Real Time: Get an instant overview of revenue, cost, and profit trends.
- Identify Growth Drivers: Discover which regions, categories, or sales channels are contributing the most.
- Make Data-Driven Decisions: Replace assumptions with facts and measurable performance insights.
- Save Time: Automated charts and calculations eliminate manual reporting efforts.Business Growth Dashboard in Excel
- Spot Bottlenecks Quickly: Identify underperforming areas before they impact growth.Business Growth Dashboard in Excel
Key Features of the Business Growth Dashboard in Excel
This ready-to-use Excel dashboard consists of multiple sheet tabs, each serving a unique analytical purpose. Let’s break down the structure:
Overview Sheet Tab
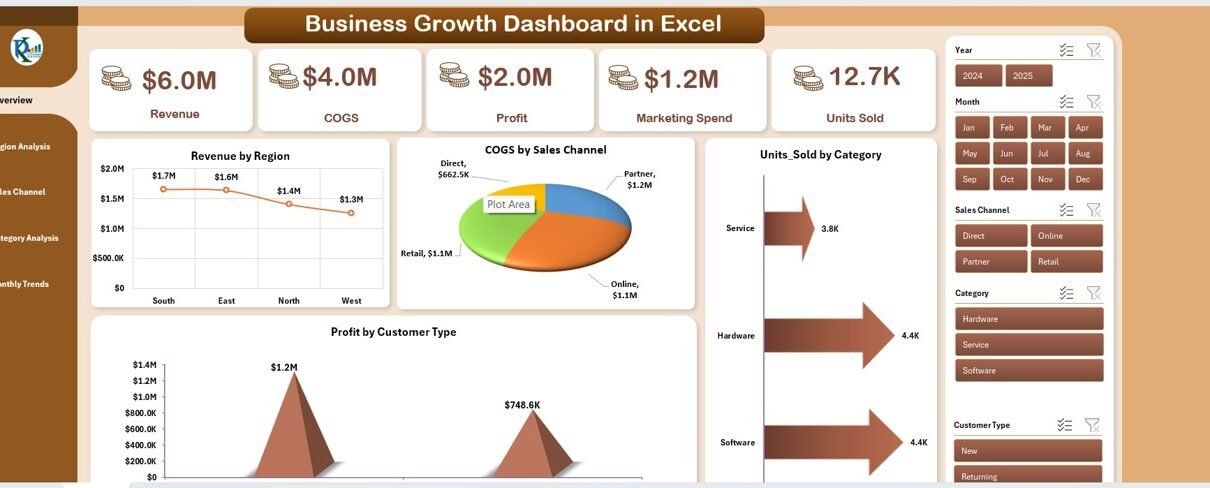
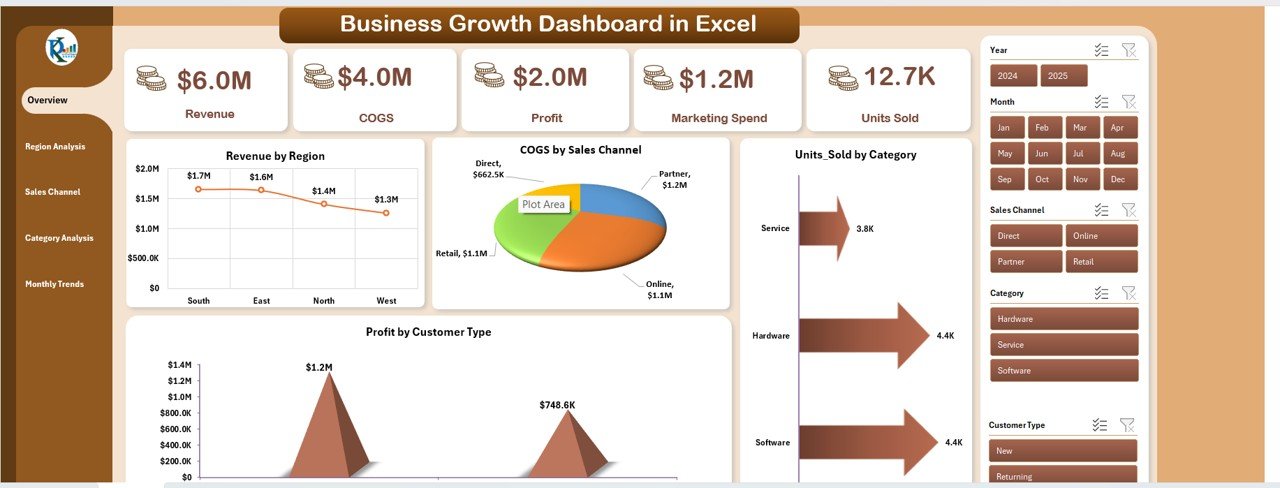
The Overview sheet is the command center of the dashboard. It displays the most critical growth KPIs and charts in a clean and interactive layout.
Cards (Top KPIs)
- Revenue – Total income generated from all products or services.
- COGS (Cost of Goods Sold) – The direct cost of producing goods or services.
- Profit – Net gain after subtracting COGS and expenses.Business Growth Dashboard in Excel
- Marketing Spend – Total promotional and advertising expenditure.
- Units Sold – Number of items sold across categories.
These top KPI cards give an instant snapshot of business performance, helping users monitor trends at a glance.
Charts on the Overview Page
- Revenue by Region – Shows which regions are generating the most revenue.
- COGS by Sales Channel – Highlights where your cost structures differ across channels.
- Profit by Customer Type – Compares profitability across customer segments.
- Units Sold by Category – Displays how different product categories contribute to total sales.
Together, these visuals provide a quick understanding of overall growth health.
Click to buy Business Growth Dashboard in Excel
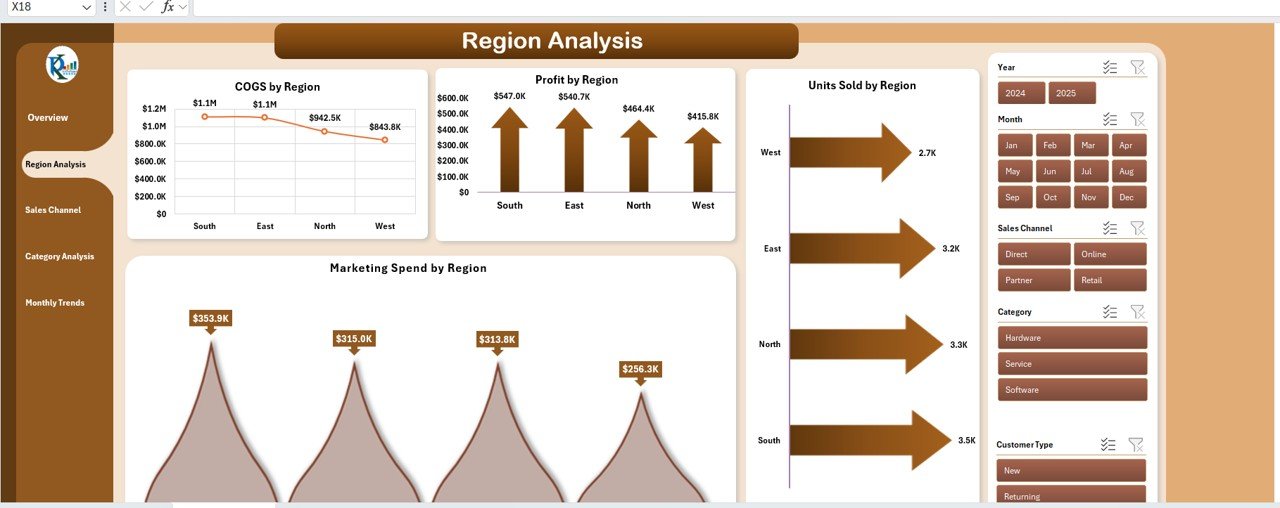
Region Analysis Sheet
The Region Analysis sheet helps managers evaluate performance across geographic locations. Businesses often grow unevenly across regions, and this sheet helps pinpoint where to focus efforts.
Charts and Metrics
- Revenue by Region – Helps identify top-performing and lagging regions.
- Marketing Spend by Region – Compares promotional investment across territories.
- Units Sold by Region – Tracks market penetration by area.
- Estimated Cost Impact (USD) by Department – Reveals which departments influence regional profitability the most.
With this, leaders can allocate resources more strategically, balancing high-cost and high-return areas effectively.
Click to buy Business Growth Dashboard in Excel
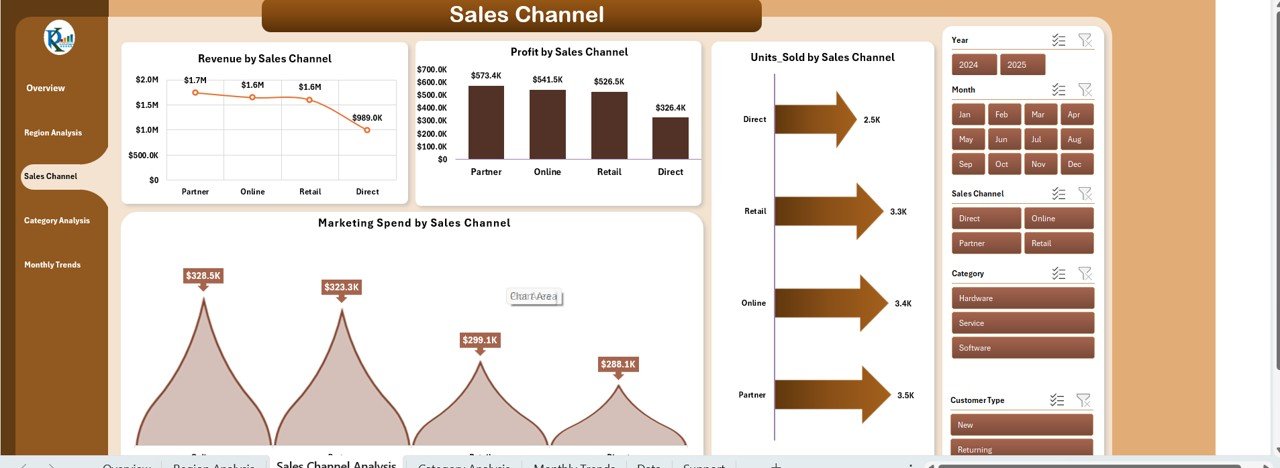
Sales Channel Analysis Sheet
Sales channels—such as online, retail, distributors, or direct sales—play a crucial role in business growth. The Sales Channel Analysis tab compares their performance side by side.
Charts and Insights
- Revenue by Sales Channel – Understand which sales mode contributes most to revenue.
- Marketing Spend by Sales Channel – Evaluate ROI of marketing spend for each channel.
- Units Sold by Sales Channel – Track volume distribution across platforms.
- Recommendations by Audit Type – Identify improvement opportunities through audit insights.
This analysis ensures that marketing and sales strategies are channel-optimized, improving profitability and conversion rates.
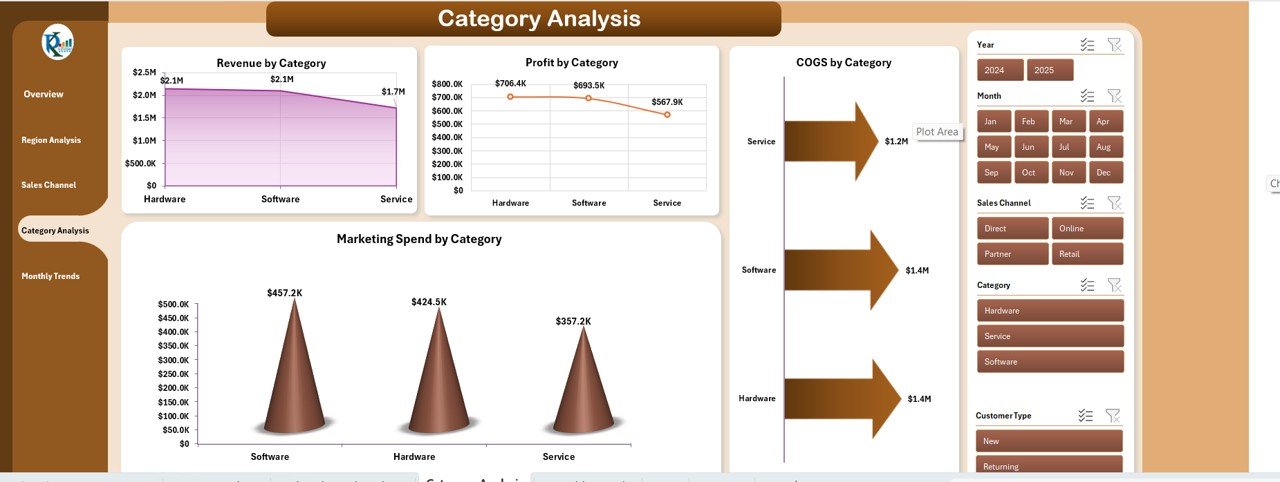
Category Analysis Sheet
Product categories can make or break your revenue performance. This sheet dives deep into category-wise performance metrics.
Charts and Insights
- Revenue by Category – See which categories are driving growth.
- Marketing Spend by Category – Compare ad spend with category performance.
- COGS by Category – Identify cost-heavy categories and improve pricing strategy.
With this analysis, decision-makers can reallocate budgets toward profitable segments and adjust pricing for better margins.
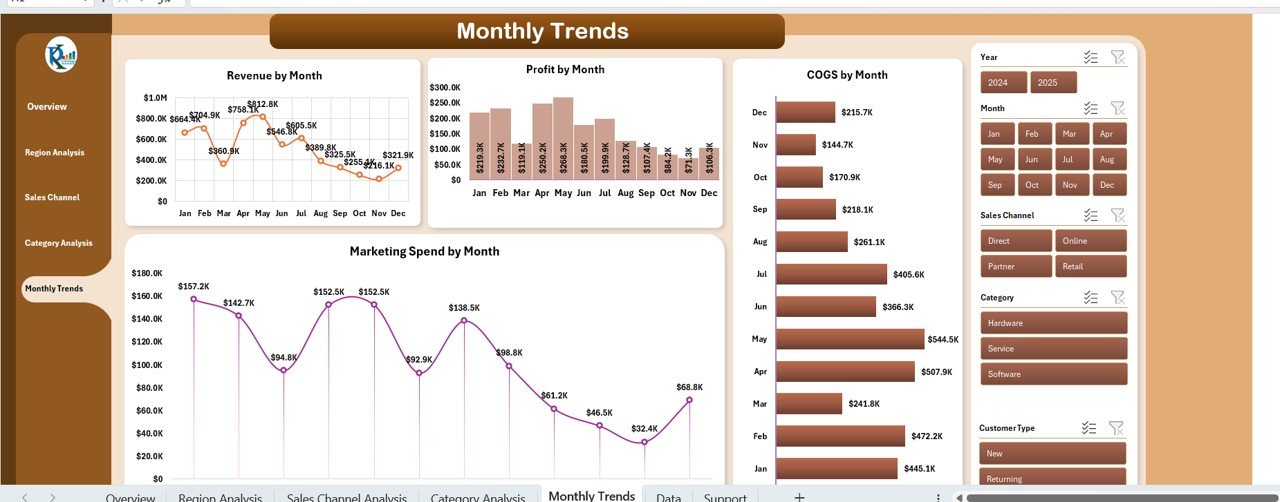
Monthly Trends Sheet
The Monthly Trends page focuses on time-based analysis, allowing users to track progress month over month.
Charts and Metrics
- Revenue by Month – Displays seasonal or monthly revenue changes.
- Profit by Month – Highlights profitability trends and cost control efficiency.
- Marketing Spend by Month – Shows marketing expenditure patterns.
This time-series view helps anticipate future trends and prepare more accurate forecasts.
Data Sheet Tab
This is the foundation of the dashboard — the data input sheet. All analysis and visualizations draw from this tab.
Users enter or import their raw business data here, including:
- Sales transactions
- Cost figures
- Marketing budgets
- Product categories
- Customer details
The dashboard automatically updates visuals based on this input, making data management seamless and transparent.
How Does the Business Growth Dashboard in Excel Work?
The dashboard uses Excel formulas, pivot tables, and dynamic charts to automate reporting. You simply:
- Input your data into the “Data Sheet.”
- Refresh pivot tables or slicers.
- Instantly see updated visuals across all analytical pages.
It works with any dataset size and can be easily customized to include additional KPIs or visual elements, depending on your business requirements.
Key Performance Indicators (KPIs) to Track in Business Growth
Every organization defines growth differently. However, there are universal KPIs that this dashboard can track effectively:
- Revenue Growth (%) – Measures how revenue is increasing month-over-month or year-over-year.
- Gross Profit Margin (%) – Indicates how efficiently you’re producing goods.
- Operating Profit Margin (%) – Shows profitability after accounting for all operating expenses.
- Customer Acquisition Cost (CAC) – Evaluates the efficiency of marketing and sales spend.
- Customer Lifetime Value (CLV) – Determines long-term customer profitability.
- Sales Conversion Rate (%) – Tracks how many leads convert to actual sales.
- Marketing ROI (%) – Measures the effectiveness of marketing investments.
- Inventory Turnover Ratio – Reveals how efficiently inventory is sold and replaced.
- Cost Efficiency (%) – Indicates cost savings and productivity gains.
These KPIs ensure every aspect of business performance—sales, cost, and marketing—is tracked precisely.
Advantages of Using a Business Growth Dashboard in Excel
A Business Growth Dashboard offers multiple advantages that go beyond just visualization. Here are the top benefits:
- Unified View of All Business Metrics
Instead of managing multiple reports or spreadsheets, you get one consolidated dashboard with all your growth metrics.
- Informed Decision-Making
Visual analytics make it easier to interpret trends and take quick, informed actions.
- Time Efficiency
Automated formulas and pivot charts minimize manual calculations, saving countless hours.
- Improved Accuracy
Since all data points connect dynamically, the risk of errors drops significantly.
- Scalability
The dashboard can handle small business data or large enterprise datasets equally well.
- Cost-Effective
You don’t need expensive BI software—Excel provides powerful analytics at zero additional cost.
- Customizable
Easily modify KPIs, add charts, or integrate macros to personalize the dashboard for your organization.
Opportunities for Improvement
Even though Excel dashboards are powerful, you can enhance them with a few additional improvements:
- Incorporate Power Query for automated data refresh.
- Add VBA macros for quick navigation or automated report generation.
- Integrate with Power BI for advanced visual storytelling.
- Include Goal Seek or What-If Analysis for predictive insights.
- Connect live data sources (like databases or Google Sheets) for real-time reporting.
These enhancements can turn a standard Excel dashboard into a mini business intelligence system.
Best Practices for Using a Business Growth Dashboard in Excel
To ensure you’re getting the maximum value out of your dashboard, follow these proven best practices:
Keep Data Clean and Structured
Ensure your data sheet follows consistent formatting (dates, currency, categories). Clean data ensures accurate results.
Update Data Regularly
Enter or import data on a weekly or monthly basis to keep your insights relevant.
Use Consistent Metrics
Define KPIs clearly and stick to standard calculation methods for consistency.
Protect Formulas and Layouts
Lock formula cells and protect the dashboard from accidental edits.
Use Conditional Formatting
Highlight key trends with color-coded visuals—green for growth, red for decline.
Automate Where Possible
Use Excel’s automation tools like Power Query or VBA to refresh reports instantly.
Visualize Smartly
Avoid cluttered visuals. Use charts that tell a story—bar charts for comparisons, line charts for trends, and pie charts for distribution.
Track Both MTD and YTD
Always include Month-to-Date (MTD) and Year-to-Date (YTD) comparisons for balanced performance review.
Conclusion
The Business Growth Dashboard in Excel transforms ordinary data into meaningful business intelligence. It not only saves time but also empowers decision-makers with clear insights into revenue, cost, profit, and marketing efficiency.
Whether you’re a small startup or a large corporation, this dashboard can become your most valuable tool for monitoring progress, forecasting trends, and steering your business toward sustainable growth.
With smart design, clean data, and regular updates, your Excel dashboard can evolve into a complete decision-support system—driving performance and growth every day.
Frequently Asked Questions (FAQs)
- What is the main purpose of a Business Growth Dashboard in Excel?
Its main purpose is to track, analyze, and visualize growth metrics like revenue, profit, and marketing spend in one interactive Excel file.
- Can beginners use this dashboard easily?
Yes, it’s designed with user-friendly navigation, slicers, and pre-built formulas—no coding knowledge is required.
- How often should I update the data?
Ideally, update the Data Sheet monthly or weekly to keep your performance metrics accurate.
- Can I add more KPIs to this dashboard?
Absolutely! You can expand the data structure to include more KPIs like conversion rate, customer retention, or inventory turnover.
- Is this dashboard compatible with Power BI or Google Sheets?
Yes, you can export the data to Power BI or connect it to Google Sheets for advanced analytics.
- What industries can use this dashboard?
Any industry—retail, manufacturing, IT, finance, or services—can benefit from it, as it’s fully customizable.
- Do I need Excel expertise to use it?
Basic Excel knowledge is enough. The template handles calculations and visuals automatically.
- Can it handle large datasets?
Yes, Excel’s pivot tables and Power Query handle thousands of records efficiently.
- How does this dashboard improve decision-making?
It provides visual insights into trends and performance gaps, helping you make faster and more confident business decisions.
- Where can I get a ready-to-use version of this dashboard?
You can download the Business Growth Dashboard in Excel from NextGenTemplates.com — ready for immediate use and customization.
Visit our YouTube channel to learn step-by-step video tutorials
Watch the step-by-step video tutorial:
Click to buy Business Growth Dashboard in Excel