Running a coaching or tutoring institute requires more than teaching. You need to track student progress, monitor class performance, check revenue, improve tutor quality, and plan resources. When data spreads across different sheets or files, educators struggle to understand what works and what needs improvement. Because of this, many institutions now use a Coaching & Tutoring KPI Dashboard in Excel to manage their entire performance in one place.Coaching & Tutoring KPI Dashboard in Excel,
This detailed guide explains everything about building, using, and optimizing a Coaching & Tutoring KPI Dashboard in Excel. You will learn the key worksheets, structure, features, advantages, best practices, and FAQs to help you get the most accurate insights from your data.
Click to buy Coaching & Tutoring KPI Dashboard in Excel
What Is a Coaching & Tutoring KPI Dashboard in Excel?
A Coaching & Tutoring KPI Dashboard in Excel is an easy-to-use performance management tool that brings all important academic, operational, and financial KPIs into one template. It gives decision-makers clear insights through charts, tables, comparisons, and trend analysis.
The dashboard tracks:
- Student enrollment trends
- Attendance performance
- Class completion rates
- Tutor ratings
- Revenue and expense KPIs
- Student satisfaction
- Lead conversion
- Batch performance
- Monthly or yearly targets
Since the dashboard runs inside Excel, teams do not need advanced software. Anyone can update the data and view the results in real time.
Why Do Coaching Centers Need a KPI Dashboard?
Every coaching and tutoring center collects huge amounts of data. However, without proper visualization, data remains unused. A dashboard solves this problem because it:
- Converts raw data into meaningful insights
- Highlights weekly and monthly performance
- Shows which classes need improvement
- Helps tutors enhance their teaching
- Supports decision-making for admissions and marketing
- Saves time by automating monthly reporting
With a dashboard, coaching businesses run smoothly and take better decisions.
Key Features of the Coaching & Tutoring KPI Dashboard in Excel
In this dashboard, we have structured the entire performance into seven important worksheets. These worksheets help you track KPIs, input data, view trends, and compare actual vs target results.
Let’s explore each sheet in detail.
Summary Page – The Excel Navigation Hub
The Summary Page works like an index. It contains six buttons that link to other worksheets. Because of this, users move smoothly between sheets without searching through tabs. This simple navigation improves user experience and saves time.

Click to buy Coaching & Tutoring KPI Dashboard in Excel
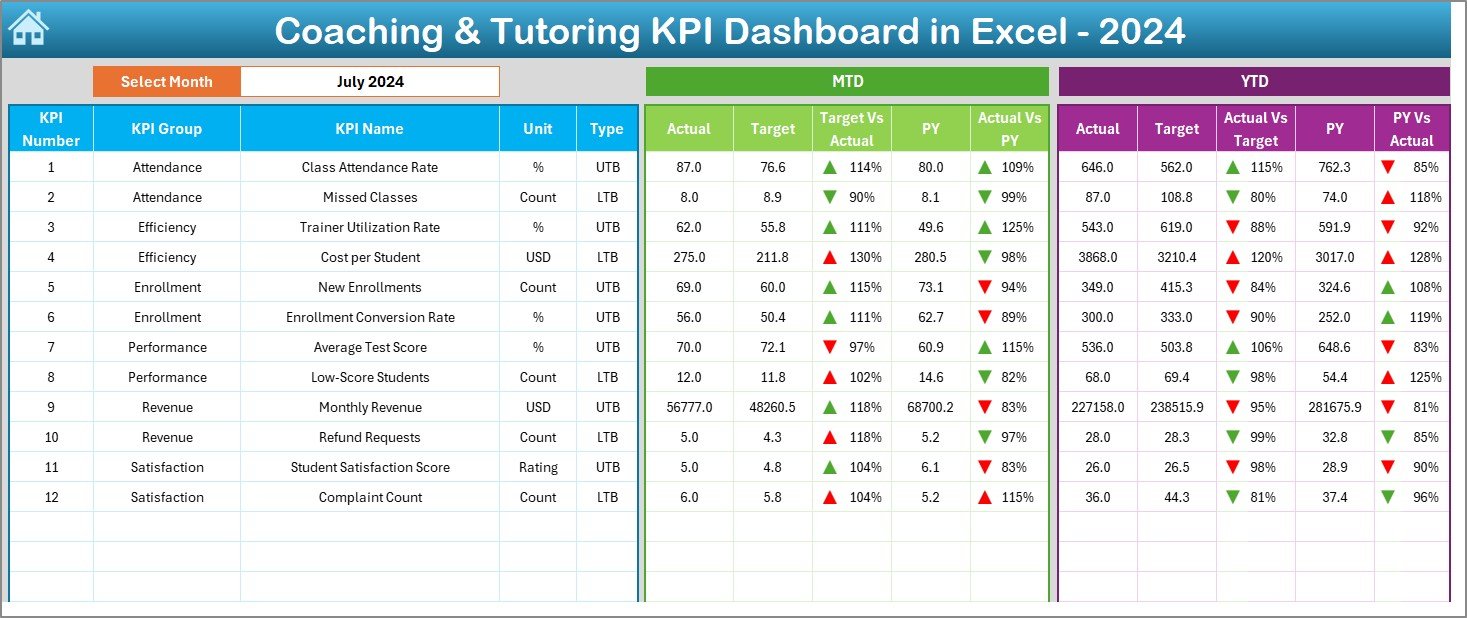
Dashboard Sheet – The Main Performance View
The Dashboard is the heart of the system. You can pick any month from a drop-down in cell D3 and view all KPIs for that period. The dashboard auto-updates instantly.
It displays:
MTD (Month-to-Date) KPIs
- Actual values
- Targets
- Previous year numbers
- Target vs Actual comparison
- Previous Year vs Actual comparison
- Up/Down arrows for performance signals
YTD (Year-to-Date) KPIs
- Actual
- Target
- Previous year
- Comparison insights
Transitioning between months becomes easy. Because of this, coaching centers track their performance more accurately and identify gaps faster.
Click to buy Coaching & Tutoring KPI Dashboard in Excel
Trend Sheet – KPI-Level Insights
The Trend Sheet allows you to select any KPI using a drop-down in cell C3. After selection, you will see:
- KPI Group
- Unit (Percentage, Number, Hours, etc.)
- KPI Type (UTB – Upper The Better / LTB – Lower The Better)
- KPI Formula
- KPI Definition
You also see:
MTD and YTD Trend Charts
These charts display:
- Actual vs Target vs Previous Year
- Monthly trends
- Yearly improvement pattern
- Performance accuracy
This sheet helps you understand which KPIs are improving and which KPIs need attention.

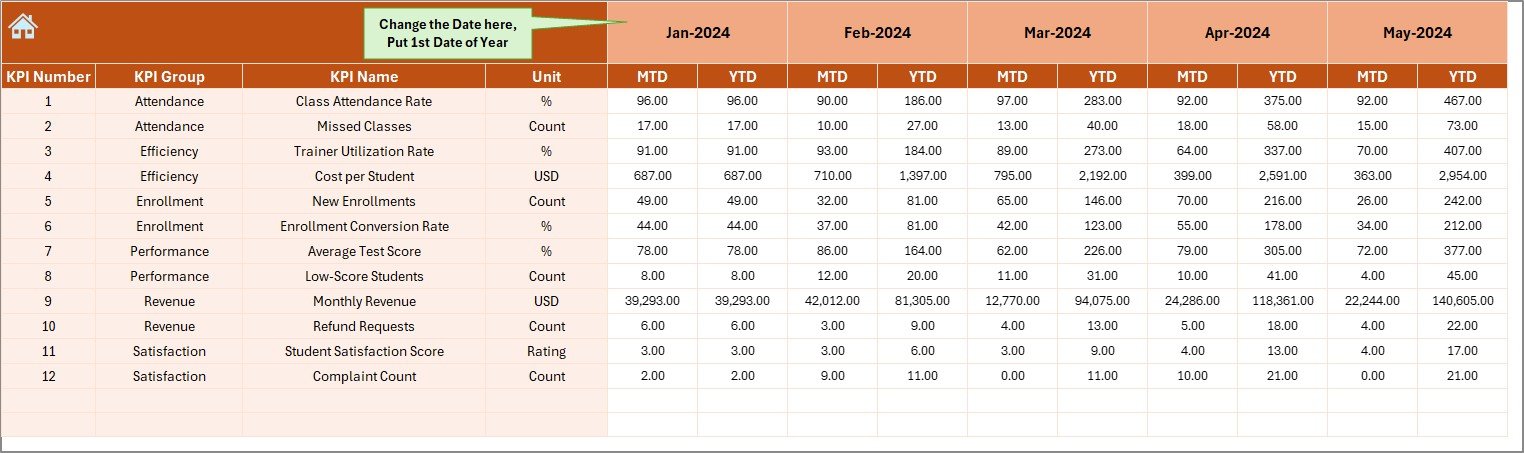
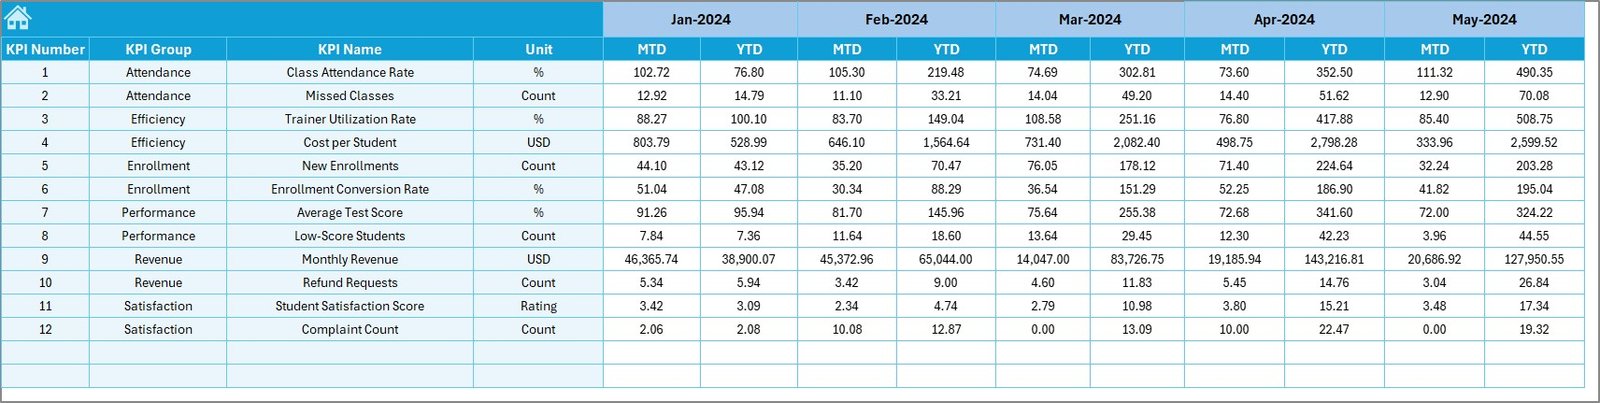
Actual Numbers Input Sheet – Monthly Data Entry Sheet
In this sheet, users enter:
- MTD Actual values
- YTD Actual values for each month
You can change the month by selecting the first month of the year in cell E1. This makes data entry simple and fast. Because the dashboard updates automatically, you see results instantly.
Target Sheet – Setting Monthly and Yearly Targets
This worksheet captures:
- Monthly MTD targets
- YTD targets
Targets help coaching centers monitor whether the performance meets expectations. They also help managers understand which KPIs require more focus and resource planning.
Click to buy Coaching & Tutoring KPI Dashboard in Excel
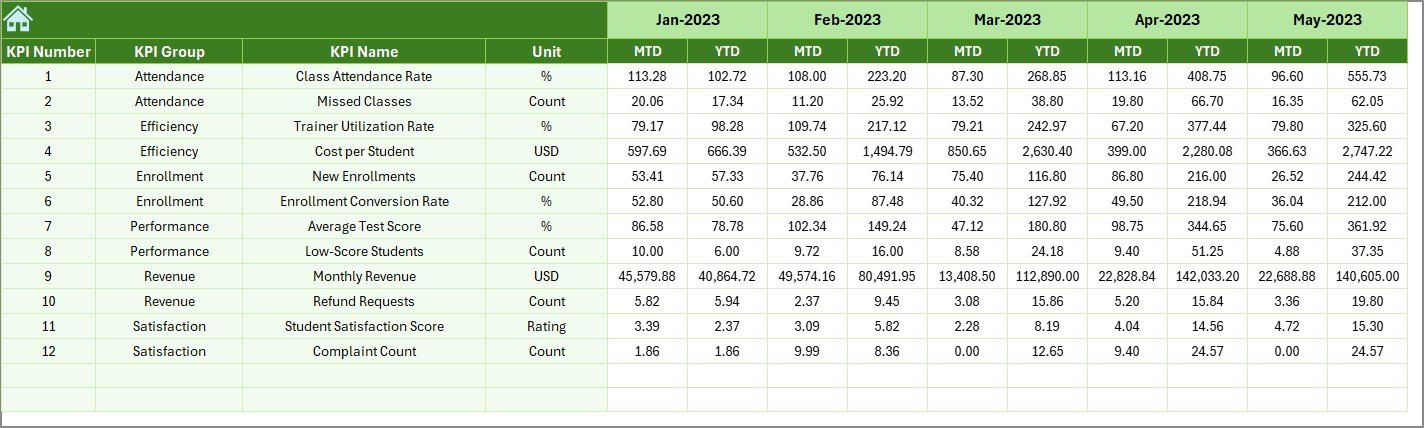
Previous Year Numbers Sheet – Benchmarking Sheet
Here you enter:
- Previous year’s KPI numbers
These numbers help you identify:
- Growth patterns
- Decline in performance
- Seasonal trends
- Improvement areas
Comparing current performance with last year gives coaching centers a strong competitive advantage.
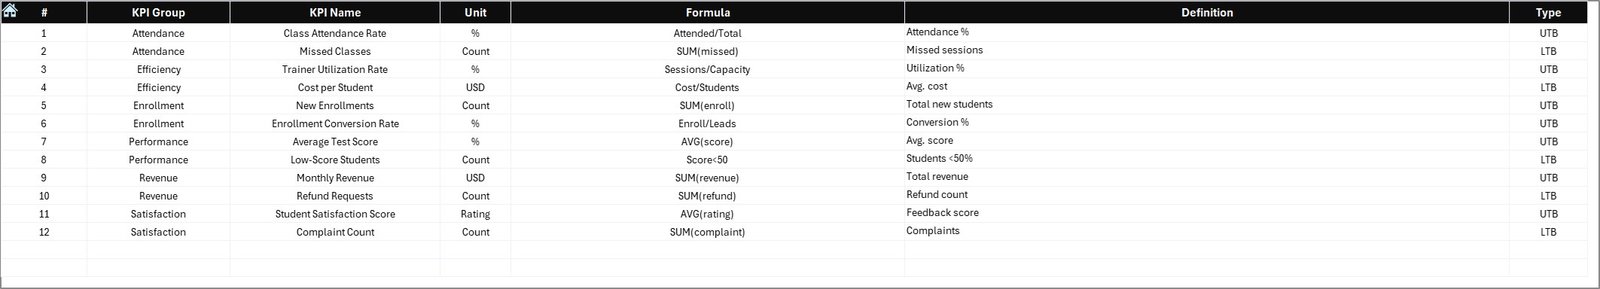
KPI Definition Sheet – KPI Library
This worksheet includes:
- KPI Name
- KPI Group
- Unit
- Formula
- Definition
This sheet helps users understand each KPI and keeps the dashboard structured. New team members can learn the KPIs quickly, which makes onboarding easier.
Why Should Coaching Centers Use a KPI Dashboard?
Coaching centers operate in a competitive environment. They must track hundreds of metrics. A KPI dashboard simplifies everything.
Here are the most important reasons:
You get complete visibility of your performance
You identify the subjects or tutors that need improvement
You track student satisfaction and feedback
You evaluate admissions and lead conversion
You improve your revenue planning
You reduce manual reporting time
You make better academic decisions
Advantages of the Coaching & Tutoring KPI Dashboard in Excel
Using this dashboard brings several key advantages. Let’s look at them in detail.
- Better Student Performance Understanding
You see which students perform well and who needs support. Because of this, coaching centers plan interventions more effectively.
- Improved Tutor Quality
Tutor ratings identify high-performing teachers and show who needs training. This improves teaching standards.
- Accurate Business Planning
The dashboard tracks revenue, expenses, and profit trends. Managers plan budgets with more accuracy.
- Faster Decision-Making
MTD and YTD summaries highlight performance gaps instantly. Leaders then take quick action.
- Stronger Student Engagement
You measure:
- Attendance
- Participation
- Satisfaction
- Feedback
These KPIs improve learning outcomes.
- No Need for Extra Software
The entire system works in Excel. No extra cost and no advanced skills needed.
How Does the Dashboard Help Different Teams?
For Management
- Tracks financial KPIs
- Supports strategic planning
- Highlights performance issues
For Academic Heads
- Tracks batch performance
- Improves curriculum planning
- Identifies tutor training needs
For Tutors
- Tracks their own performance
- Improves teaching quality
- Helps manage student outcomes
For Admin Teams
- Helps with student admissions
- Supports attendance management
- Improves reporting accuracy
Best Practices for the Coaching & Tutoring KPI Dashboard in Excel
Follow these best practices to get the best results from your dashboard.
- Update Data Every Month Without Delay
Fresh data gives accurate insights. Set a fixed date for data updates.
- Keep KPI Definitions Clear
Clear definitions help teams understand metrics better.
- Use Conditional Formatting
Color coding helps users identify:
- Good performance
- Decline
- Urgent issues
- Protect Sensitive Cells
Lock formulas and key sections to prevent errors during data entry.
- Review Trends, Not Just Current Month
Trend analysis shows long-term improvement or decline.
- Train Team Members
Teach your team how to use filters, slicers, and navigation buttons.
- Compare Actual vs Target Regularly
This improves responsibility and transparency.
Conclusion
A Coaching & Tutoring KPI Dashboard in Excel helps coaching centers make better decisions, track student progress, evaluate tutor performance, and improve business efficiency. The dashboard combines all important KPIs into a single template and presents them using clean visuals, month-wise comparisons, and trend charts.
By using the seven worksheets—Summary, Dashboard, Trend, Actual Numbers, Target, Previous Year, and KPI Definitions—you get a complete performance management system without needing advanced software.
When coaching centers track data consistently, they improve learning outcomes, increase revenue, and strengthen their competitive advantage.
Frequently Asked Questions (FAQs)
- What KPIs should a coaching center track?
Coaching centers should track enrollment, attendance rate, tutor rating, batch performance, revenue, lead conversion, student satisfaction, and class completion rate.
- Can beginners use this Excel dashboard easily?
Yes. The dashboard is built in a simple and clean structure. Even beginners can update the data and view results.
- Can I customize the KPIs?
Yes. You can add or remove KPIs in the KPI Definitions Sheet and adjust formulas.
- Does the dashboard support multiple branches?
Yes. You can add branch-level KPIs and use filters for analysis.
- Why do coaching centers need monthly MTD and YTD tracking?
MTD and YTD tracking helps you understand short-term progress and long-term performance. It also highlights improvement areas quickly.
- Can I import data from other systems into this dashboard?
Yes. You can paste data from CRM systems, attendance apps, or any external sources.
- Do I need Excel expertise to maintain the dashboard?
No. Basic Excel knowledge is enough.
Visit our YouTube channel to learn step-by-step video tutorials
Watch the step-by-step video tutorial:
Click to buy Coaching & Tutoring KPI Dashboard in Excel