Running a convenience store looks simple from the outside, but every store owner knows the truth. Daily operations involve tracking sales, inventory, shrinkage, customer flow, store expenses, staff productivity, and overall profitability. Because of this, convenience store managers need a clear and organized way to monitor performance. This is where the Convenience Stores KPI Dashboard in Excel becomes extremely useful.
A KPI dashboard helps store owners track all performance indicators in one place. It converts raw numbers into charts, cards, and meaningful insights so you can take action quickly. In this guide, we will explore everything about this dashboard—how it works, why it matters, its features, advantages, best practices, and how to get the maximum value from it.
Click to buy Convenience Stores KPI Dashboard in Excel
What Is a Convenience Stores KPI Dashboard in Excel?
A Convenience Stores KPI Dashboard in Excel is a simple and interactive reporting tool that displays the essential performance indicators of a convenience store in an easy-to-understand visual format. It brings together data related to:
- Sales
- Inventory levels
- Stock turnover
- Customer count
- Shrinkage
- Store expenses
- Profit margin
- Staff performance
Since Excel supports charts, conditional formatting, pivot tables, and automation, managers can easily transform daily operational data into analytical insights. As a result, decisions become faster, smarter, and more accurate.
Why Do Convenience Stores Need a KPI Dashboard?
Convenience stores work in a fast-paced environment. Every day matters. Inventory moves quickly, competition is high, and even a small delay in decisions can impact profit.
A KPI dashboard gives managers:
- Real-time visibility
- Trend analysis
- Early warnings
- Performance comparisons
- Decision support
This helps you manage stock better, reduce losses, track sales patterns, and improve revenue.
Key Features of the Convenience Stores KPI Dashboard in Excel
We have created a detailed Excel dashboard that contains seven worksheets. Each worksheet has a specific purpose and works together to give a complete picture of store performance.
Let’s explore these sheets in detail.
Summary Page – A Quick Navigation Panel
The Summary Page acts as the dashboard’s index page. It includes buttons that allow you to jump to different sheets instantly. This makes navigation easy and smooth, especially for users who want quick access to data.
What’s inside the Summary Page:
- A simple layout
- Buttons for quick navigation
- Clear structure for new users
This page improves user experience and helps you reach any part of the dashboard in seconds.

Click to buy Convenience Stores KPI Dashboard in Excel
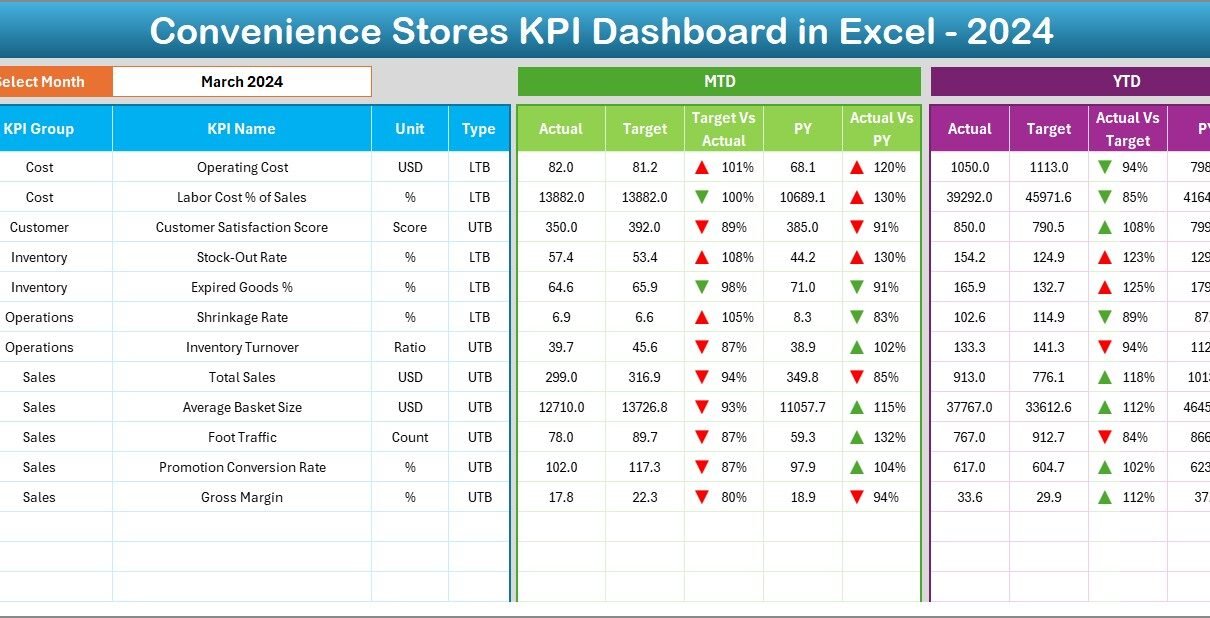
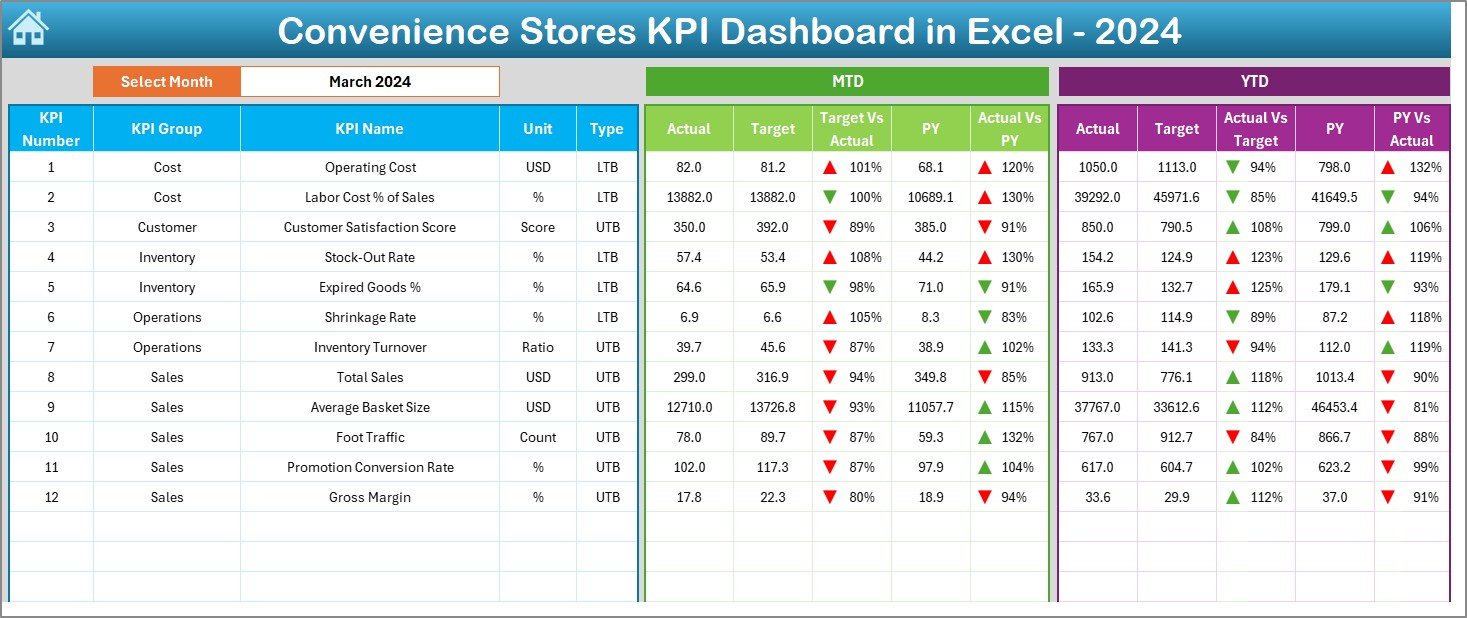
Dashboard Sheet – The Heart of the KPI Dashboard
The main Dashboard sheet displays all key performance indicators. It simplifies monthly and yearly performance comparison and helps managers focus on what matters most.
Key elements of the Dashboard Sheet:
- Month Selector (D3): Choose the month to refresh all KPI visuals
- MTD View:
- Actual
- Target
- Previous Year
- Target vs Actual
- PY vs Actual
- YTD View:
- Actual
- Target
- Previous Year
- Target vs Actual
- PY vs Actual
The dashboard uses conditional formatting with up/down arrows, making trends easy to understand.
Why this sheet is important:
- Helps compare performance with targets
- Highlights issues instantly
- Shows where improvement is needed
- Gives a full month-wise and year-to-date picture
Click to buy Convenience Stores KPI Dashboard in Excel
Trend Sheet – KPI-Level Trend Analysis
This sheet allows you to review performance for each KPI over time.
Highlights of the Trend Sheet:
- Dropdown to select KPI (C3)
- Shows KPI Group, Unit, Type (LTB/UTB)
- Displays KPI formula and definition
- Shows MTD and YTD trend charts
- Charts for Actual, Target, and Previous Year
This sheet helps managers identify:
- Seasonal behavior
- Growth patterns
- Improvement areas
- KPIs that need more attention

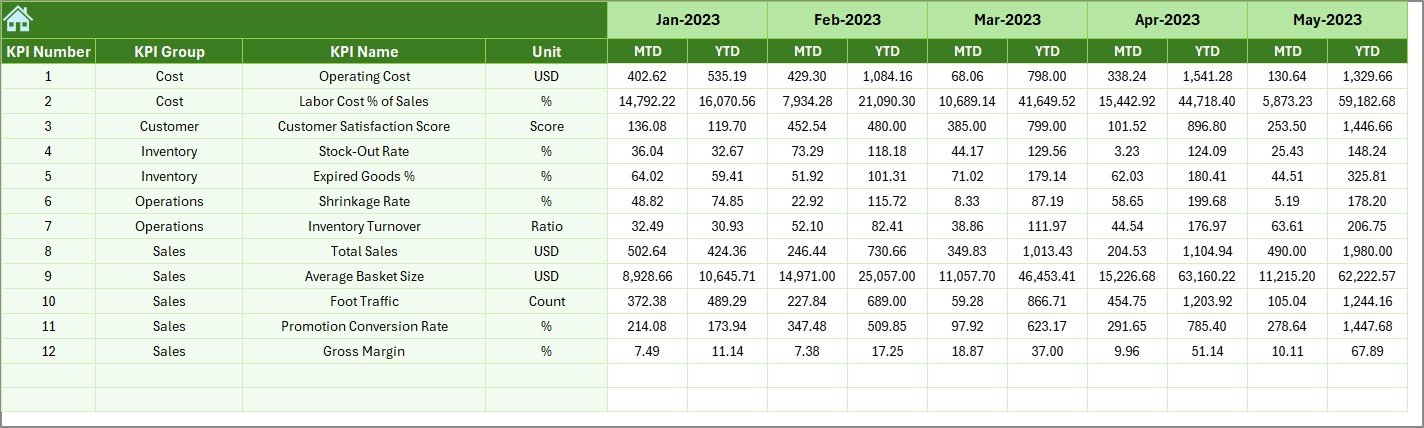
Actual Numbers Input Sheet – Enter Your Real Performance Data
This sheet is the data entry sheet for all actual performance numbers.
Key features:
- Enter actual values for MTD and YTD
- Month selection available in E1
- Change the starting month anytime
- Simple layout for easy data entry
This sheet acts as the backbone of the dashboard.

Click to buy Convenience Stores KPI Dashboard in Excel
Target Sheet – Enter Monthly and Yearly Targets
Your store can’t improve without measurable goals. This sheet allows you to enter:
- Monthly target (MTD)
- Yearly target (YTD)
- Targets for every KPI
Once you enter targets, the dashboard calculates performance automatically. As a result, managers can quickly compare actual values with targets.

Previous Year Numbers Sheet – Historical Comparison
To understand performance, you must compare it with past results. This sheet helps you do that.
What it contains:
- Previous year’s actual values
- Month-wise data structure
- MTD and YTD numbers
Comparing this data with current year numbers gives valuable insights.
KPI Definition Sheet – Store Key KPI Details
This sheet lists all KPIs used in the dashboard.
It includes:
- KPI Name
- KPI Group
- Unit
- Formula
- Definition
This sheet ensures clarity and consistency. New team members can easily understand each KPI without confusion.

What KPIs Should Convenience Stores Track?
A Convenience Store KPI Dashboard should track the most important metrics. These indicators provide a full view of the store’s financial and operational health.
Here are the essential KPIs:
- Total Sales
Measures the total revenue generated during the period. Helps track overall business performance.
- Gross Margin
Shows how much profit the store keeps after deducting cost of goods sold.
- Foot Traffic / Customer Count
Monitors how many customers enter the store. Helps track trends and marketing impacts.
Average Transaction Value (ATV)
ATV = Total Sales / Number of Transactions
Shows how much customers spend per purchase.
Inventory Turnover Rate
Helps measure how fast inventory sells. Fast turnover means better cash flow.
Shrinkage Percentage
Represents losses due to theft, damage, or errors. Reducing shrinkage increases profits.
Stock-Out Rate
Tracks how often products run out of stock. High stock-outs impact customer satisfaction.
Customer Return Rate
Measures how many products customers return. Helps detect product or service quality issues.
Store Expense Ratio
Helps control operating costs. Lower ratio means better cost management.
Net Profit Margin
Tracks final profitability. It is the most important financial KPI.
Advantages of Using a Convenience Stores KPI Dashboard in Excel
A KPI dashboard brings multiple benefits. Let’s explore the most important ones.
- Better Decision Making
You see all important metrics in one place. So, managers make faster and smarter decisions.
- Improved Store Performance
The dashboard highlights weak areas. Because of this, managers can take corrective actions quickly.
- Easy Data Entry and Updates
Excel makes it simple to update numbers. Anyone can maintain this dashboard without technical skills.
- Saves Time
You don’t need to check multiple reports. The dashboard automatically updates all visuals.
- Accurate Trend Analysis
Trend charts help visualize performance patterns. You understand where your store is heading.
- Boosts Accountability
When KPIs are visible, staff take more responsibility for their performance.
- Customizable for Any Store
Excel dashboards are flexible. You can add or remove KPIs based on your needs.
How to Build a Convenience Stores KPI Dashboard in Excel
To build this dashboard, follow these steps:
Step 1: Set Up KPI Definitions
Define KPI name, group, unit, formula, and purpose.
Step 2: Create Data Input Sheets
Prepare sheets for:
- Actual data
- Target data
- Previous year data
Step 3: Design the Dashboard Sheet
Add charts, cards, pivot tables, slicers, and arrows for conditional formatting.
Step 4: Add Trend Analysis
Create the trend sheet with line charts for all KPIs.
Step 5: Link Everything
Connect all sheets with formulas. Use:
- SUMIFS
- AVERAGEIFS
- IF
- INDEX MATCH
- LOOKUP
Step 6: Build Navigation Page
Add buttons using Insert → Shapes → Assign Macro.
Step 7: Style the Dashboard
Use:
- Clean colors
- Clear fonts
- Icons
- Borders
- Consistent layout
Best Practices for the Convenience Stores KPI Dashboard in Excel
Follow these practices to keep your dashboard effective:
- Keep KPIs Simple and Relevant
Don’t overload the dashboard. Track only meaningful metrics.
- Update Data Regularly
Upload actual numbers daily or weekly for accuracy.
- Use Color Coding
Color coding improves readability and decision-making.
- Add Automation Where Possible
Use formulas and lookups to avoid manual errors.
- Review Trends Frequently
Trend charts help identify growth and decline early.
- Compare With Previous Year
Historical analysis shows whether strategies work.
- Keep the Dashboard User-Friendly
Avoid complex layouts. Aim for simplicity and clarity.
Conclusion
A Convenience Stores KPI Dashboard in Excel is one of the best tools for managing retail performance. It gives store managers a complete overview of sales, stock, customer activity, and profitability. With clear charts, accurate numbers, and easy navigation, this dashboard helps you stay ahead of competition.
When convenience store owners monitor KPIs regularly, they can reduce losses, improve performance, and increase profits. Because Excel is flexible and user-friendly, this dashboard becomes a powerful tool for both small and large convenience stores.
Frequently Asked Questions (FAQs)
- What are KPIs in convenience stores?
KPIs are performance indicators that measure sales, stock, expenses, and customer activity.
- Why do convenience stores need a KPI dashboard?
A dashboard helps track business performance, highlights issues, and improves decision-making.
- Can beginners use this Excel dashboard?
Yes. The dashboard is simple, and any store staff member can update it.
- What data do I need to maintain the dashboard?
You need actual numbers, target numbers, and previous year values.
- Can I add more KPIs to the dashboard?
Yes. The dashboard is fully customizable.
- How often should I update the data?
You should update data weekly or monthly for best results.
- Is this dashboard useful for multiple store locations?
Yes. You can create separate sheets or merge data for multiple branches.
Visit our YouTube channel to learn step-by-step video tutorials
Watch the step-by-step video tutorial:
Click to buy Convenience Stores KPI Dashboard in Excel