Employee advocacy has become one of the most powerful strategies for modern businesses. In simple terms, it refers to employees promoting and supporting their organization’s brand through social media, personal networks, and professional communities. A workforce that actively advocates for its company strengthens trust, expands brand visibility, and boosts engagement.
But how do you measure the impact of employee advocacy? That’s where an Employee Advocacy KPI Dashboard in Excel plays a vital role. Instead of relying on assumptions, businesses can track employee advocacy efforts using structured Key Performance Indicators (KPIs). This approach not only highlights achievements but also identifies areas for improvement.
In this article, we’ll explore the structure, features, benefits, and best practices of the Employee Advocacy KPI Dashboard in Excel, and we’ll also answer the most common questions related to its use.
Click to buy Employee Advocacy KPI Dashboard in Excel
What Is an Employee Advocacy KPI Dashboard in Excel?
An Employee Advocacy KPI Dashboard in Excel is a structured tool that allows businesses to track, measure, and analyze advocacy efforts by employees. It provides a centralized view of KPIs, enabling managers and teams to see how their advocacy activities perform against defined targets.
This dashboard eliminates guesswork. Instead, it provides real-time insights into metrics such as content shares, engagement levels, reach, impressions, and participation rates. With interactive Excel sheets, decision-makers can quickly identify high performers, track monthly trends, and optimize strategies.
Structure of the Employee Advocacy KPI Dashboard
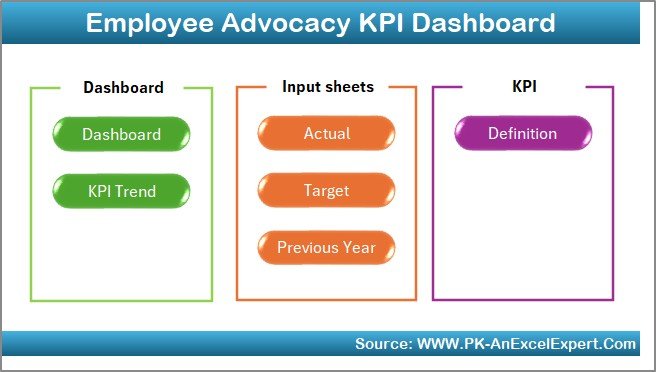
This Excel dashboard is designed with seven key worksheets, each serving a specific purpose. Let’s break them down one by one.
Home Sheet
- Works as an index page.
- Provides six navigation buttons to jump to the respective sheets.
- Saves time and ensures a user-friendly experience.
Click to buy Employee Advocacy KPI Dashboard in Excel
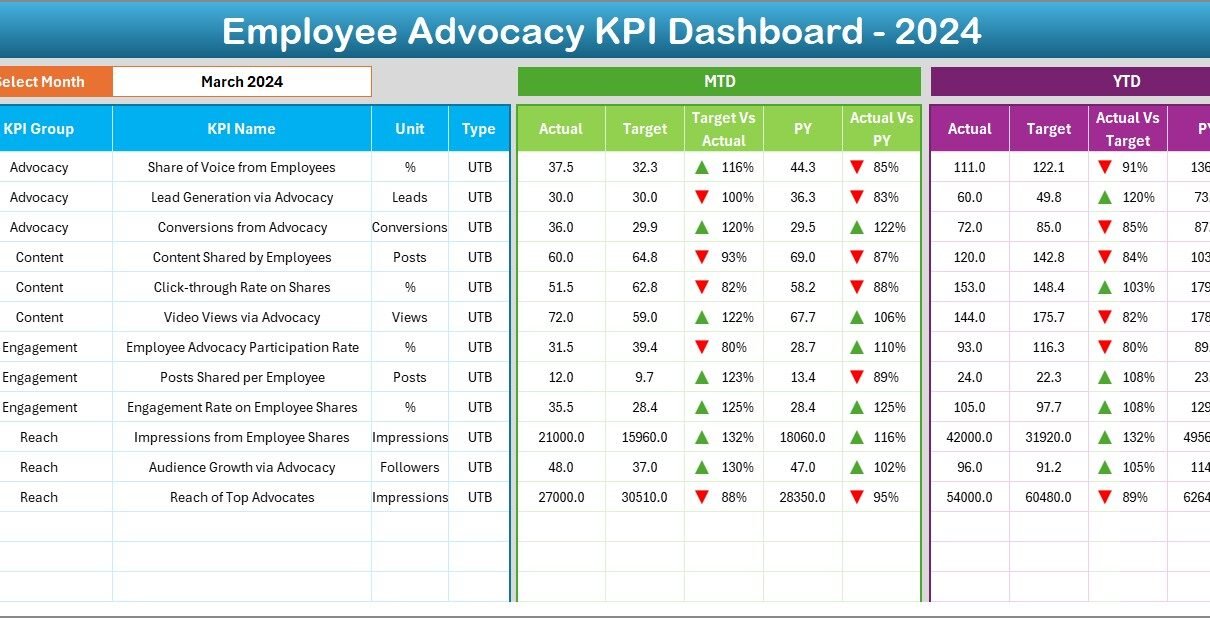
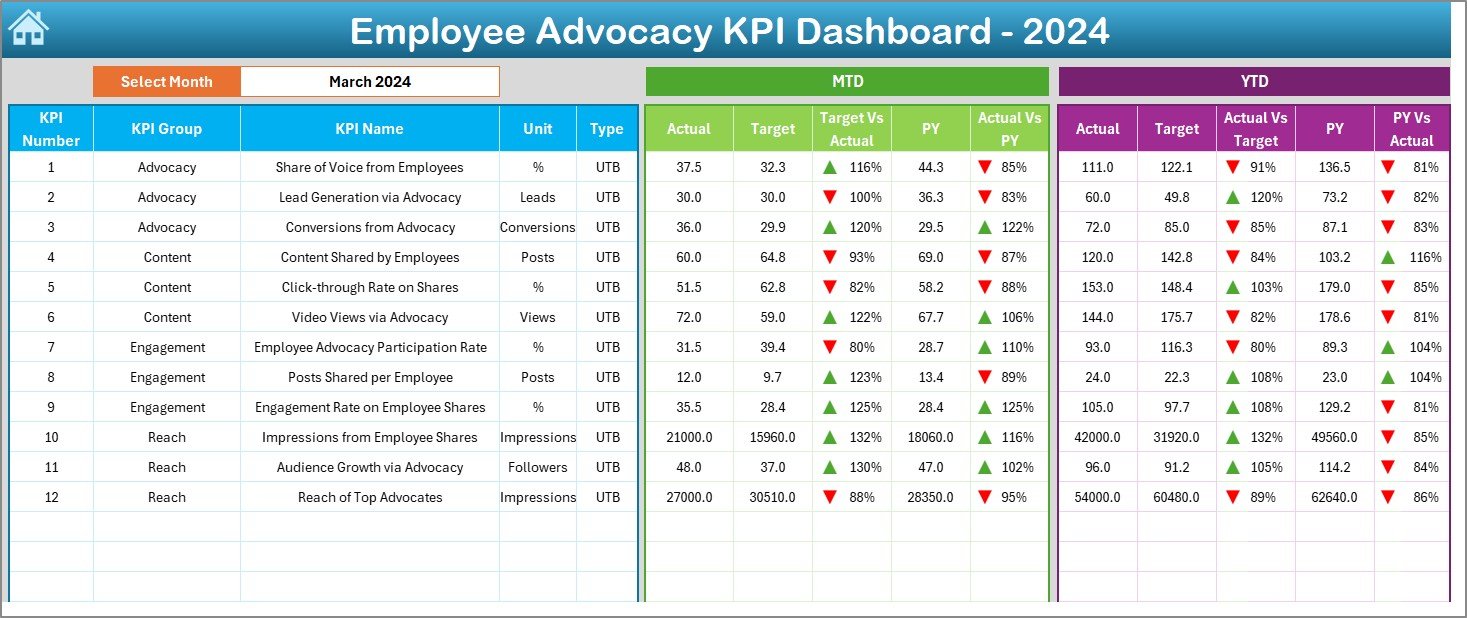
Dashboard Sheet
- The main visual sheet where all KPI insights appear.
- Includes a drop-down (cell D3) to select the month.
- Displays:
- MTD (Month-to-Date) Actual vs Target vs Previous Year.
- YTD (Year-to-Date) Actual vs Target vs Previous Year.
- Uses conditional formatting with arrows to show whether performance is trending upward or downward.
Click to buy Employee Advocacy KPI Dashboard in Excel
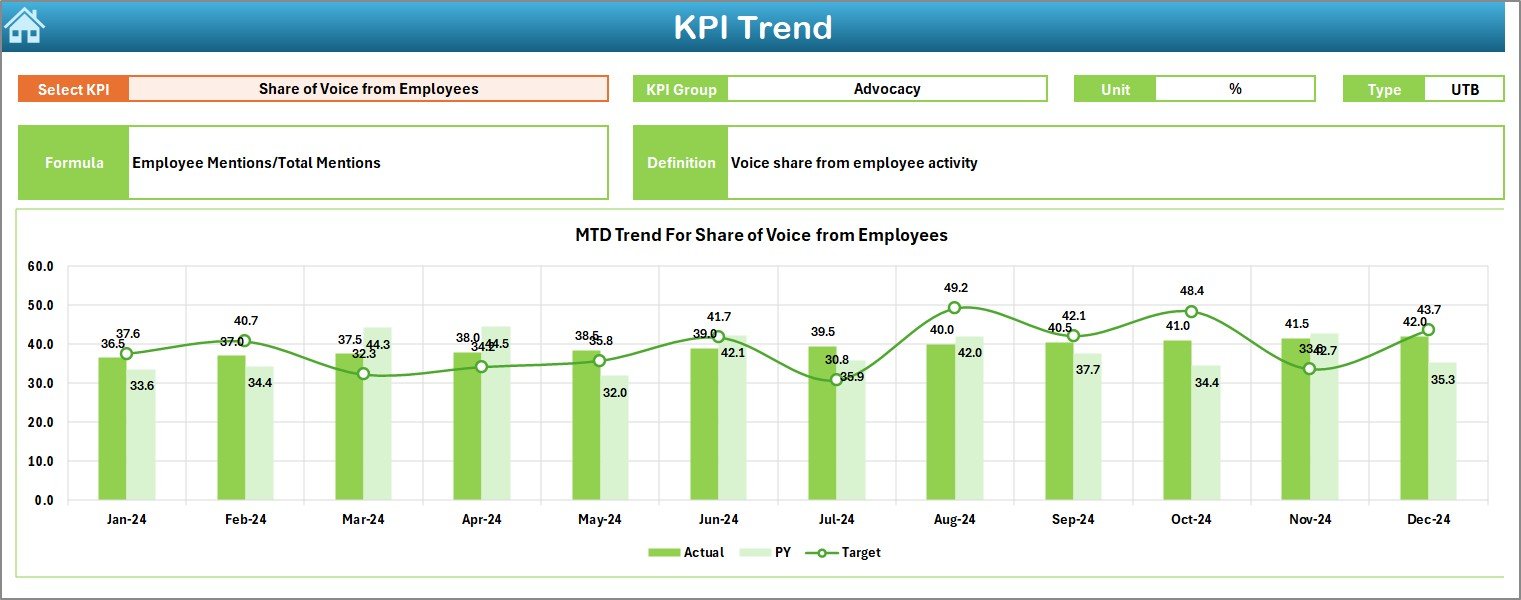
KPI Trend Sheet
- Focuses on detailed KPI analysis.
- Drop-down (cell C3) to select any KPI.
- Displays KPI Group, Unit, Type (UTB or LTB), Formula, and Definition.
- Shows trend charts comparing Actual vs Target vs Previous Year (both MTD and YTD).
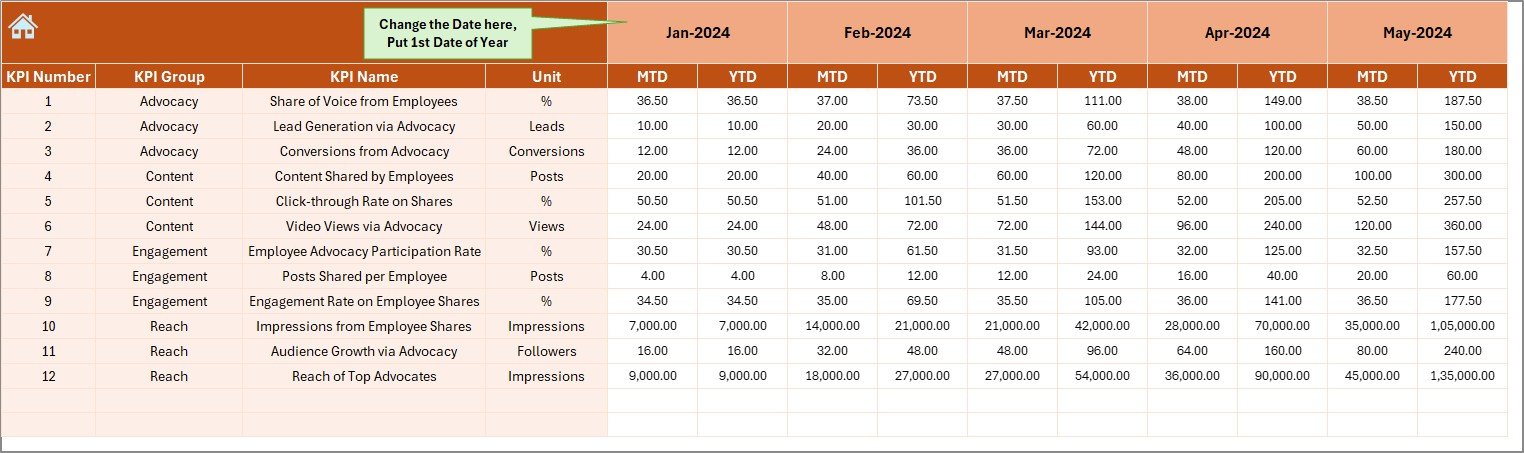
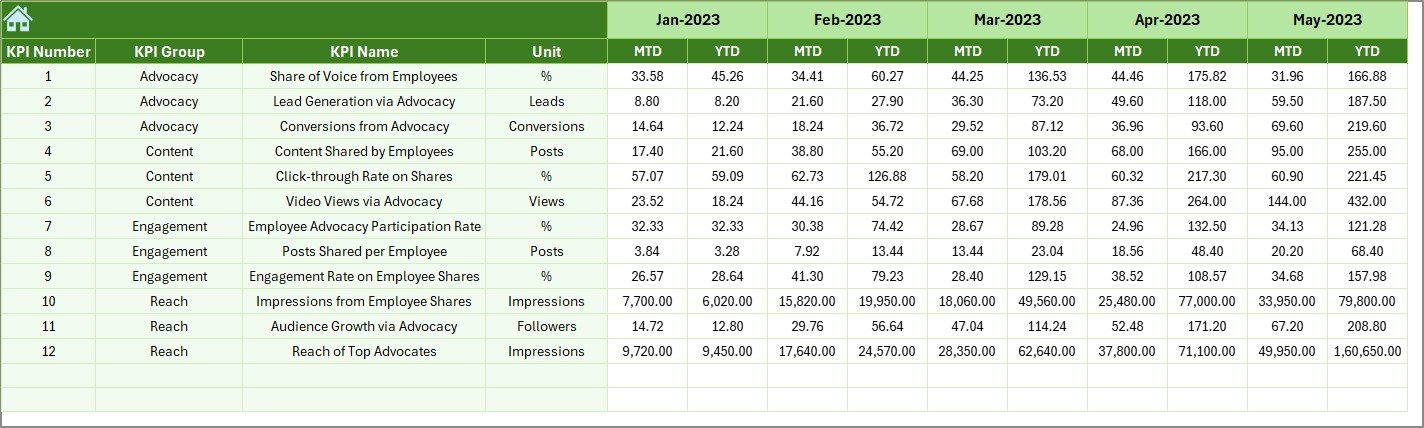
Actual Numbers Input Sheet
- Designed for entering actual MTD and YTD values.
- Month selection is available in cell E1.
- Users simply input the first month of the year to auto-update.
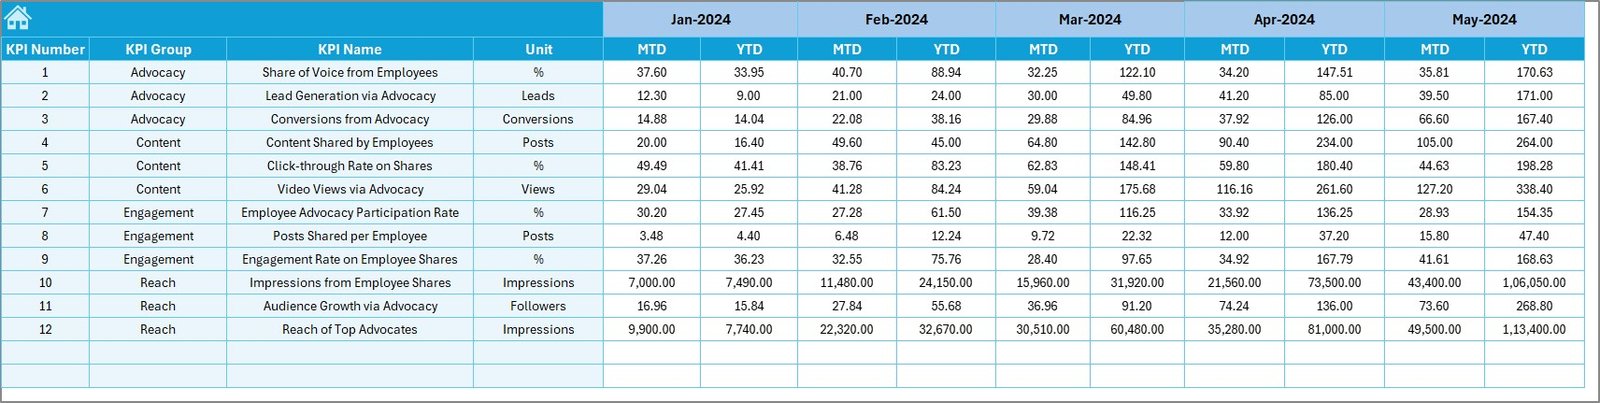
Target Sheet
- Stores target values for each KPI.
- Includes both MTD and YTD targets.
- Helps track progress against defined objectives.
Previous Year Numbers Sheet
- Stores data from the previous year in the same format.
- Helps compare past performance with the current year.
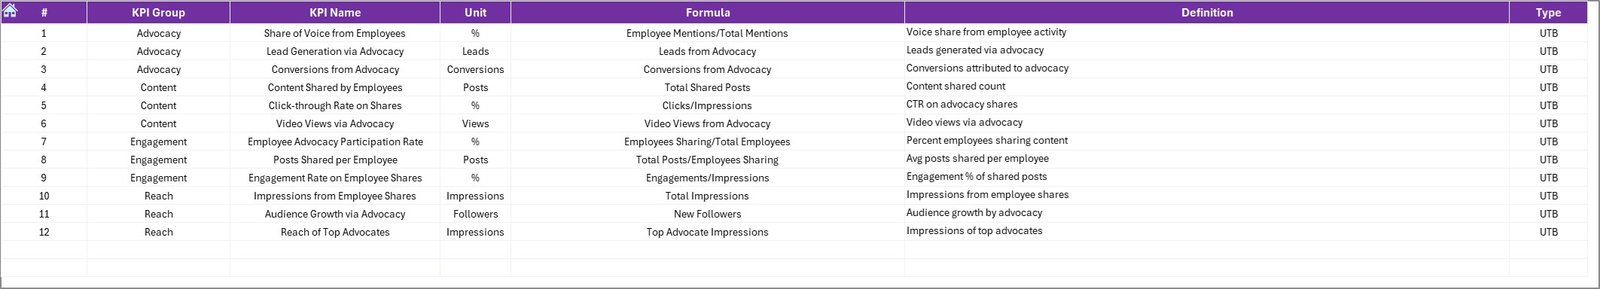
KPI Definition Sheet
- Serves as the master reference sheet.
- Includes KPI Name, Group, Unit, Formula, and Definition.
- Ensures all team members follow consistent definitions.
Click to buy Employee Advocacy KPI Dashboard in Excel
Key Features of the Dashboard
- Interactive controls: Drop-downs to select KPIs or months.
- MTD and YTD tracking: Clear view of monthly and cumulative performance.
- Target vs Actual comparison: Highlights areas where targets are achieved or missed.
- Previous Year comparison: Contextual insights for growth measurement.
- Conditional formatting: Quick visual cues with arrows and colors.
- Trend charts: Easy identification of progress or decline.
- Structured data input: Separate sheets for actuals, targets, and prior year.
- Centralized reference: KPI definitions available in one place.
Why Is Employee Advocacy Important?
Employee advocacy goes beyond marketing—it creates an environment of trust, authenticity, and brand loyalty.
- Boosts credibility: People trust employees more than corporate advertising.
- Increases brand reach: Employees extend a company’s voice to wider audiences.
- Encourages engagement: Teams feel connected when their voices are valued.
- Supports recruitment: Job seekers trust current employees’ experiences.
- Drives sales and leads: Authentic recommendations influence potential customers.
Advantages of Using the Employee Advocacy KPI Dashboard in Excel
Using this Excel-based dashboard offers several benefits:
- Clarity – See advocacy efforts in numbers, not assumptions.
- Cost-effective – Excel is accessible, affordable, and easy to use.
- Customizable – Add or remove KPIs based on your business needs.
- Accessible – No advanced technical knowledge required.
- Time-saving – Quick insights with automated charts and formatting.
- Comparative analysis – Evaluate current performance against targets and previous years.
- Data-driven culture – Encourages fact-based decision-making.
Examples of Employee Advocacy KPIs to Track
Some commonly used KPIs in an Employee Advocacy Dashboard include:
- Number of content shares per employee.
- Engagement rate on shared posts.
- Click-through rate from employee-shared content.
- Employee participation rate in advocacy programs.
- Reach and impressions of advocacy campaigns.
- Increase in followers due to employee posts.
- Leads generated from advocacy activities.
- Cost savings from organic reach vs paid ads.
Opportunities for Improvement in Employee Advocacy
Even with a powerful Excel dashboard, there are always areas for growth:
- Data quality: Ensure accurate data entry to avoid misleading insights.
- Participation: Encourage more employees to join advocacy programs.
- KPI alignment: Regularly revisit KPIs to match evolving goals.
- Automation: Explore Excel VBA or Power Query to automate repetitive updates.
- Integration: Combine Excel insights with CRM or social media analytics.
- Continuous training: Educate employees on the value of advocacy.
Best Practices for the Employee Advocacy KPI Dashboard
To get maximum value, follow these best practices:
- Define clear KPIs: Avoid vague metrics; focus on measurable ones.
- Standardize data input: Use consistent formats across months.
- Leverage visuals: Use conditional formatting, charts, and progress bars.
- Update regularly: Enter actuals monthly to keep the dashboard relevant.
- Compare YTD and MTD: Track both short-term and long-term trends.
- Promote transparency: Share results with employees to motivate them.
- Encourage gamification: Reward top advocates for their contributions.
- Review targets annually: Update them as business objectives evolve.
Practical Use Cases
Businesses can use the Employee Advocacy KPI Dashboard for multiple purposes:
- HR teams: Monitor employee participation in advocacy campaigns.
- Marketing teams: Track the reach of content shared by employees.
- Management: Evaluate cost savings compared to traditional ads.
- Recruiters: Highlight authentic employee stories to attract talent.
- Sales teams: Identify leads generated from advocacy channels.
Conclusion
Employee advocacy has become a cornerstone of modern brand strategy. When employees share authentic content, it creates trust, strengthens connections, and extends a company’s reach. However, to make advocacy successful, organizations must measure its impact consistently.
The Employee Advocacy KPI Dashboard in Excel provides the perfect balance of simplicity, affordability, and efficiency. With clear KPIs, structured data, and insightful visuals, businesses can transform advocacy efforts into measurable success.
Frequently Asked Questions (FAQs)
- What is an Employee Advocacy KPI Dashboard in Excel?
It’s an Excel-based tool that tracks and measures employee advocacy efforts using KPIs like shares, reach, and engagement.
- Why should companies measure employee advocacy?
Because advocacy directly impacts brand trust, recruitment, engagement, and even sales. Tracking ensures businesses optimize their efforts.
- Can small businesses use this dashboard?
Yes. The dashboard is cost-effective and scalable, making it ideal for startups and SMEs as well.
- What KPIs are most important for employee advocacy?
Key KPIs include content shares, engagement rate, participation rate, impressions, and leads generated.
- How often should I update the dashboard?
Ideally, update it monthly with MTD and YTD values. This ensures consistent tracking and reliable insights.
- Can this dashboard be automated?
Yes. Using Excel VBA or Power Query, many repetitive tasks like data entry and chart refresh can be automated.
- How does this compare with advanced BI tools?
While Power BI or Tableau offer more complex features, Excel dashboards are simpler, cost-effective, and accessible to everyone.
Visit our YouTube channel to learn step-by-step video tutorials
Watch the step-by-step video tutorial:
Click to buy Employee Advocacy KPI Dashboard in Excel