Maintaining the health and safety of employees is a top priority for organizations. The Employee Health and Safety Report in Excel provides a streamlined way to monitor and track incidents, severity levels, and preventive actions. This report helps businesses ensure that they maintain a safe working environment and adhere to regulatory requirements by analyzing incident data, resolution progress, and health-related incidents.
In this article, we will explore the features of the Employee Health and Safety Report in Excel, focusing on its key functionalities and benefits for managing employee safety.
What is the Employee Health and Safety Report in Excel?
The Employee Health and Safety Report in Excel is an advanced tool designed to track workplace incidents, monitor resolution progress, and assess the effectiveness of preventive actions. The report includes three sheets that provide an interactive way to analyze employee health and safety metrics:
Key Features of the Employee Health and Safety Report
Click to buy Employee Health and Safety Report in Excel
1) Summary Sheet Tab: High-Level Overview with Metrics and Charts
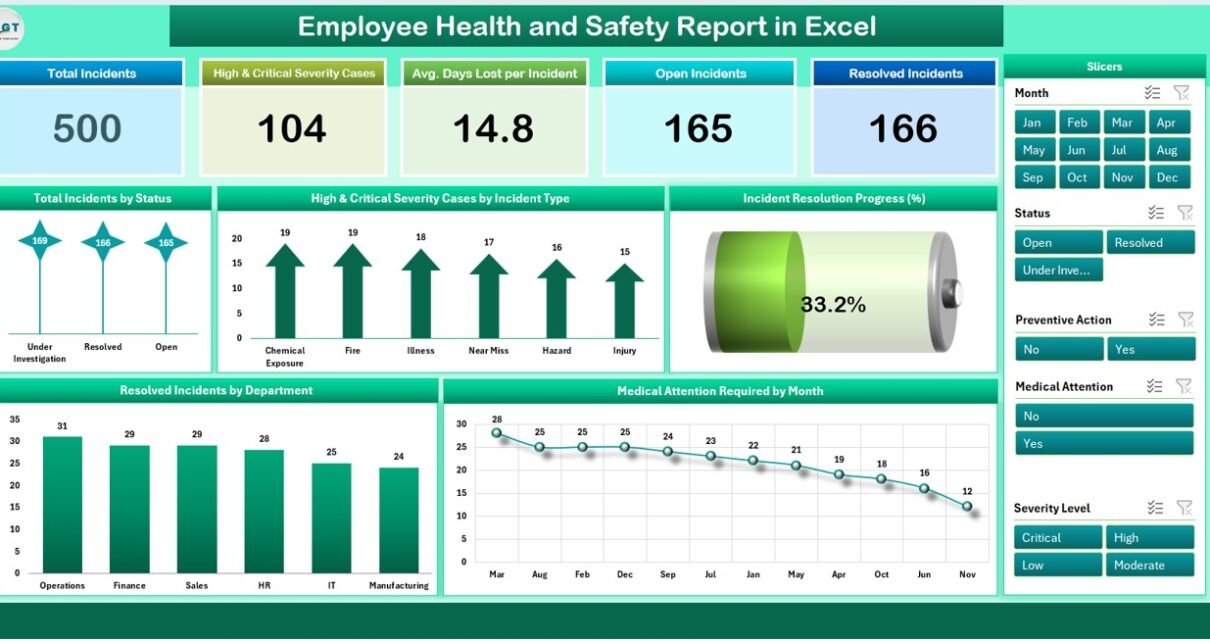
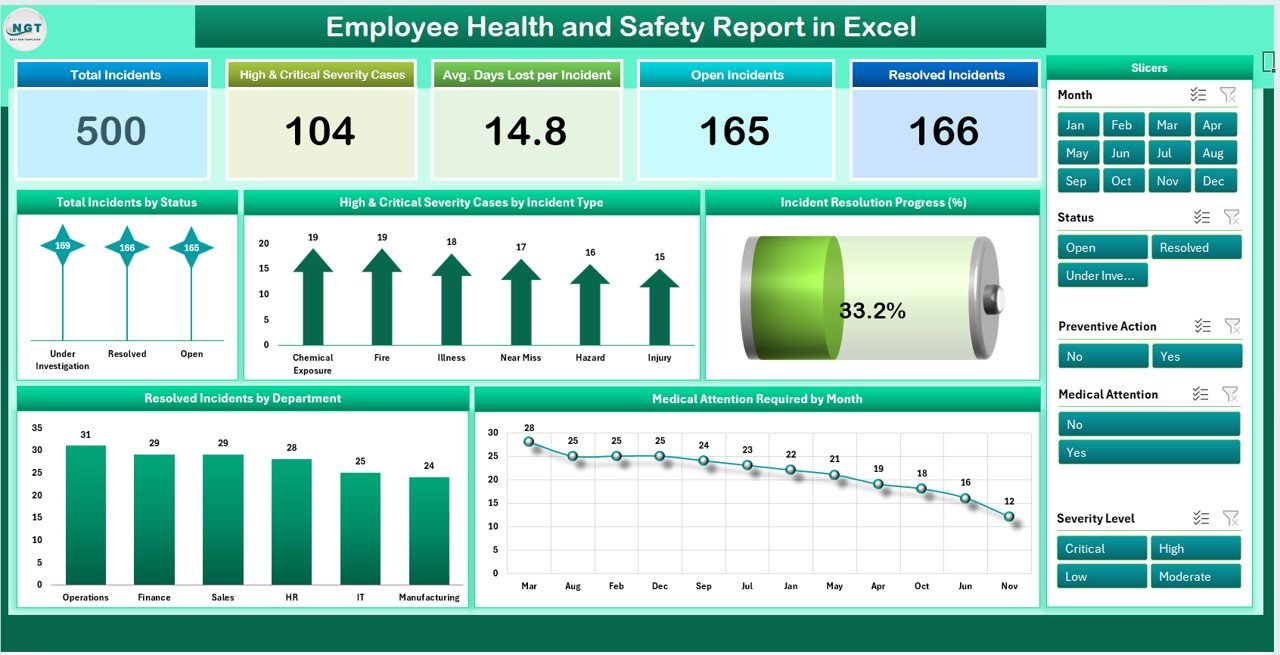
The Summary Sheet Tab is the dashboard that provides a high-level overview of health and safety performance across the organization. This sheet includes:
Cards:
- Total Incidents: Displays the total number of incidents reported.
- High & Critical Severity Cases: Shows the number of incidents classified as high or critical severity.
- Avg. Days Lost per Incident: The average number of days lost per incident.
- Open Incidents: The total number of incidents that are still open and unresolved.
- Resolved Incidents: The total number of incidents that have been successfully resolved.
Charts:
- Total Incidents by Status: Breaks down incidents based on their status (e.g., open, resolved, under review).
- High & Critical Severity Cases by Incident Type: Categorizes high and critical severity incidents by their type (e.g., slip and fall, electrical accidents).
- Incident Resolution Progress (%): Shows the percentage of incidents resolved versus the total number of incidents.
- Medical Attention Required by Month: Tracks the number of incidents that required medical attention, displayed by month.
- Resolved Incidents by Department: Breaks down resolved incidents by department to highlight areas of improvement.
This sheet allows you to view key health and safety metrics at a glance, enabling quick decision-making and identification of problem areas.
Click to buy Employee Health and Safety Report in Excel
2) Report Sheet Tab: Pivot Tables and Data Analysis
The Report Sheet Tab provides more detailed insights into the data, using pivot tables and slicers for flexible data filtering. Features include:
-
Pivot Tables: Allows you to filter and organize data by different variables such as department, region, incident type, and severity level.
-
Slicers: Provides interactive filters that let you slice the data by different parameters (e.g., month, year, severity level), making it easier to analyze trends and incidents.
This sheet is useful for generating detailed reports and performing in-depth analysis of health and safety data.

3) Data Sheet Tab: Centralized Incident Data Entry
Click to buy Employee Health and Safety Report in Excel
The Data Sheet Tab is where all incident-related data is entered. Key columns in this sheet include:
- Incident ID: A unique identifier for each incident.
- Employee Name: The name of the employee involved in the incident.
- Department: The department in which the incident occurred.
- Region: The region where the incident occurred (e.g., North, South).
- Incident Type: The type of incident (e.g., slip and fall, electrical accident).
- Incident Date: The date the incident occurred.
- Severity Level: The severity level of the incident (e.g., low, medium, high).
- Reported By: The name of the person who reported the incident.
- Status: The current status of the incident (e.g., open, resolved, under review).
- Days Lost: The number of workdays lost due to the incident.
- Medical Attention: Whether medical attention was required (Yes/No).
- Preventive Action: Any preventive action taken after the incident.
- Month & Year: The month and year in which the incident occurred.
- Total Incidents: Total number of incidents.
- High & Critical Severity Cases: Number of high and critical severity cases.
- Open Incidents: Total open incidents.
- Resolved Incidents: Total resolved incidents.
- Medical Attention Required: The number of incidents that required medical attention.
- Preventive Action Taken: Whether preventive action was taken (Yes/No).
This sheet serves as the data entry point for all incident-related information, helping you maintain a detailed log of all health and safety incidents within the organization.

Benefits of Using the Employee Health and Safety Report
Click to buy Employee Health and Safety Report in Excel
The Employee Health and Safety Report in Excel offers several key benefits for businesses looking to improve their workplace safety standards:
-
Centralized Incident Management: All incident-related data is stored in one place, making it easier to track and manage.
-
Real-Time Monitoring: The report is updated regularly, providing real-time insights into the status of incidents and resolutions.
-
Data-Driven Decision Making: With detailed charts, pivot tables, and slicers, the report allows you to make data-driven decisions to enhance workplace safety.
-
Customizable: The report is fully customizable, allowing you to adjust the layout, add new fields, or modify the charts to better suit your organization’s needs.
-
Compliance: The report helps ensure compliance with workplace safety regulations by tracking incident severity and preventive actions taken.
-
Improved Safety Culture: By analyzing trends and identifying areas for improvement, the report helps foster a proactive safety culture within the organization.
Best Practices for Using the Employee Health and Safety Report
To get the most out of the Employee Health and Safety Report, consider these best practices:
-
Update Regularly: Ensure that all incident data is entered and updated promptly to maintain accurate records.
-
Monitor Key Metrics: Focus on key metrics like Total Incidents, Severity Cases, Days Lost, and Resolved Incidents to identify patterns and areas that need attention.
-
Analyze Trends: Use the Incident Resolution Progress and Medical Attention Required charts to monitor trends over time and make improvements.
-
Leverage Pivot Tables and Slicers: Use the Report Sheet Tab to analyze data by department, region, and severity level, helping you identify specific areas of risk.
-
Share with the Team: Share the report with relevant stakeholders (e.g., safety managers, department heads) to ensure everyone is aligned on safety goals and initiatives.
Conclusion
Click to buy Employee Health and Safety Report in Excel
The Employee Health and Safety Report in Excel is an essential tool for managing and improving workplace safety. With its comprehensive features like detailed data entry, real-time insights, and interactive charts, this report helps organizations monitor incidents, track safety performance, and implement preventive actions. By using this report, businesses can improve their safety culture, minimize risks, and ensure a safer work environment for their employees.
Frequently Asked Questions (FAQs)
1. How do I update the Employee Health and Safety Report?
You can update the report by entering new incident data into the Data Sheet Tab. The charts and metrics in the Summary Sheet Tab and Report Sheet Tab will automatically update.
2. Can I track incidents by department or region?
Yes, the Report Sheet Tab allows you to filter incidents by department, region, incident type, and other variables using pivot tables and slicers.
3. How do I monitor the status of open incidents?
Use the Total Incidents by Status chart on the Summary Sheet Tab to track the number of open, resolved, and under review incidents.
4. Can I track preventive actions taken after an incident?
Yes, the Data Sheet Tab includes a Preventive Action Taken column, where you can log whether preventive action was implemented after an incident.
5. Can I share the Employee Health and Safety Report with my team?
Yes, since the report is built in Excel, you can easily share it with your team for real-time updates and collaboration.
Watch the step-by-step video Demo:
Visit our YouTube channel to learn step-by-step video tutorials
Click to buy Employee Health and Safety Report in Excel