Floriculture is one of the fastest-growing agricultural industries. It deals with activities such as flower cultivation, nursery management, greenhouse operations, production planning, transportation, and sales. Because this industry grows rapidly and deals with sensitive plants, every small error impacts quality, production, and profit. Therefore, managers need accurate insights and real-time tracking of performance indicators.
A Floriculture KPI Dashboard in Excel provides that clarity. It converts raw floriculture data into easy visuals and helps managers track production, quality, wastage, climate conditions, labour usage, sales trends, and profitability in one single dashboard. It supports faster decisions and improves the operational workflow in every department.
In this detailed article, you will learn how this dashboard works, why it is important, what each worksheet includes, the advantages, best practices, and answers to frequently asked questions.
Click to buy Floriculture KPI Dashboard in Excel
What Is a Floriculture KPI Dashboard in Excel?
A Floriculture KPI Dashboard in Excel is a ready-to-use analytics tool that shows all key performance indicators related to flower cultivation and related operations. You can track production volume, flowering rate, wastage, labour performance, sales revenue, cost of cultivation, and greenhouse efficiency. Because the dashboard uses Excel, no team needs advanced technical tools.
It brings data from different sheets into one view so managers can compare MTD (Month-to-Date), YTD (Year-to-Date), Targets, and Previous Year numbers. As a result, teams get real insight into areas where they grow well and areas that need improvement.
Why Do Floriculture Businesses Need KPI Dashboards?
Floriculture businesses handle many activities daily. Teams deal with climate conditions, irrigation, chemical usage, harvesting, packing, transportation, and sales. Because of this complexity, data spreads across many files. This creates slow decision-making.
A KPI dashboard removes this confusion. It brings all numbers into one structured place. It updates results instantly when the user selects any month or KPI from the drop-down. It also highlights numbers using conditional formatting so that you can spot improvement areas within seconds.
Key Features of the Floriculture KPI Dashboard in Excel
You shared the structure of the dashboard, and below is the expanded explanation of all 7 worksheet tabs included in this template:
Summary Page – Simple Navigation for All Users
The Summary Page works as the index sheet of the dashboard. It includes six buttons that help users move to any sheet instantly. As a result, navigation becomes simple, and users can explore details without using complex menus.
Teams who work with data daily can quickly jump to Dashboard, Trend, Actual Numbers, Targets, Previous Year Data, or KPI Definitions. Because of this convenience, data entry and analysis become fast and error-free.

Click to buy Floriculture KPI Dashboard in Excel
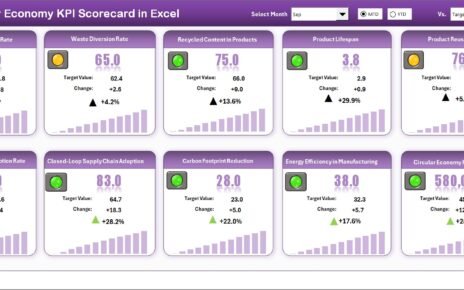
Dashboard Sheet – Complete KPI Overview
The Dashboard page serves as the main analysis sheet. It includes:
- A Month selector on cell D3
- MTD Actual, Target, and Previous Year numbers
- YTD Actual, Target, and Previous Year numbers
- Target vs Actual comparison
- Previous Year vs Actual comparison
- Conditional formatting arrows (Up and Down)
When you select any month from the drop-down, the entire dashboard updates automatically. This real-time refresh helps managers analyze:
- Monthly performance
- Target achievement rate
- Year-to-date progress
- Seasonality impact
- Previous year comparison trends
Because the dashboard includes arrows and colors, teams understand improvement or decline quickly.

Click to buy Floriculture KPI Dashboard in Excel
Trend Sheet – KPI-Level Trend Analysis
The Trend tab is one of the most useful parts of the dashboard. On cell C3, you can select any KPI from the drop-down list. Once you select the KPI, the system displays:
- KPI Group
- Unit of the KPI
- Type (Lower the Better or Upper the Better)
- KPI Formula
- KPI Definition
Below this information, two trend charts show:
- MTD Trend for Actual, Target, and Previous Year
- YTD Trend for Actual, Target, and Previous Year
This page helps users understand performance patterns across the year. Because the trends are clear and simple, teams can plan improvements, make accurate decisions, and identify seasonal variations.

Click to buy Floriculture KPI Dashboard in Excel
Actual Numbers Input Sheet – Enter Actual MTD & YTD Data
This sheet is fully dedicated to entering monthly actual numbers. You can change the start month from cell E1. Once you set the first month, the sheet adjusts automatically.
Users enter the MTD and YTD numbers for each KPI here. Since the dashboard pulls these numbers directly, accuracy becomes very important. This sheet keeps the data entry process structured and easy.

Click to buy Floriculture KPI Dashboard in Excel
Target Sheet – Record Monthly Targets for Each KPI
In this sheet, users need to enter both MTD and YTD targets for every KPI. These targets help teams measure performance more effectively.
With clear targets, managers understand:
- How well the team performed
- Where performance gaps exist
- Which departments need support
- Which areas require training or new resources
Because Excel calculates everything automatically, users get instant comparisons.

Click to buy Floriculture KPI Dashboard in Excel
Previous Year Data Sheet – Enter Historical Data
This sheet stores the previous year’s data for each KPI. You need to enter the MTD and YTD numbers here in the same format as the current year.
Previous year comparison helps teams:
- Analyze seasonal performance
- Understand improvement levels
- Measure yearly growth
- Identify repeat problems
This simple structure provides powerful insights into long-term performance.

Click to buy Floriculture KPI Dashboard in Excel
KPI Definition Sheet – Define Every KPI Clearly
Here users must enter:
- KPI Name
- KPI Group
- KPI Unit
- KPI Formula
- KPI Definition
- KPI Type (UTB or LTB)
This sheet works as a reference guide for everyone using the dashboard. It improves clarity and ensures every team member understands what each KPI means and how it is calculated.

Click to buy Floriculture KPI Dashboard in Excel
What KPIs Can You Track in a Floriculture Dashboard?
Although every floriculture business uses different KPIs, common indicators include:
- Production Volume
- Flowering Percentage
- Wastage Rate
- Quality Score
- Irrigation Efficiency
- Pesticide Usage
- Cost of Cultivation
- Harvesting Efficiency
- Labour Productivity
- On-Time Delivery Rate
- Sales Revenue
- Customer Complaints
This dashboard supports all these KPIs because it is fully customizable.
Why Should You Use a Floriculture KPI Dashboard in Excel?
You should use this dashboard because it:
- Organizes all KPI information in one place
- Improves the speed of decision-making
- Helps compare Actual, Target, and Previous Year numbers
- Shows MTD & YTD trends
- Highlights performance gaps
- Supports accurate planning
- Reduces manual mistakes
- Makes reporting simple and visual
Since it runs in Excel, anyone can use it without advanced training.
Advantages of a Floriculture KPI Dashboard in Excel
Below are the major advantages explained in simple words:
- Helps You Track All KPIs in One View
You no longer need multiple spreadsheets. Everything appears in one dashboard.
- Saves Time and Improves Decision Making
When numbers update instantly, teams respond faster and take better decisions.
- Highlights Problems Before They Grow
Conditional formatting alerts you when any KPI moves down. This helps you act immediately.
- Improves Accuracy and Reduces Errors
The structured input sheets reduce mistake chances. As a result, reports remain consistent.
- Shows Past, Present, and Target Comparisons
With Actual, Target, and Previous Year numbers, teams understand performance in detail.
- Supports Growth Planning
Trend charts show clear patterns, helping managers plan cultivation, staffing, and sales.
- Easy to Use and Easy to Customize
You can modify KPI names, formulas, and targets anytime.
How to Use the Floriculture KPI Dashboard Effectively?
Follow these steps for the best experience:
Step 1: Enter Actual Numbers
Go to the Actual Numbers sheet and record MTD and YTD values for all KPIs.
Step 2: Enter Monthly Targets
Input MTD and YTD targets in the Target sheet.
Step 3: Enter Previous Year Data
Copy last year’s MTD and YTD values into the Previous Year sheet.
Step 4: Define All KPIs
In the KPI Definition sheet, fill in KPI Group, Name, Unit, Formula, and Definition.
Step 5: Use the Dashboard Page
Select any month from cell D3 and review all indicators.
Step 6: Use the Trend Page
Select any KPI and study the trends to understand long-term performance.
Best Practices for Using a Floriculture KPI Dashboard in Excel
To get maximum value from this tool, follow these best practices:
Update Data Regularly
Enter actual and target numbers every month without delay.
Use Clear KPI Names
Simple names help all departments understand the metrics easily.
Train Teams on KPI Meaning
Use the KPI Definition sheet to explain how each indicator works.
Track Both MTD and YTD
This gives a complete view of monthly and yearly growth.
Review Trend Charts Weekly
This helps identify slowdowns early.
Compare Against Targets Daily
Daily reviews improve accuracy and performance.
Use Conditional Formatting Indicators
Up and down arrows show improvement or decline instantly.
Customize KPIs When Needed
Add or remove KPIs based on business changes.
Conclusion
The Floriculture KPI Dashboard in Excel provides complete clarity into cultivation performance, quality standards, financial results, and operational activities. It transforms raw data into insights that support better decisions and more consistent results. Because it includes structured worksheets, dropdowns, trend charts, and comparisons, every team—from greenhouse staff to management—can work smarter every day.
This dashboard makes floriculture management simple, visual, and data-driven.
Frequently Asked Questions (FAQs)
- What KPIs should I track in floriculture?
You should track flowering rate, production quantity, wastage, quality score, irrigation efficiency, labour productivity, sales revenue, and delivery performance.
- Do I need advanced Excel skills to use this dashboard?
No. You can use this dashboard with basic Excel knowledge because everything is ready-to-use.
- Can I add more KPIs to the dashboard?
Yes. You can add unlimited KPIs by updating the KPI Definition sheet and data sheets.
- How often should I update the actual numbers?
You should update numbers every month. For better accuracy, update weekly.
- Can I customize the dashboard layout?
Yes, you can modify colors, charts, sheets, and KPIs based on your business needs.
Visit our YouTube channel to learn step-by-step video tutorials
Watch the step-by-step video tutorial:
Click to buy Floriculture KPI Dashboard in Excel