Healthcare organizations work in an environment where each day brings new challenges. Patient needs change fast, operations shift often, and teams must respond with accuracy. Because of this active and sensitive healthcare ecosystem, leaders need clear data, fast insights, and reliable performance tracking. A Healthcare Services KPI Dashboard in Power BI helps teams do all of this easily. It turns raw healthcare data into meaningful visuals so decision-makers improve quality, speed, and outcomes.
This complete guide explains the value of this dashboard, how each page works, why healthcare teams rely on it, and how you can use it to bring more clarity to your operations. You will learn every feature, practical use case, advantages, best practices, and answers to common questions.
Click to buy Healthcare Services KPI Dashboard in Power BI
What Is a Healthcare Services KPI Dashboard in Power BI?
A Healthcare Services KPI Dashboard in Power BI is a ready-to-use reporting system that shows the performance of important healthcare indicators (KPIs). It helps hospitals, clinics, labs, diagnostic centers, and healthcare service providers monitor their monthly and yearly trends in a simple and visual way.
The dashboard brings all KPIs into one place. It uses an Excel file as a data source, so you update numbers without technical knowledge. Teams track MTD (Month-to-Date), YTD (Year-to-Date), Current Year vs Previous Year comparisons, performance icons, target achievements, and historical patterns.
Because Power BI updates all visuals instantly, teams save time, reduce errors, and improve decisions.
Why Do Healthcare Teams Need This Dashboard?
Healthcare operations involve many moving parts. Patient care quality, staff productivity, turnaround time, equipment usage, cleanliness, patient feedback, and cost control all matter. Without a structured dashboard, teams struggle to see what works and what needs improvement.
This dashboard solves those problems. It gives leaders:
- Real-time data insights
- Fast monitoring of key KPIs
- Clear comparison between current and past performance
- Target tracking for MTD and YTD
- Better planning and resource utilization
- More consistent decision-making
As a result, healthcare teams improve outcomes, customer satisfaction, cost efficiency, and daily service delivery.
Key Features of the Healthcare Services KPI Dashboard in Power BI
This ready-to-use dashboard includes three main pages, each designed for clarity, speed, and better analysis.
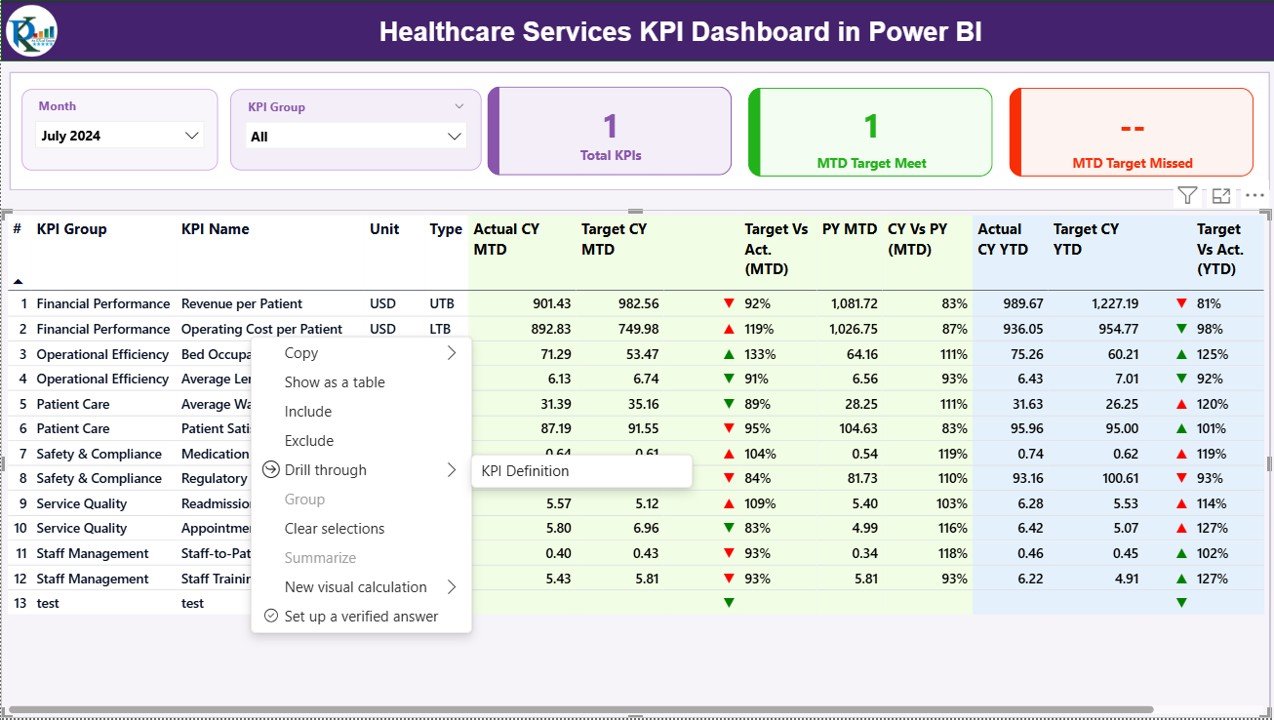
- Summary Page – What Does It Show?
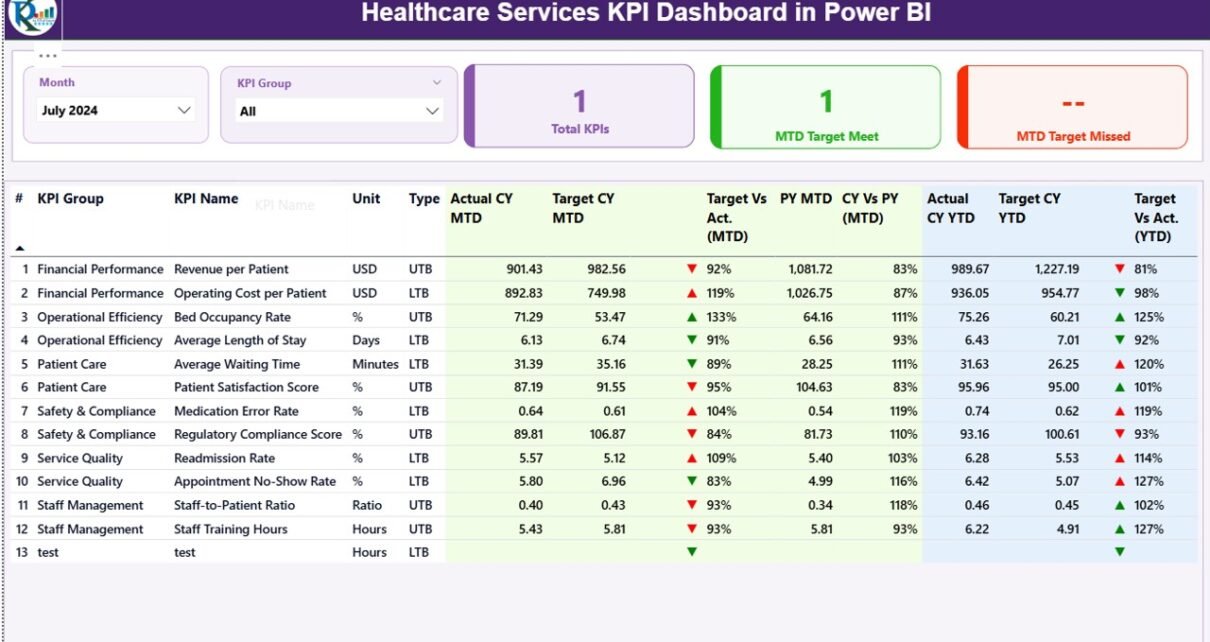
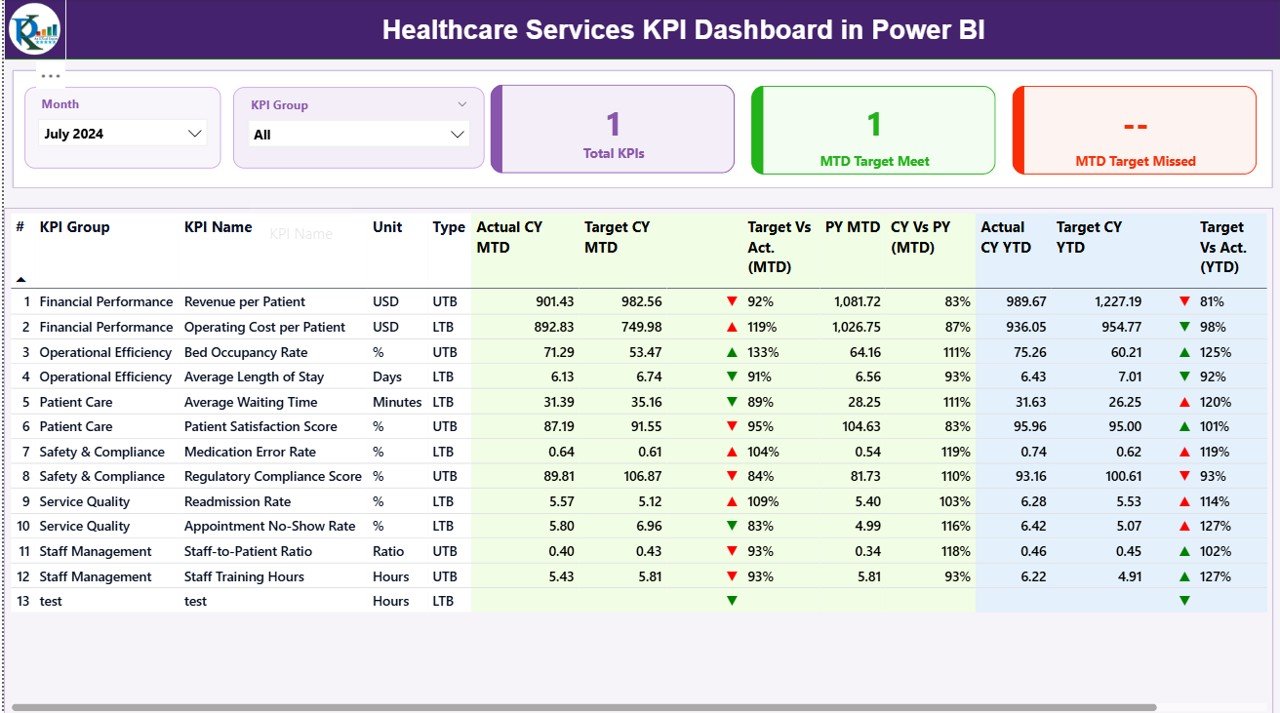
The Summary Page gives a complete view of all KPIs. It works like a report card that shows your overall performance within seconds.
Top-Level Features
- Month Slicer: Choose any month and instantly update all visuals.
- KPI Group Slicer: Filter KPIs based on category or department.
- 3 Performance Cards:
- Total KPIs Count
- MTD Target Met
- MTD Target Missed
These cards show immediate performance status for the selected month.
Detailed KPI Table
This table includes important information:
- KPI Number
- KPI Group
- KPI Name
- Unit of Measurement
- Type (UTB = Upper the Better, LTB = Lower the Better)
- Actual CY MTD
- Target CY MTD
- MTD Icon (Up/Down Arrow with Red/Green Color)
- Target vs Actual (MTD %)
- PY MTD
- CY vs PY (MTD %)
- Actual CY YTD
- Target CY YTD
- YTD Icon
- Target vs Actual (YTD %)
- PY YTD
- CY vs PY (YTD %)
The arrows show whether you hit or missed your target for both MTD and YTD numbers.
This page helps leaders understand overall performance in one place and take quick action.
Click to buy Healthcare Services KPI Dashboard in Power BI
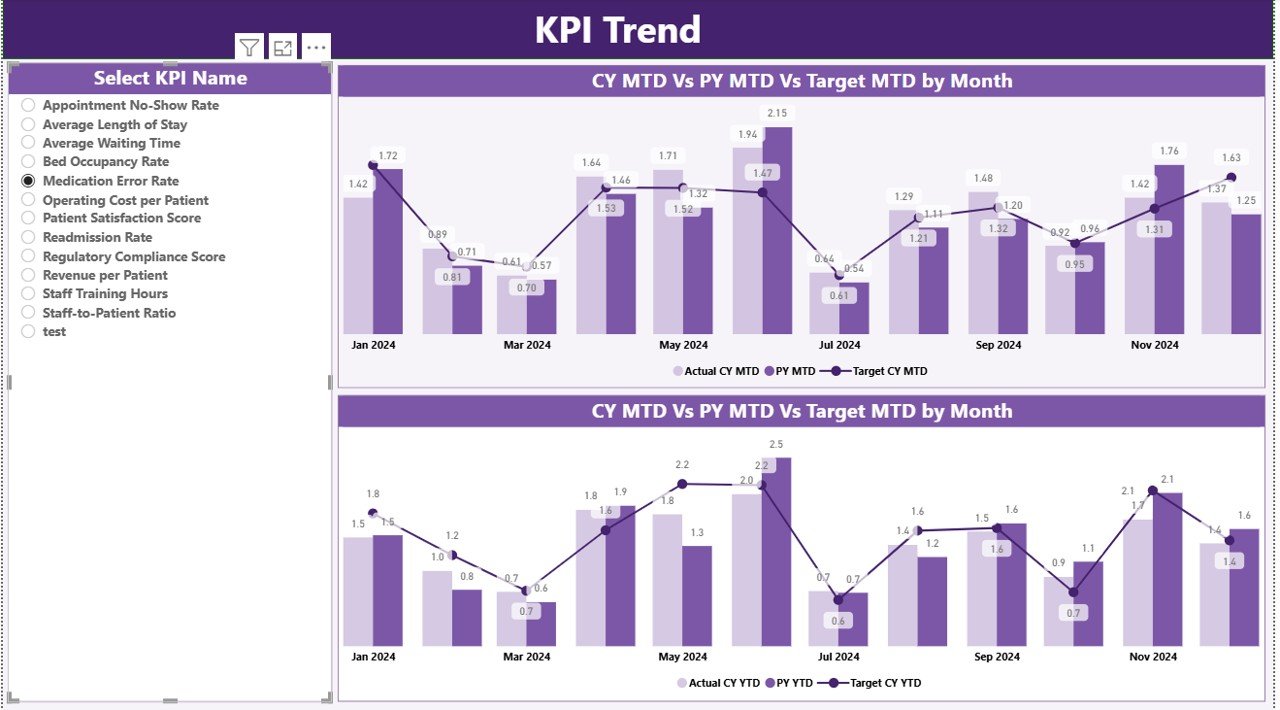
KPI Trend Page – How Does It Help?
The KPI Trend Page shows the monthly journey of each KPI. It includes two combo charts:
- Trend chart for MTD
- Trend chart for YTD
These charts compare:
- Current Year Actual
- Previous Year Actual
- Target
Slicer for KPI Name
Select any KPI from the slicer to view only its trend. This allows deeper analysis for each performance indicator.
This page helps teams identify patterns, seasonality, improvements, and sudden drops in performance.
Click to buy Healthcare Services KPI Dashboard in Power BI
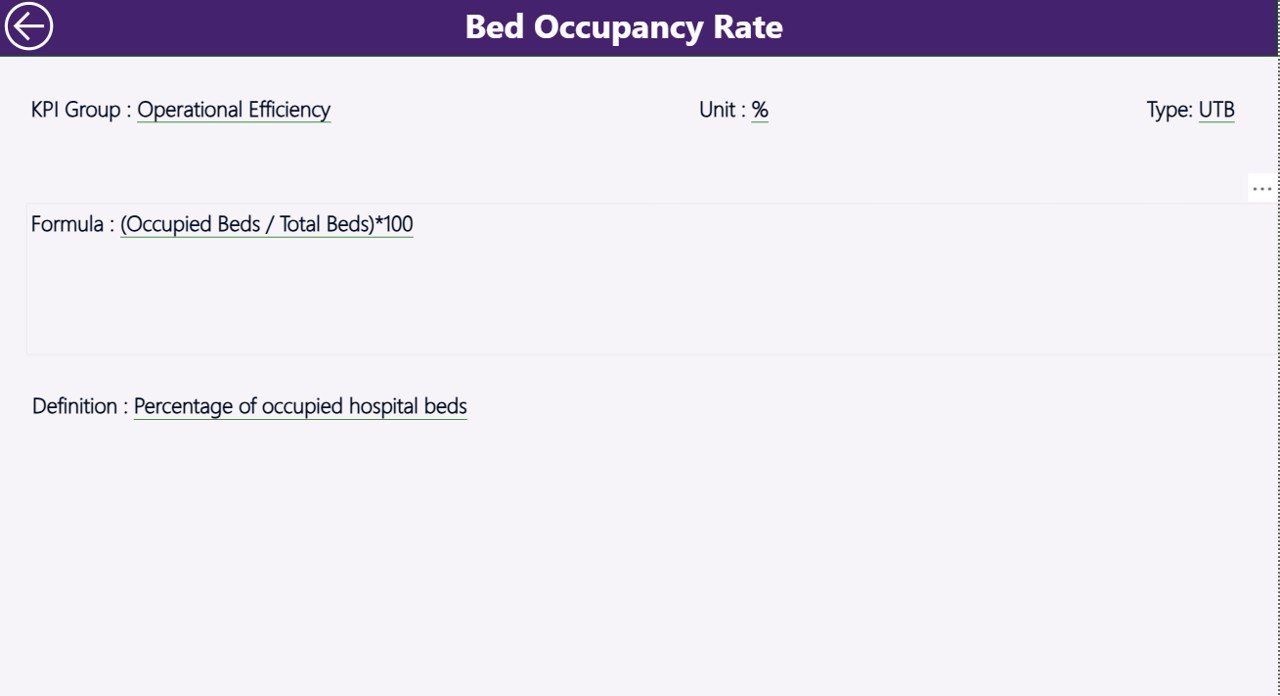
KPI Definition Page – Why Is It Important?
This is a hidden drill-through page. From the Summary Page, users right-click any KPI and open its definition page.
What Does It Show?
- KPI Number
- KPI Group
- KPI Name
- Unit
- Formula
- Definition
- Type (LTB or UTB)
This page helps new team members understand what each KPI means, how it is calculated, and why it matters.
You can return to the Summary Page using the Back button.
Click to buy Healthcare Services KPI Dashboard in Power BI
How Does the Excel Data Source Work?
The dashboard uses an Excel file with three worksheets:
Input_Actual Sheet
Fill:
- KPI Name
- Month (first date of each month)
- Actual MTD
- Actual YTD
This sheet captures your actual performance numbers.
Input_Target Sheet
Fill:
- KPI Name
- Month
- Target MTD
- Target YTD
This sheet supports goal-setting and target comparison.
KPI Definition Sheet
Fill:
- KPI Number
- KPI Group
- KPI Name
- Unit
- Formula
- Definition
- Type (LTB or UTB)
This sheet stores the structure and meaning of each KPI.
Click to buy Healthcare Services KPI Dashboard in Power BI
Why Should You Use a Healthcare KPI Dashboard in Power BI?
Healthcare operations generate a huge amount of data. But data only helps when you present it clearly. This dashboard turns data into insights that guide strong decisions.
Here are the top reasons:
- It simplifies complex data
- It reduces errors in manual reporting
- It saves time for doctors, managers, and administrators
- It gives an instant view of performance
- It improves patient care quality
- It supports faster decision-making
- It increases transparency across departments
Because Power BI refreshes visuals in seconds, the dashboard brings speed and accuracy to your reporting process.
What KPIs Can You Track in Healthcare Services?
You can customize the dashboard to track any type of KPI. Here are examples:
Clinical KPIs
- Patient satisfaction score
- Treatment cycle time
- Patient waiting time
- Readmission rate
- Diagnosis accuracy
Operational KPIs
- Bed occupancy rate
- Staff productivity
- Resource utilization
- Equipment downtime
- Cleaning and hygiene cycle
Financial KPIs
- Operating cost
- Revenue by department
- Claim processing time
- Billing accuracy
- Cost per patient
Safety KPIs
- Infection control rate
- Incident reports
- Compliance score
- Medication error rate
Power BI gives you flexibility to add, modify, and track any KPI important to your organization.
Advantages of the Healthcare Services KPI Dashboard in Power BI
Better Decision-Making
The dashboard shows real-time numbers, so leaders take decisions quickly and confidently.
mproved Patient Care
Clear performance insights help teams improve service quality and meet patient expectations.
Higher Accountability
Each KPI has a group, target, status, and performance trend that keeps every department responsible.
Faster Reporting
Manual reporting takes hours, but Power BI refreshes all visuals instantly.
Clear Trends and Patterns
You see changes month-by-month, so you adjust strategies before problems grow.
Easy for Anyone to Use
Even non-technical staff enter data in Excel and refresh the dashboard.
Supports Continuous Improvement
The dashboard highlights weak areas, so teams work on solutions consistently.
Best Practices for Using the Healthcare Services KPI Dashboard
Keep Your Data Clean
Use correct KPI names, correct dates, and accurate numbers.
Update Data Regularly
Enter data at the start of each month so visuals stay fresh.
Use Consistent Units
Always use the same measurement unit for each KPI.
Review Trend Page Monthly
Trends show real insights. Review them regularly for strategic actions.
Train Your Team
Explain KPI meaning, formulas, and target values to all team members.
Set Realistic Targets
Targets must match real capacity, resources, and patient volume.
Use the Drill-Through Page
The KPI Definition page helps new staff understand KPIs better.
Conclusion
The Healthcare Services KPI Dashboard in Power BI gives every healthcare team a powerful reporting tool. It helps hospitals, clinics, and service providers monitor their KPIs with clarity and accuracy. Because the dashboard uses simple Excel inputs, anyone updates it easily. Power BI then converts this data into clean visuals that help leaders plan better, improve performance, and deliver higher-quality patient care.
When you use this dashboard regularly, you gain deeper insight into operations and build stronger performance habits across departments.
Frequently Asked Questions (FAQs)
- Who can use a Healthcare Services KPI Dashboard in Power BI?
Hospitals, clinics, diagnostic centers, labs, nursing homes, and healthcare service providers can use it.
- Do I need technical skills to manage the dashboard?
No. You enter data in Excel and refresh the Power BI file.
- Can I add my own KPIs?
Yes. You update the KPI Definition sheet and modify visuals as needed.
- Does the dashboard show both MTD and YTD values?
Yes. It shows both values with icons and percentage comparisons.
- Can I compare current performance with previous year?
Yes. The dashboard includes CY vs PY metrics for both MTD and YTD.
- Can multiple departments use the dashboard?
Yes. KPI Group filters help each department focus on its own metrics.
- Does the dashboard work with large data?
Yes. Power BI handles large datasets smoothly.
- Can I export visuals from the dashboard?
Yes. You can export visuals to PDF, PNG, or PowerPoint.
- How often should I update the data?
Update data monthly or weekly based on your reporting needs.
- Can I share the dashboard with my team?
Yes. You can publish it to Power BI Service and share access.
Visit our YouTube channel to learn step-by-step video tutorials
Watch the step-by-step video tutorial:
Click to buy Healthcare Services KPI Dashboard in Power BI