In today’s hospitality industry, data is the new competitive advantage. From guest satisfaction to occupancy rate, every number tells a story. Managing all these metrics across departments can be overwhelming, especially when you depend on manual reports. That’s where the Hospitality & Resorts KPI Dashboard in Excel comes to the rescue.
This ready-to-use Excel dashboard helps hoteliers, resort owners, and hospitality managers track, measure, and analyze key performance indicators (KPIs) with clarity and precision. It transforms raw data into meaningful insights that guide better decisions and boost profitability.
Let’s explore everything about this powerful Excel dashboard — including its structure, features, advantages, best practices, and answers to the most common questions.
Click to buy Hospitality & Resorts KPI Dashboard in Excel
What Is a Hospitality & Resorts KPI Dashboard in Excel?
A Hospitality & Resorts KPI Dashboard in Excel is a data visualization and performance-management tool that allows you to monitor all the crucial KPIs related to your hotel or resort operations.
Instead of juggling multiple spreadsheets, this dashboard brings everything into one structured Excel file. It includes automated calculations, dynamic charts, trend tracking, and conditional formatting to highlight performance gaps instantly.
You can view both Month-to-Date (MTD) and Year-to-Date (YTD) performance, compare results with previous years, and track how your hotel or resort performs against defined targets.
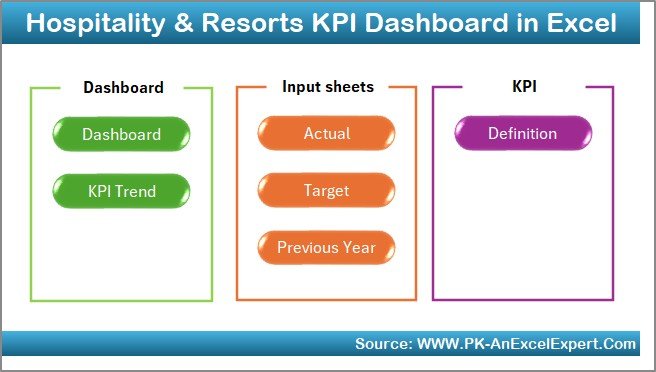
Summary Page
The Summary Page acts as your home screen or index sheet.
It contains six navigation buttons that allow you to jump directly to any other worksheet — such as the Dashboard, Trend, or Input sheets.
This design helps users move quickly through different sections without scrolling or searching manually.
The Summary Page provides an instant overview and improves usability, especially when you manage multiple properties or KPI categories.
Click to buy Hospitality & Resorts KPI Dashboard in Excel
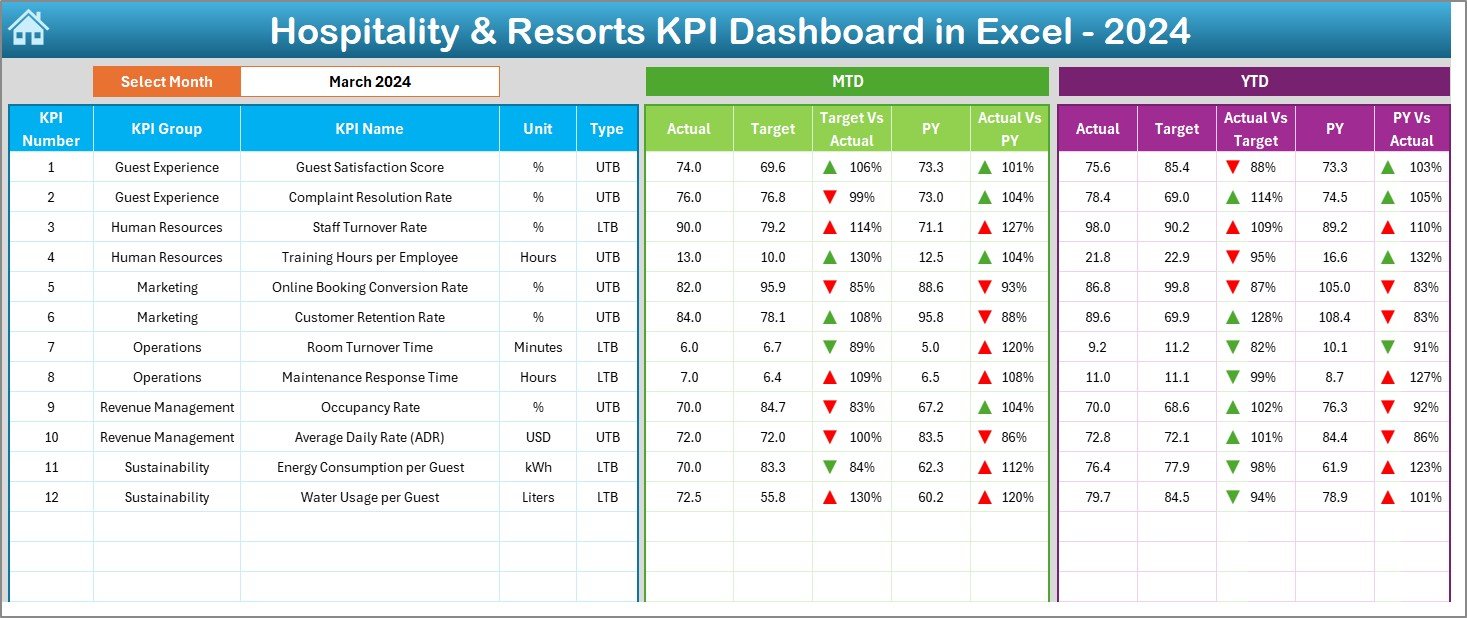
Dashboard Sheet Tab
The Dashboard Sheet is the main command center of the file — where all your KPIs come alive through charts, cards, and comparisons.
Here’s what makes it special:
- You can select a Month from a drop-down menu in cell D3. As soon as you choose the month, all metrics automatically update across the dashboard.
- The dashboard shows MTD Actual, Target, and Previous Year data side by side.
- It also includes Target vs Actual and Previous Year vs Actual comparisons, clearly marked with up and down arrows to indicate performance improvement or decline.
- You can track both MTD and YTD progress for each KPI using color-coded conditional formatting.
This sheet gives you a clear, visual picture of how well your hospitality operations are performing in real time.
Click to buy Hospitality & Resorts KPI Dashboard in Excel
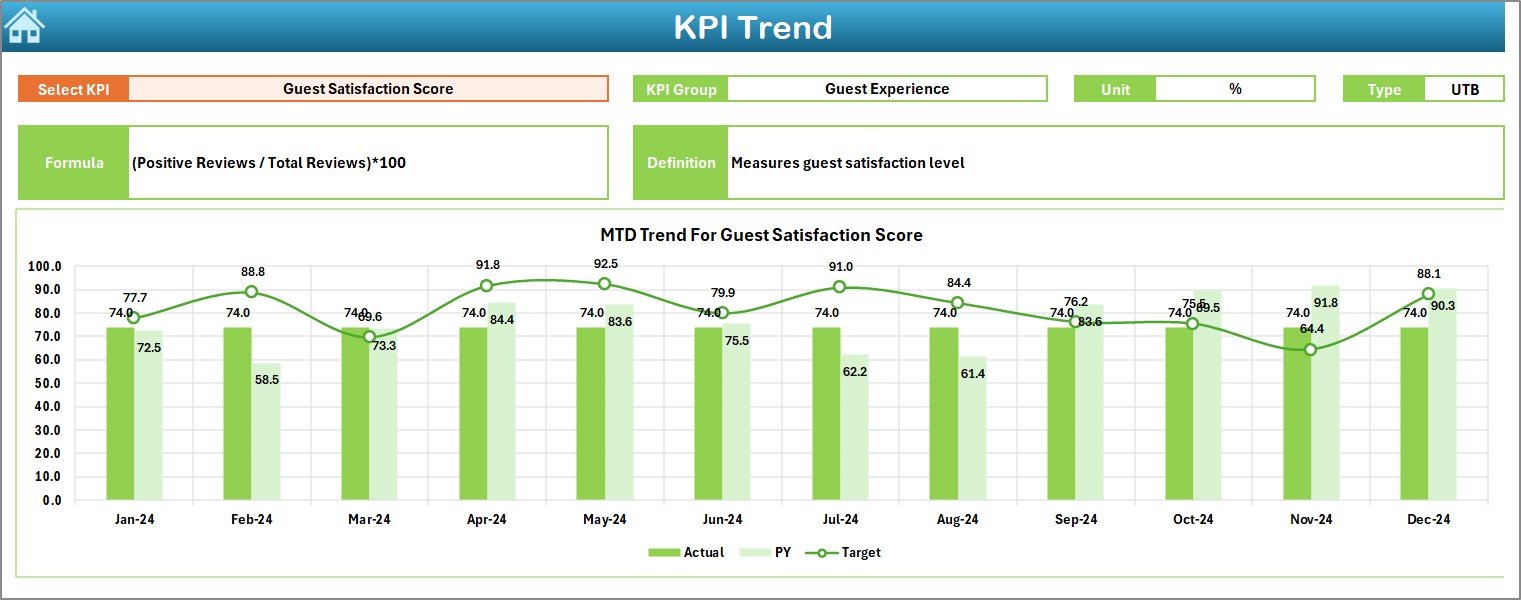
Trend Sheet Tab
The Trend Sheet adds a deeper layer of analysis.
- You can select any KPI Name from the drop-down list in cell C3.
- Once selected, it displays the KPI Group, Unit of Measurement, KPI Type (UTB or LTB), Formula, and Definition for that KPI.
- The sheet also provides MTD and YTD trend charts that show how the KPI values have changed across months — for Actual, Target, and Previous Year data.
This feature is essential for identifying seasonal patterns, performance fluctuations, and long-term improvements.
Click to buy Hospitality & Resorts KPI Dashboard in Excel
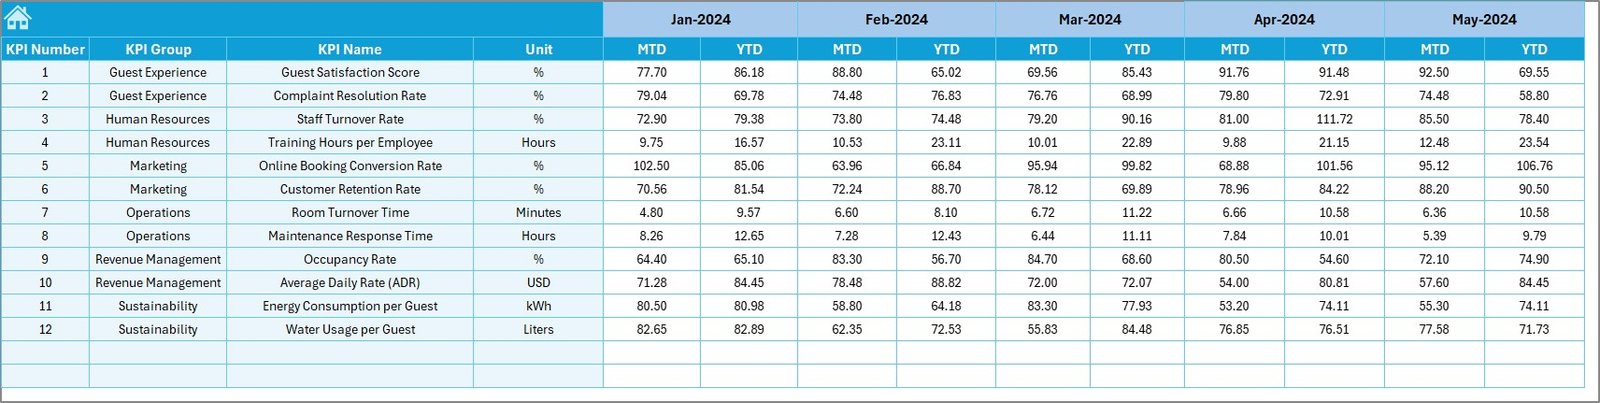
Actual Numbers Input Sheet
The Actual Numbers Input Sheet is the data-entry area for your real-world performance numbers.
- You enter actual MTD and YTD values for each KPI.
- The month can be changed from cell E1, where you input the first month of the year.
- Once entered, these numbers automatically feed into the dashboard and trend visuals.
This sheet ensures that your dashboard remains accurate and current throughout the year.
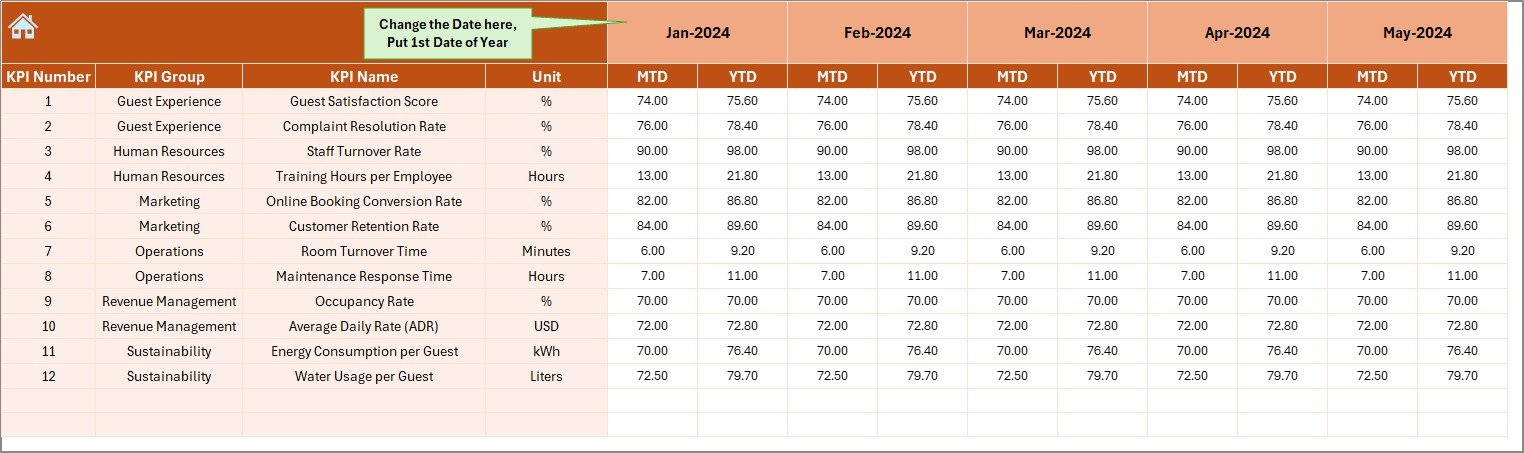
Target Sheet Tab
In this section, you can define your target values for every KPI.
- Each KPI includes both MTD and YTD target numbers for each month.
- Setting targets helps compare actual performance against expectations.
- With the dashboard’s built-in formulas, you can easily see where you’re meeting goals and where improvement is needed.
The target sheet acts as your roadmap for success, giving every department a clear benchmark to achieve.
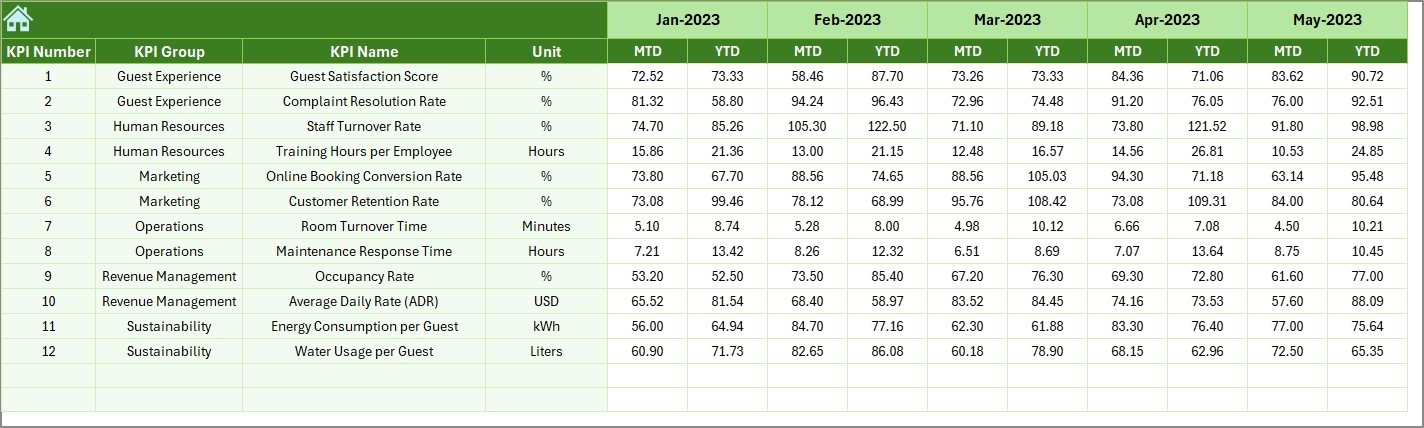
Previous Year Number Sheet Tab
To track growth effectively, you need context — and that’s where this sheet comes in.
- Here, you input the Previous Year’s data in the same structure as the current year.
- The dashboard then uses this data to calculate Year-over-Year (YoY) performance changes.
By comparing current performance with historical numbers, you can easily spot trends, set realistic expectations, and showcase progress to management or investors.
Click to buy Hospitality & Resorts KPI Dashboard in Excel
KPI Definition Sheet Tab
Clarity begins with well-defined KPIs. This sheet is your KPI dictionary.
Each KPI entry includes:
- KPI Name
- KPI Group (like Occupancy, Revenue, Operations, or Customer Service)
- Unit (percentage, USD, number of guests, etc.)
- Formula (a short, simple version)
- Definition (what the KPI measures and how it helps decision-making)
- Type (LTB – Lower the Better, UTB – Upper the Better)
This structure ensures transparency and consistency across all stakeholders. Everyone understands what each KPI represents and how it’s calculated.
Why Every Hotel or Resort Needs This Dashboard
In hospitality, hundreds of decisions happen daily — from pricing to staffing to guest service. Without proper data visibility, you’re simply guessing.
The Hospitality & Resorts KPI Dashboard in Excel offers several benefits that make it indispensable for modern hospitality management.
Advantages of Hospitality & Resorts KPI Dashboard in Excel
Centralized Data Management
All your KPIs, from occupancy to customer satisfaction, live in one unified file. This eliminates the need to jump between different spreadsheets or systems.
Instant Performance Insights
The dashboard updates automatically based on your selected month, giving you real-time insights without manual recalculations.
Better Decision-Making
By visualizing trends and comparing targets vs. actuals, managers can make data-driven decisions that reduce costs and boost profits.
Enhanced Accountability
Each department can clearly see its performance against defined targets. This transparency encourages responsibility and continuous improvement.
Time and Cost Efficiency
Manual reporting consumes time and leads to errors. With this automated Excel dashboard, you spend less time gathering data and more time acting on it.
Customizable and Scalable
The template is fully editable. You can add KPIs, modify formulas, or adjust charts based on your property’s specific requirements.
Visual Storytelling with Conditional Formatting
The use of color-coded arrows and highlights helps interpret performance instantly — no need to dig through numbers.
Year-over-Year Comparisons
Track growth, identify seasonal trends, and benchmark success with built-in comparisons to previous years.
How the Dashboard Improves Hospitality Operations
Let’s break down how each section supports your hotel’s operational excellence.
Operations and Front Office
Track occupancy rates, average check-in times, and customer wait durations to improve guest experience.
Finance and Revenue Management
Monitor RevPAR, ADR, and cost per room to optimize profitability.
Food & Beverage Department
Measure restaurant revenue per guest, table turnover rate, and menu profitability.
Housekeeping
Analyze cleaning turnaround times and maintenance response rates.
Marketing and Sales
Evaluate campaign performance using metrics like booking conversion rate and repeat customer percentage.
Customer Satisfaction
Monitor Net Promoter Score (NPS), complaint resolution rate, and online review ratings.
Each of these areas benefits from real-time insights that lead to faster, smarter decisions.
How to Use the Dashboard Effectively
Follow these steps to get the most out of your Hospitality & Resorts KPI Dashboard in Excel:
- Input KPI Definitions – Start by listing all KPIs in the KPI Definition Sheet.
- Set Monthly Targets – Enter realistic monthly targets for each KPI in the Target Sheet.
- Record Actual Data – Update your Actual Numbers sheet regularly.
- Enter Previous Year Data – Add the past year’s data to the Previous Year sheet for comparison.
- Review the Dashboard – Go to the Dashboard sheet and analyze MTD and YTD results.
- Study Trends – Use the Trend Sheet to identify areas needing attention.
- Take Action – Apply insights to adjust operations, marketing, or service strategies.
With this routine, you maintain a clear performance snapshot month after month.
Best Practices for the Hospitality & Resorts KPI Dashboard in Excel
To ensure you get the best results, apply these tried-and-tested best practices:
Keep KPI Definitions Consistent
Use clear, simple formulas and avoid unnecessary complexity. Everyone should understand what each KPI means.
Update Data Regularly
Enter actual and target data every month without fail. Consistency ensures accuracy.
Use Color Coding Wisely
Stick to universal colors — green for good, red for poor performance — to make insights easy to grasp.
Protect Key Formulas
Lock formula cells and protect sheets to prevent accidental edits.
Review Trends Monthly
Analyze both MTD and YTD trends to catch potential issues early.
Integrate Feedback
Encourage department heads to review and comment on their KPI performance for collaborative improvement.
Automate Where Possible
Use Excel’s features like Data Validation, Conditional Formatting, and Named Ranges to automate repetitive tasks.
Keep Historical Data
Maintain at least 2–3 years of data in the file for long-term performance comparison.
Visualize Key Insights
Use pivot charts and conditional icons to make your report visually engaging and easy to interpret.
Back Up Regularly
Store copies of your dashboard in cloud storage (like OneDrive or Google Drive) for safety and easy access.
Conclusion
The Hospitality & Resorts KPI Dashboard in Excel isn’t just a reporting tool — it’s a strategic asset.
It gives hospitality professionals the visibility they need to optimize operations, improve guest satisfaction, and maximize profits.
By tracking both MTD and YTD performance, comparing targets, and visualizing trends, this dashboard turns complex data into actionable insights. Whether you manage a single resort or a chain of properties, it keeps you informed, efficient, and ahead of the competition.
With its intuitive structure, clear definitions, and automated design, this dashboard becomes an essential part of modern hospitality management.
Frequently Asked Questions (FAQs)
What is the main purpose of a Hospitality & Resorts KPI Dashboard in Excel?
It helps hotels and resorts track and analyze operational and financial performance metrics such as occupancy, revenue, guest satisfaction, and cost efficiency in one organized platform.
Can I customize the dashboard according to my property’s needs?
Yes. The dashboard is fully editable — you can add or remove KPIs, adjust visuals, or change the color theme to match your brand identity.
How often should I update the data?
Ideally, update the Actual and Target data every month. However, some hotels prefer weekly updates for faster decision-making.
Does this dashboard support multiple properties?
Yes. You can add an additional column for property names and create filters to compare different hotels or resorts in the same file.
What Excel skills are needed to use this dashboard?
Only basic Excel knowledge is required. Everything is automated — you simply enter your data, and the dashboard updates itself.
How does the conditional formatting help?
Color-coded arrows and highlights instantly show whether KPIs are meeting or missing targets. This visual feedback saves time during reviews.
Can I use this dashboard for presentations?
Absolutely. You can export summary charts or screenshots directly into PowerPoint or PDF for management reports.
Is it possible to integrate this dashboard with other systems?
Yes, you can link it with external data sources like CSV exports or property-management systems (PMS) for semi-automated data updates.
What makes this dashboard better than traditional reports?
Unlike static reports, it’s interactive, visual, and automated — providing real-time insights and reducing manual errors.
Where can I get this dashboard template?
You can download the Hospitality & Resorts KPI Dashboard in Excel from NextGenTemplates.com, where you’ll also find demo videos and related dashboard templates.
Visit our YouTube channel to learn step-by-step video tutorials
Watch the step-by-step video tutorial:
Click to buy Hospitality & Resorts KPI Dashboard in Excel