In today’s fast-moving world of broadcasting, journalism, and digital content, media organizations must measure their performance effectively. Ratings, engagement, ad revenue, and production efficiency all play a crucial role in determining success. However, tracking these metrics across multiple platforms can quickly become overwhelming.
That’s where the Mass Media KPI Scorecard in Excel steps in. This easy-to-use and data-driven tool allows media professionals to measure key performance indicators (KPIs), compare results with targets, and visualize progress in real time — all within the familiar environment of Microsoft Excel.
In this detailed blog post, we’ll explore everything you need to know about the Mass Media KPI Scorecard in Excel — including its structure, features, advantages, best practices, and frequently asked questions.
Click to buy Mass Media KPI Scorecard in Excel
What Is a Mass Media KPI Scorecard in Excel?
A Mass Media KPI Scorecard in Excel is an interactive performance management template designed to help media organizations track their operational and strategic KPIs. It consolidates data from different departments — such as advertising, production, audience analytics, and content distribution — into a single, centralized dashboard.
This scorecard lets you:
- Monitor Month-to-Date (MTD) and Year-to-Date (YTD) performance.
- Compare Actual vs Target values for each KPI.
- Identify underperforming areas using visual color indicators.
- Analyze trends using line and bar charts.
By simplifying KPI tracking, this tool helps editors, marketing teams, and media executives make informed decisions based on data rather than guesswork.
Why Media Companies Need KPI Scorecards
Media organizations deal with diverse datasets — from viewership metrics and social media reach to ad conversions and production costs. Without a structured dashboard, these metrics remain scattered and difficult to interpret.
A KPI Scorecard in Excel helps you:
- Unify performance data from multiple channels.
- Visualize audience trends and engagement levels.
- Track revenue performance against targets.
- Enhance accountability across teams.
- Improve decision-making speed through real-time analytics.
Structure of the Mass Media KPI Scorecard
The Mass Media KPI Scorecard template consists of four key worksheets, each serving a specific purpose. Let’s take a closer look at how each sheet functions.
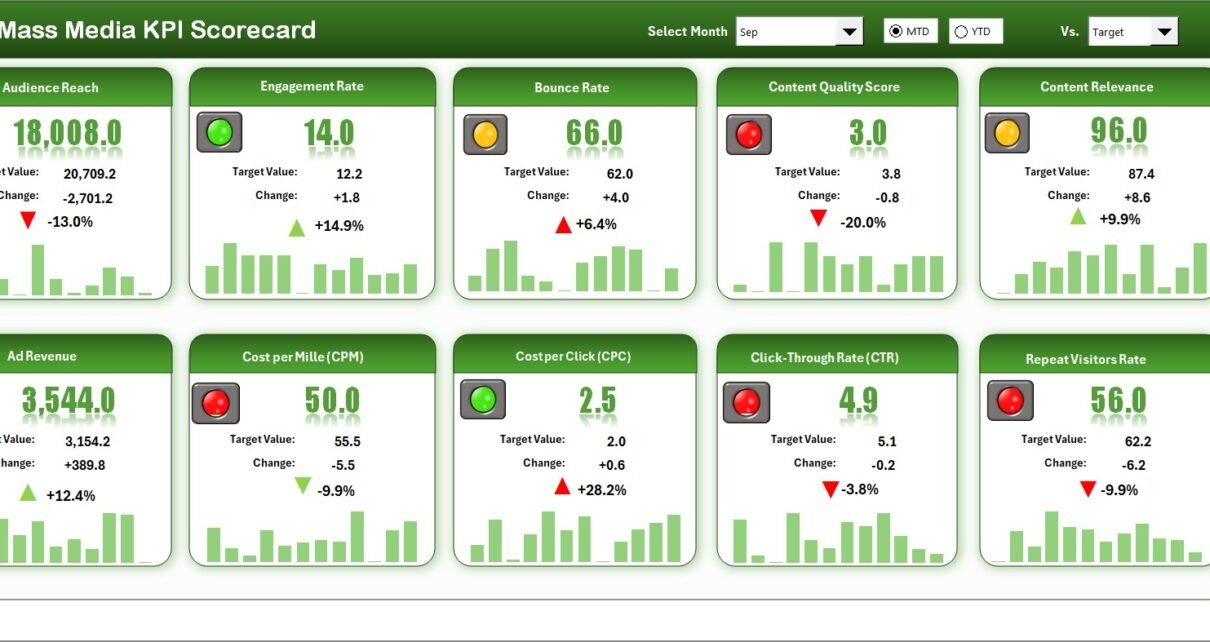
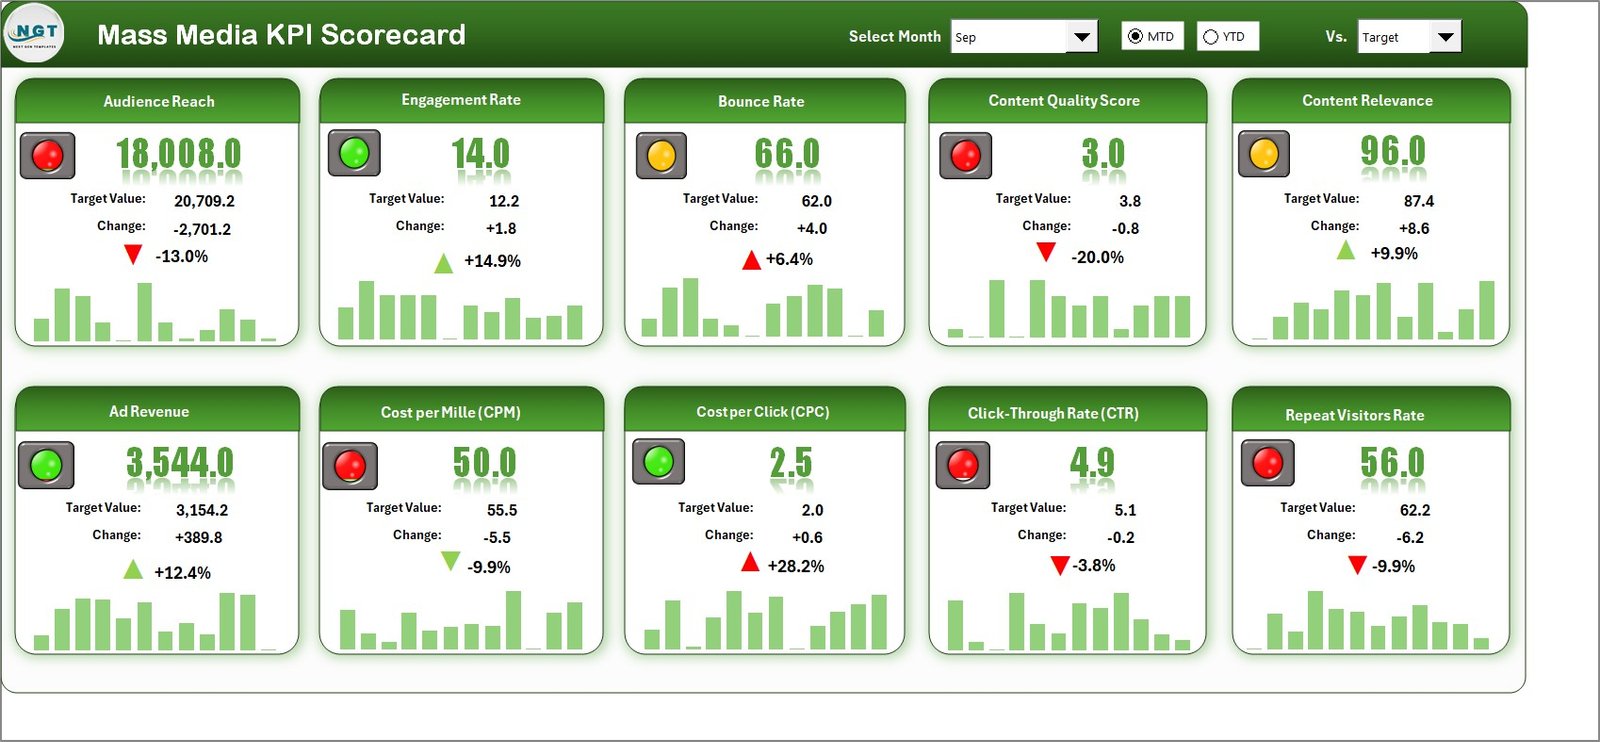
Scorecard Sheet — The Performance Dashboard
The Scorecard Sheet acts as the main interface where you can view KPI performance at a glance.
Key Features:
- Dropdown Menus: Choose the month and view either MTD or YTD results instantly.
- Actual vs Target Comparison: Each KPI displays both its target and actual values for better insight.
- Visual Indicators: Conditional formatting shows red, green, or yellow icons based on performance.
- Comprehensive KPI Overview: All critical metrics appear in one consolidated view — typically 10 KPIs per screen.
- Interactive Filters: You can filter by department, region, or content type for deeper insights.
This sheet gives a bird’s-eye view of overall media performance, helping managers identify which metrics are meeting targets and which need attention.
Click to buy Mass Media KPI Scorecard in Excel
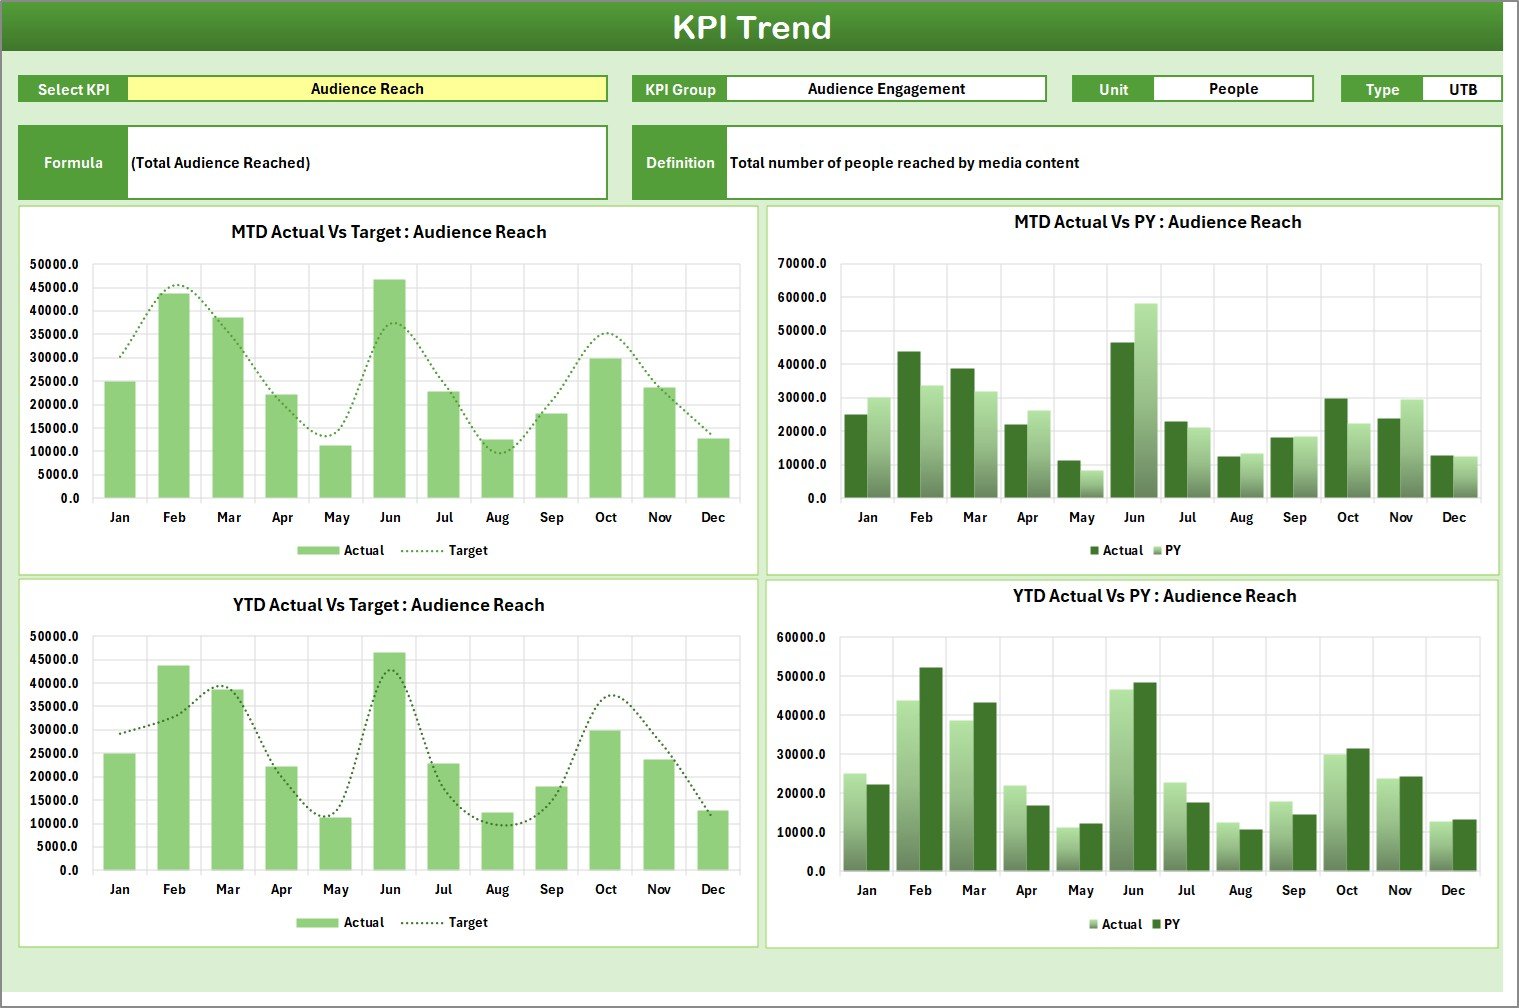
KPI Trend Sheet — Understanding Performance Over Time
The KPI Trend Sheet focuses on tracking changes and patterns.
Main Functions:
- Dropdown in cell C3 to select a specific KPI.
- Automatically shows:
- KPI Group
- Unit of Measurement
- Type (UTB or LTB) — Upper the Better or Lower the Better
- Formula
- Definition
- Dynamic charts illustrate the MTD and YTD trends for Actual, Target, and Previous Year (PY) values.
This page transforms data into visual stories, showing whether a KPI is improving, stagnating, or declining over time.
Click to buy Mass Media KPI Scorecard in Excel
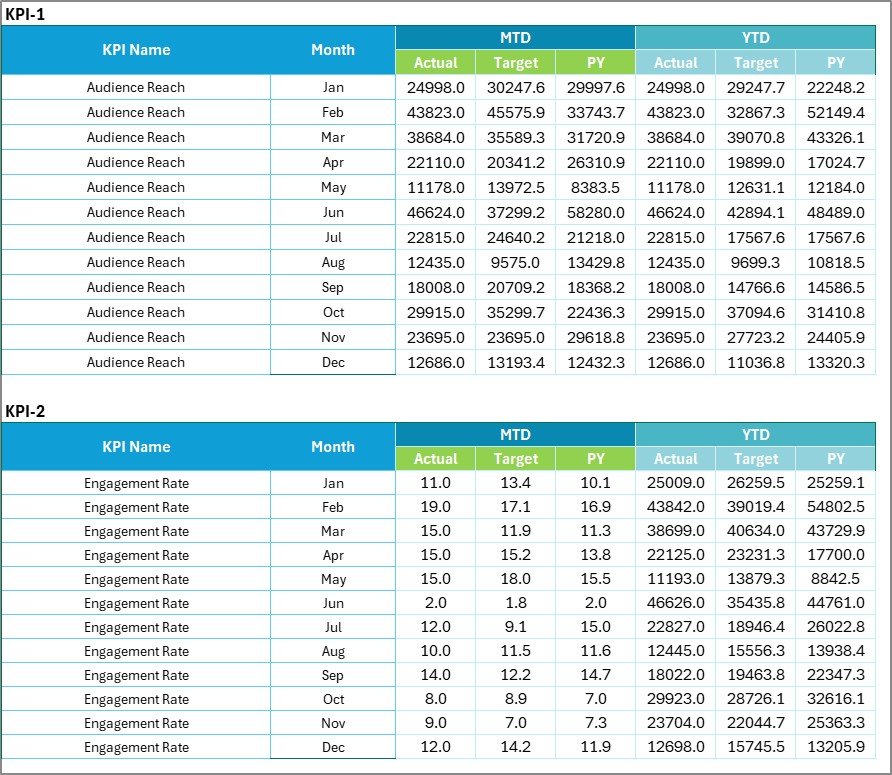
Input Data Sheet — Where Raw Data Lives
The Input Data Sheet is the backbone of the scorecard.
Key Functions:
- Data Entry: Input actual values, targets, and PY metrics for every KPI.
- Flexibility: Update data whenever new results are available.
- Data Consistency: The sheet auto-feeds the dashboard and trend pages to ensure accurate analysis.
With clean data entry, you can maintain accuracy across all reports without manual recalculation.
Click to buy Mass Media KPI Scorecard in Excel
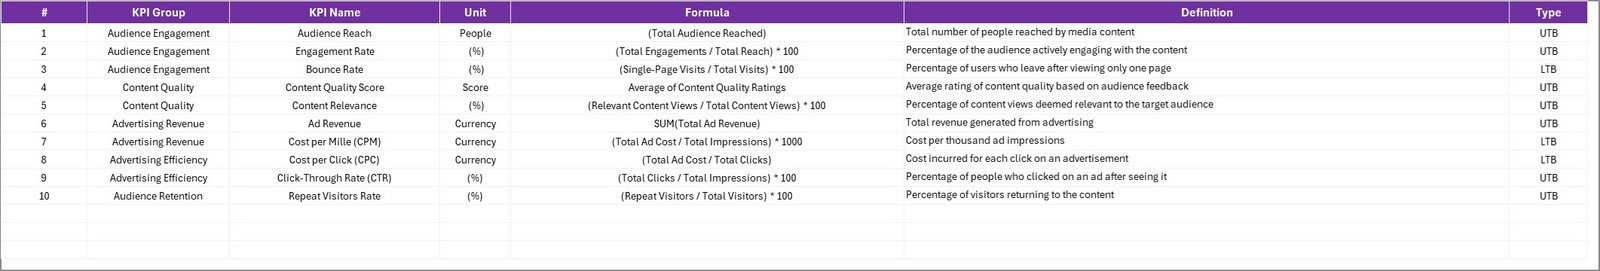
KPI Definition Sheet — The Reference Library
This sheet works as a master reference for all KPIs used in your media operations.
Includes Columns For:
- KPI Name
- KPI Group
- Unit
- Formula
- Definition
- Type (UTB / LTB)
This ensures every stakeholder understands what each KPI measures and how it is calculated — promoting transparency and consistency across departments.
Click to buy Mass Media KPI Scorecard in Excel
Advantages of Mass Media KPI Scorecard in Excel
Using an Excel-based scorecard offers numerous benefits:
Easy to Customize
You can tailor KPIs, formulas, and visuals to suit your organization’s specific needs — whether you’re tracking a TV network, radio station, or digital media house.
Cost-Effective Solution
Unlike expensive BI tools, Excel requires no extra software or licenses. It provides enterprise-grade analytics using standard spreadsheet features.
Interactive and Visual
The dashboard’s conditional formatting and chart features make performance tracking more intuitive and engaging.
Real-Time Data Updates
As you update the input data, the dashboard instantly recalculates and refreshes visuals for accurate insights.
Encourages Data-Driven Culture
Everyone — from journalists to executives — can use data to evaluate outcomes and plan future actions.
How to Use the Mass Media KPI Scorecard
Here’s a simple step-by-step guide:
- Go to the Input Data Sheet. Enter all the monthly data for each KPI.
- Review the KPI Definition Sheet. Ensure all KPIs have correct formulas and units.
- Navigate to the Scorecard Sheet. Use the dropdown to select MTD or YTD view.
- Analyze Results. Look for red or yellow indicators to find improvement areas.
- Switch to the Trend Sheet. Examine how each KPI evolves over time.
- Adjust Strategies. Use insights to improve content quality, reduce costs, or boost engagement.
Opportunities for Improvement in Media KPI Tracking
Even with an efficient scorecard, there’s always room to improve performance tracking. Here are a few suggestions:
- Automate Data Import: Connect Excel to online analytics sources like Google Analytics or YouTube Studio.
- Standardize KPI Definitions: Ensure all teams use identical formulas for accuracy.
- Use Consistent Time Periods: Compare results across equal monthly or quarterly periods.
- Enhance Visualization: Add sparklines and conditional icons for faster pattern recognition.
- Include Benchmark Data: Compare internal results with industry standards to gauge competitiveness.
Best Practices for the Mass Media KPI Scorecard
To get the most out of your scorecard, follow these proven best practices:
Keep KPIs SMART
Each KPI should be Specific, Measurable, Achievable, Relevant, and Time-bound.
Update Data Regularly
Refresh your dataset at least once a month to maintain relevance and accuracy.
Use Color Logic Consistently
Green for “On Track,” Yellow for “Needs Attention,” and Red for “Underperforming.”
Maintain One Version of Truth
Ensure all departments access the same Excel file or cloud-shared version to prevent confusion.
Review and Refine KPIs
Regularly audit your KPIs to ensure they align with evolving business goals.
Add Interactivity
Use slicers, dropdowns, and filters to make the dashboard dynamic and user-friendly.
How Mass Media KPI Scorecards Drive Better Decisions
When you use Excel to track KPIs effectively, your organization gains several strategic advantages:
- Data Transparency: Everyone understands what’s being measured.
- Faster Decision-Making: Managers can identify trends instantly.
- Operational Efficiency: Bottlenecks and inefficiencies become visible.
- Performance Accountability: Each department knows its targets and outcomes.
- Continuous Improvement: Data-driven reviews lead to steady growth and innovation.
Conclusion
The Mass Media KPI Scorecard in Excel is more than just a spreadsheet — it’s a decision-making powerhouse. It transforms data into actionable insights, allowing media professionals to measure, compare, and improve performance with ease.
By integrating KPIs from every part of your organization, you gain a clear picture of success and areas needing focus. Whether you’re managing ad revenue, audience growth, or production costs, this tool gives you the clarity you need to act confidently.
So, if you’re ready to make data your most powerful ally, start building or downloading your Mass Media KPI Scorecard in Excel today.
Frequently Asked Questions (FAQs)
- What is a KPI Scorecard in Excel?
A KPI Scorecard in Excel is a performance monitoring tool that tracks key business metrics. It compares actual results with targets and displays insights using charts and conditional formatting.
- Why should media organizations use Excel for KPI tracking?
Excel offers a flexible, affordable, and user-friendly environment for data tracking. It allows you to visualize complex metrics without needing specialized software.
- Can I customize the Mass Media KPI Scorecard?
Yes. You can easily modify KPI names, formulas, and visual styles to match your organizational needs.
- How often should I update the scorecard?
You should update the scorecard monthly or quarterly, depending on how frequently new data becomes available.
- What’s the difference between MTD and YTD analysis?
MTD (Month-to-Date) shows performance for the current month, while YTD (Year-to-Date) summarizes cumulative results for the entire year.
- Is the template suitable for both print and digital media companies?
Absolutely. The Mass Media KPI Scorecard is versatile and can be adapted for television, radio, digital platforms, or publishing houses.
- Can I integrate external data sources?
Yes. Advanced users can link Excel to APIs or analytics platforms like Google Analytics, YouTube Studio, or Salesforce for automated updates.
- What makes this KPI Scorecard unique?
Its simplicity, visual appeal, and practical design make it ideal for everyday business use. You don’t need coding or BI tools — just Excel skills.
Visit our YouTube channel to learn step-by-step video tutorials
Click to buy Mass Media KPI Scorecard in Excel