In the fast-evolving mining industry, operational efficiency and profitability depend heavily on data-driven decision-making. From production volume and equipment utilization to safety performance and environmental compliance, each metric contributes to the success of a mining operation.
However, managing and analyzing all these KPIs manually can be challenging and time-consuming. That’s where the Mining KPI Scorecard in Excel becomes an essential tool.
A well-structured KPI scorecard helps you monitor key performance indicators across different areas of mining—such as production, maintenance, health and safety, and cost efficiency. It allows managers to make informed decisions, identify trends, and take corrective actions before problems escalate.
This article explains everything you need to know about the Mining KPI Scorecard in Excel—its structure, key features, advantages, and best practices for effective implementation.Mining kip scorecard in Excel.
Click to buy Mining kip scorecard in Excel
What Is a Mining KPI Scorecard in Excel?
A Mining KPI Scorecard in Excel is a comprehensive, interactive dashboard designed to track and evaluate performance metrics within mining operations.
It consolidates multiple datasets into a single interface, giving users a clear visual overview of performance against targets.
The scorecard makes use of Excel’s built-in features like formulas, conditional formatting, and charts to display KPIs in an easy-to-understand format. Whether you’re analyzing production yield, downtime, or safety incidents, this scorecard provides real-time insights for better decision-making.
Structure of the Mining KPI Scorecard in Excel
The Mining KPI Scorecard template comes with four main worksheet tabs, each serving a unique purpose:
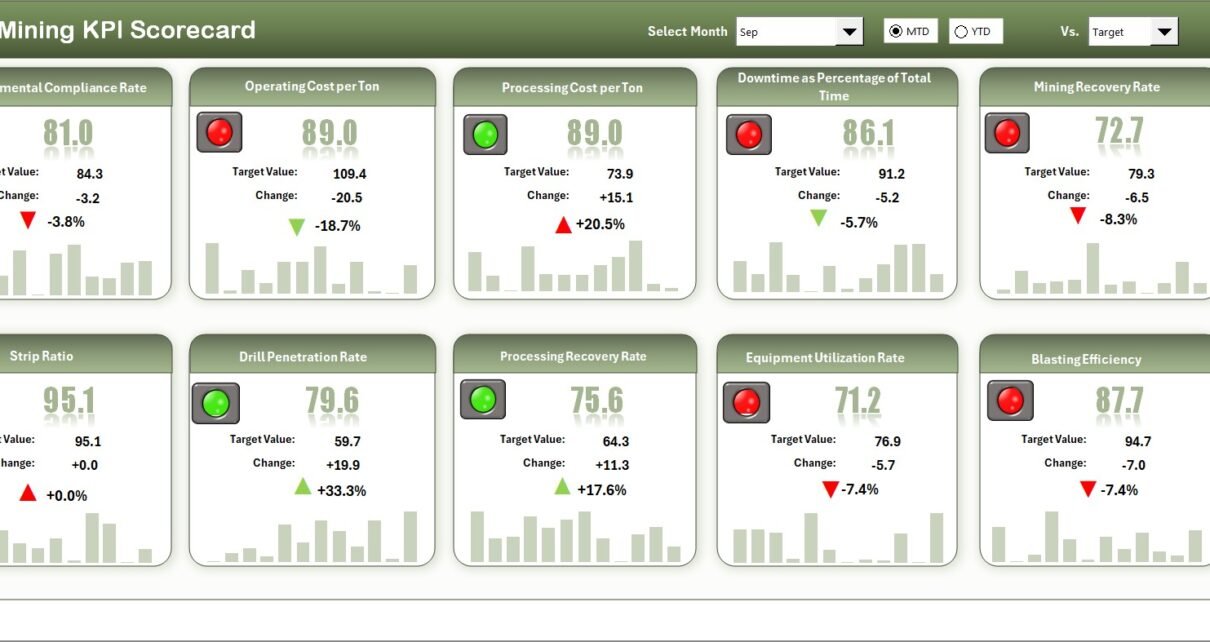
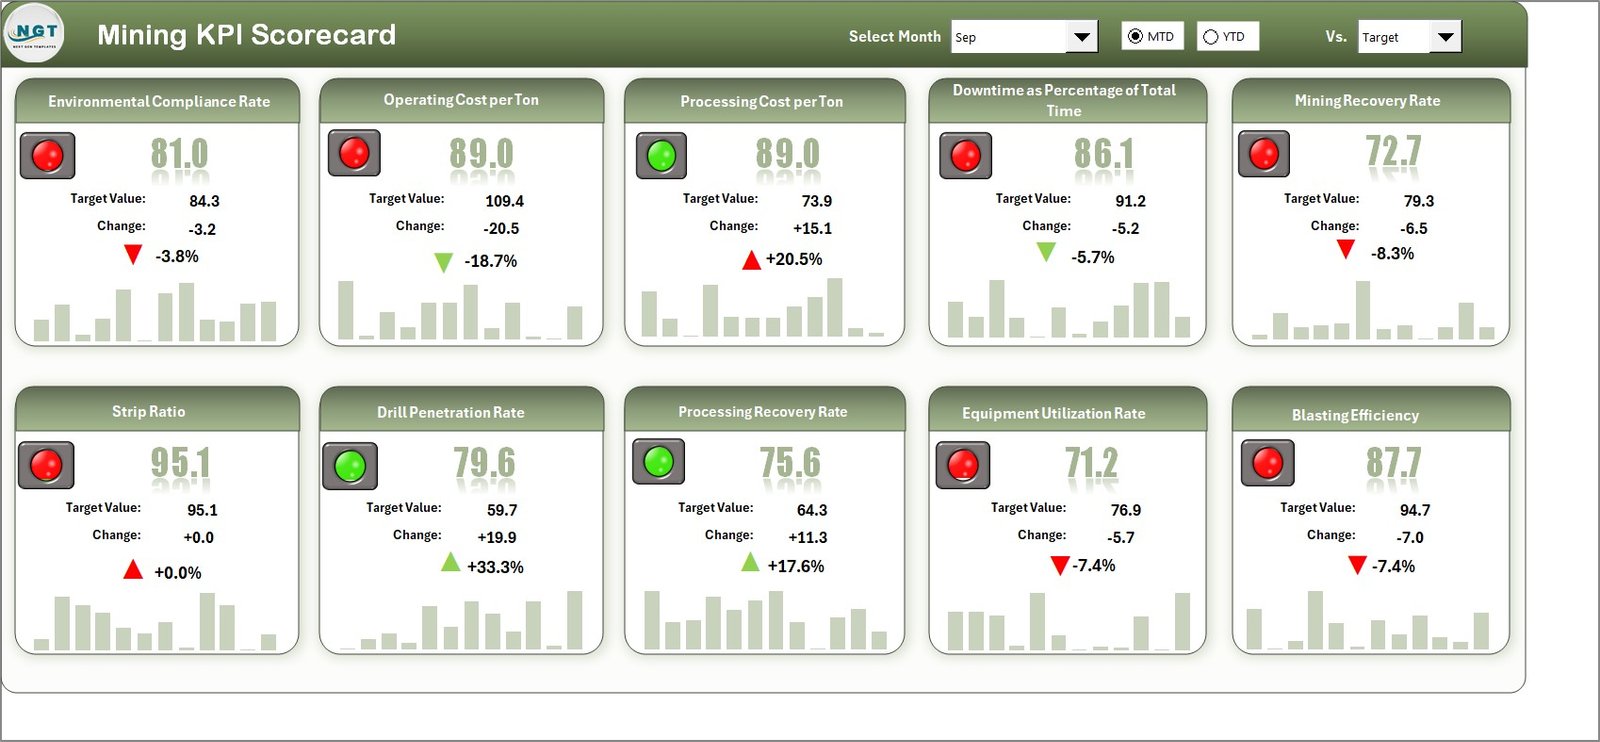
Scorecard Sheet
The Scorecard Sheet is the central dashboard of the tool. It provides a visual summary of all major KPIs through charts, colors, and indicators.
Click to buy Mining kip scorecard in Excel
Key Features:
- Dropdown Menus: Easily select the desired month or toggle between MTD (Month-to-Date) and YTD (Year-to-Date) analysis.
- Actual vs. Target Comparison: Instantly compare current performance against predefined targets.
- Color-Coded Status Indicators: Conditional formatting highlights performance trends (e.g., green for achieved, red for below target).
- Comprehensive KPI View: Displays 10 key KPIs at a glance, making performance tracking quick and convenient.
- Interactive Visuals: Data-driven charts provide immediate insights into how the operation performs across different periods.
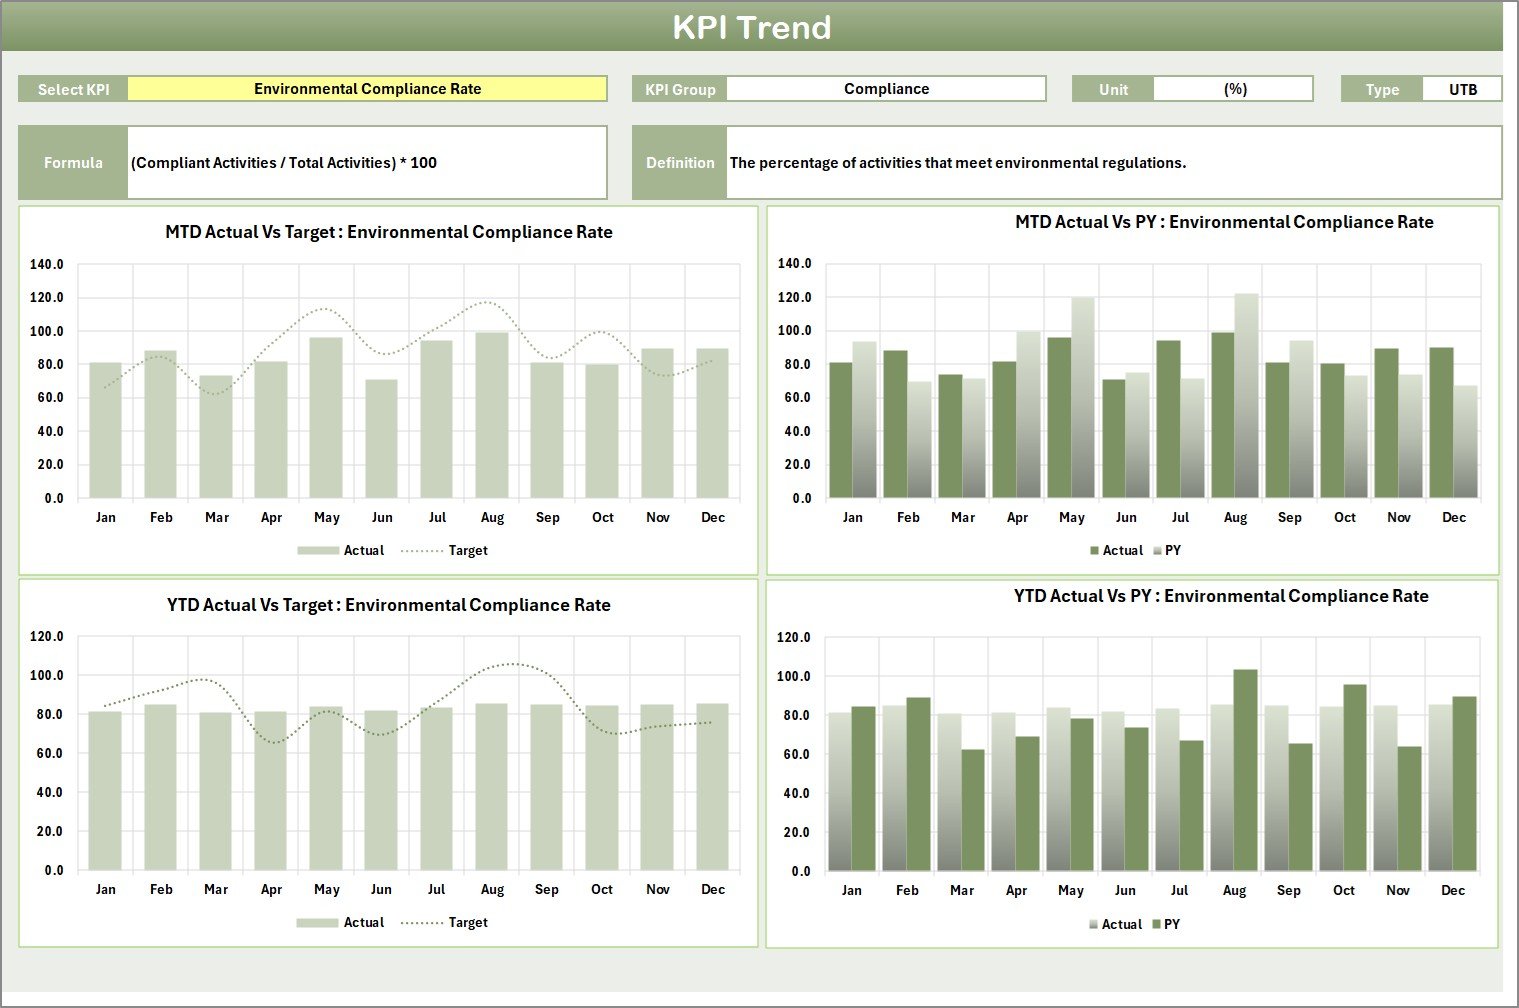
KPI Trend Sheet
This worksheet focuses on trend analysis, helping users visualize performance changes over time.
Key Features:
- KPI Selection Dropdown: Choose any KPI from the dropdown list in cell C3.
- KPI Metadata: Displays KPI Group, Unit, Type (Lower the Better or Upper the Better), Formula, and Definition.
- Trend Visualization: Dynamic charts show MTD and YTD trends for Actual, Target, and Previous Year (PY) metrics.
- Comparative Analysis: Identify whether performance is improving or declining across months.
This page is especially useful for senior managers who want to review long-term patterns rather than individual monthly results.Mining kip scorecard in Excel
Click to buy Mining kip scorecard in Excel
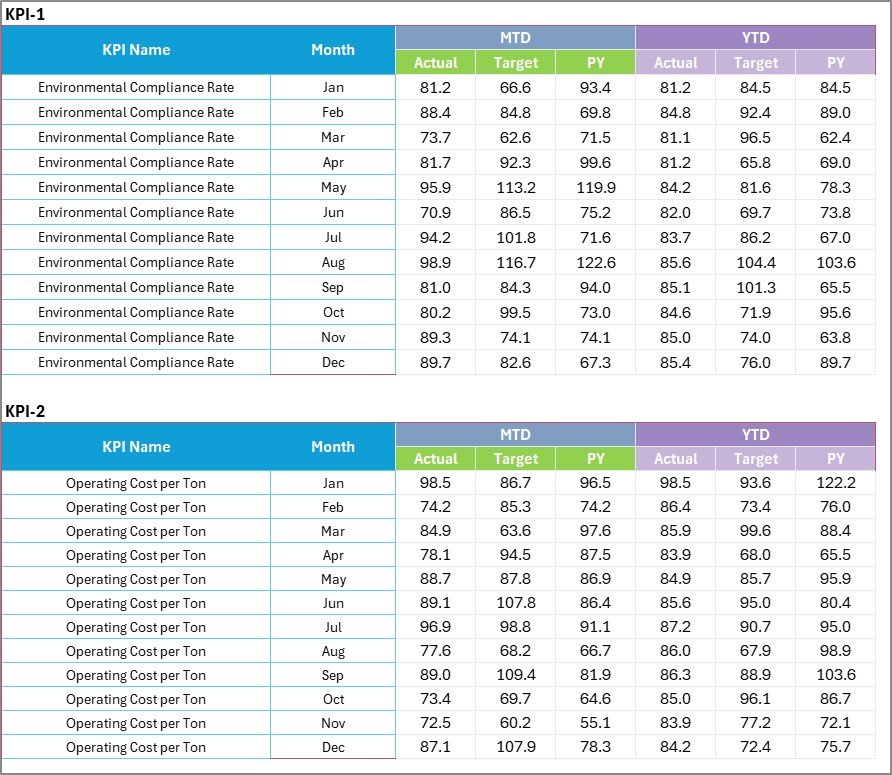
Input Data Sheet
The Input Data Sheet serves as the foundation of the entire scorecard. It contains all raw data necessary to power the dashboard.
Key Features:
- Data Entry Section: Enter actual performance values, targets, and prior-year figures for each KPI.
- Flexibility and Updates: The sheet allows continuous data updates, ensuring the dashboard always reflects curent results.
- Automatic Calculations: Excel formulas calculate variances and trends automatically, reducing manual work.
This tab works like the backend of the system—accurate data here ensures reliable analysis on the scorecard and trend pages.
Click to buy Mining kip scorecard in Excel
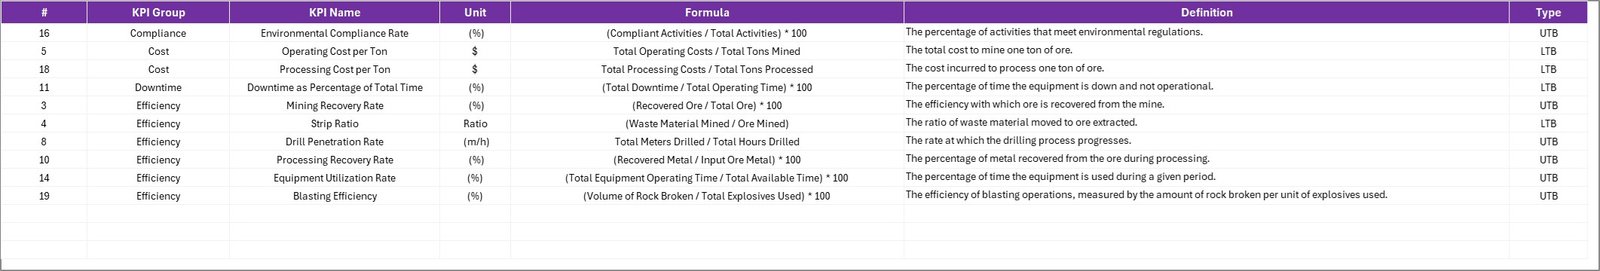
KPI Definition Sheet
The KPI Definition Sheet provides documentation and reference for each metric tracked in the scorecard.
Key Features:
- KPI Details: Contains the KPI Name, Group, Unit, Formula, and Definition.
- Standardization: Ensures consistent understanding of how each KPI is measured.
- Transparency: Helps auditors, analysts, and managers validate calculations or update KPI formulas as needed.
This tab acts as a “dictionary” for the mining KPIs—making the scorecard professional, auditable, and easy to maintain.
Click to buy Mining kip scorecard in Excel
Advantages of Using a Mining KPI Scorecard in Excel
Implementing this Excel-based KPI Scorecard offers multiple advantages for mining organizations:
- Centralized Performance Tracking
- All critical metrics appear in one location, enabling quick and efficient monitoring of operational performance.
- Better Decision-Making
- By comparing actuals with targets and previous years, managers can identify bottlenecks and implement corrective actions early.
- Enhanced Visibility
- Visual charts and conditional formatting make data easier to interpret, helping teams communicate performance effectively during meetings.
- Improved Accountability
- Each KPI is linked to a specific department or person, making responsibilities clear and measurable.
- Cost-Effective Solution
- Unlike expensive business intelligence tools, this Excel-based system provides similar analytical capabilities at a fraction of the cost.
- Customizable for Any Operation
You can easily add or modify KPIs, adjust targets, and change visualization formats to suit your specific mining processes.
How to Use the Mining KPI Scorecard in Excel
Follow these simple steps to make the most of your scorecard:
- Open the Template: Start by downloading the Mining KPI Scorecard Excel file.
- Input Data: Enter monthly actual, target, and previous year figures in the Input Data sheet.
- Define KPIs: Update KPI names, groups, formulas, and units in the KPI Definition tab.
- View the Scorecard: Use dropdowns to select a month or performance view (MTD/YTD).
- Analyze Trends: Switch to the KPI Trend tab to evaluate changes over time.
- Take Action: Use insights from the dashboard to address performance gaps and optimize operations.
This workflow ensures you get continuous performance feedback and actionable insights throughout the year.
Why Excel Is Ideal for Mining KPI Tracking
While many organizations use specialized software, Excel remains one of the most flexible and powerful tools for KPI management.
Key Reasons Include:
- Customization: Fully adaptable to specific company needs.
- Visualization Tools: Supports charts, conditional formatting, and pivot tables.
- Automation Ready: You can integrate Excel VBA or Power Query to automate updates.
- Offline Access: No internet dependency ensures reliability in remote mining sites.
- Integration Capability: Easily imports data from ERP, SCADA, or maintenance systems.
Best Practices for the Mining KPI Scorecard
To make your KPI tracking more effective, follow these best practices:
- Keep KPIs Relevant
- Only track KPIs that directly impact production efficiency, cost control, safety, or sustainability.
- Update Data Regularly
- Ensure data accuracy by updating inputs weekly or monthly. Outdated data can mislead decision-making.
- Use Clear Visuals
- Rely on color-coded indicators (like red, amber, and green) to quickly highlight performance gaps.
- Standardize Definitions
- Keep KPI definitions consistent across departments to maintain clarity and fairness in evaluations.
- Automate Calculations
- Leverage Excel formulas and Power Query to reduce manual errors and save time.
- Encourage Collaboration
- Share the scorecard with department heads so they can contribute updates and insights.
- Review Periodically
- Conduct regular performance review meetings using the dashboard to discuss trends and action plans.
Real-World Applications of a Mining KPI Scorecard
The Mining KPI Scorecard is versatile and can be adapted for various operational areas:
- Open-Pit Mining: Track equipment utilization, haul truck efficiency, and ore recovery rates.
- Underground Mining: Monitor ventilation efficiency, safety incidents, and ore grade consistency.
- Processing Plants: Evaluate throughput, yield, and energy efficiency.
- Environmental Management: Measure waste disposal compliance and emission reduction.
- Workforce Management: Analyze labor hours, safety training, and productivity per employee.
No matter the type of mining operation, this scorecard provides actionable intelligence for improvement.
How the Mining KPI Scorecard Improves Business Performance
Using this Excel-based scorecard can transform how mining operations perform by:
- Increasing Operational Efficiency – By identifying bottlenecks and inefficiencies early.
- Reducing Downtime – Through better maintenance planning and performance monitoring.
- Enhancing Safety Standards – By continuously tracking and improving safety KPIs.
- Optimizing Costs – By monitoring cost per ton and identifying areas for savings.
- Boosting Sustainability Efforts – By tracking environmental KPIs like waste and water usage.
Together, these improvements contribute to higher profitability and stronger long-term performance.
Conclusion
The Mining KPI Scorecard in Excel is more than just a spreadsheet—it’s a powerful performance management system.
By integrating real-time data tracking, trend analysis, and visual dashboards, it provides mining companies with a comprehensive view of their operational performance.
Whether your goal is to improve production output, enhance safety, or achieve environmental compliance, this tool delivers actionable insights in a simple, cost-effective way.
Mining is a complex industry, but with the right scorecard in hand, managing performance becomes clear, measurable, and strategic.
Frequently Asked Questions (FAQs)
- What is the main purpose of a Mining KPI Scorecard?
- The main purpose is to track and measure key performance indicators related to mining operations such as production, maintenance, cost, safety, and environment. It helps identify performance gaps and improvement opportunities.
- Can I customize the Mining KPI Scorecard for my mine?
- Yes. The Excel template is fully customizable—you can modify KPIs, add new metrics, and adjust visualizations to match your mine’s unique requirements.
- How often should I update the KPI data?
- Ideally, update data monthly. However, for critical operations, weekly or even daily updates can improve decision accuracy.
- Is the scorecard suitable for small mining operations?
- Absolutely. Small and mid-sized mining businesses can use it effectively without investing in costly business intelligence software.
- Can I integrate this Excel scorecard with other software?
- Yes. You can link Excel to ERP systems or databases using Power Query, macros, or CSV imports to automate data entry.
- What makes Excel better than specialized tools?
- Excel is affordable, flexible, and easy to use. It requires no additional licenses, and most teams already have the skills to operate it.
- How many KPIs can I track in this scorecard?
- The default template shows 10 KPIs, but you can easily expand it to include more metrics depending on your needs.
- Can the scorecard track both MTD and YTD performance?
Yes. The dropdown feature allows switching between Month-to-Date and Year-to-Date views, giving you a comprehensive performance perspective.Mining kip scorecard in Excel
Visit our YouTube channel to learn step-by-step video tutorials
Watch the step-by-step video tutorial:
Click to buy Mining kip scorecard in Excel