Managing workflow efficiency in pharmacies is crucial for improving service delivery, minimizing delays, and ensuring customer satisfaction. The Pharmacy Workflow Bottleneck Analysis Report in Excel is a ready-to-use tool that helps pharmacy managers and staff identify, analyze, and address bottlenecks in the pharmacy workflow. This report enables tracking of the entire workflow process from drug categorization to urgent case handling, with an emphasis on reducing delays.
In this article, we will explore the key features of the Pharmacy Workflow Bottleneck Analysis Report in Excel, explain how it works, and highlight how it can help optimize pharmacy operations.
What is the Pharmacy Workflow Bottleneck Analysis Report in Excel?
The Pharmacy Workflow Bottleneck Analysis Report in Excel is a powerful tool designed to analyze the various stages of the pharmacy workflow and identify areas where delays or bottlenecks occur. The report provides insightful data visualizations and metrics, helping you pinpoint inefficiencies, track performance, and improve the overall workflow.
Key Features of the Pharmacy Workflow Bottleneck Analysis Report in Excel
1) Summary Sheet Tab: Overview of Pharmacy Workflow
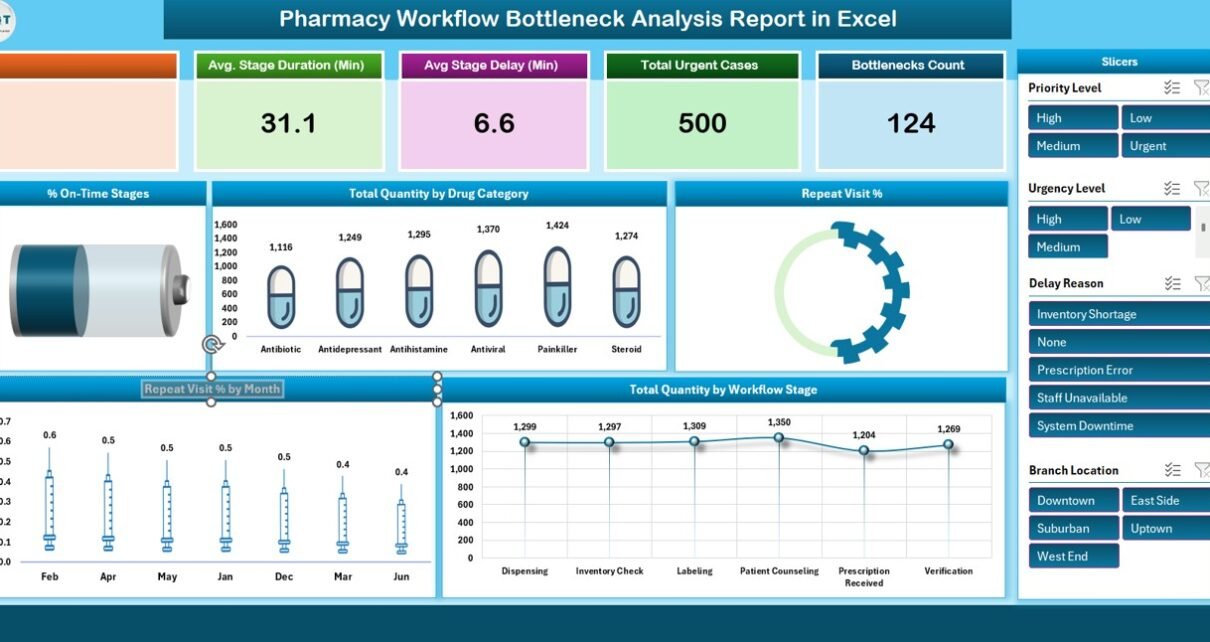
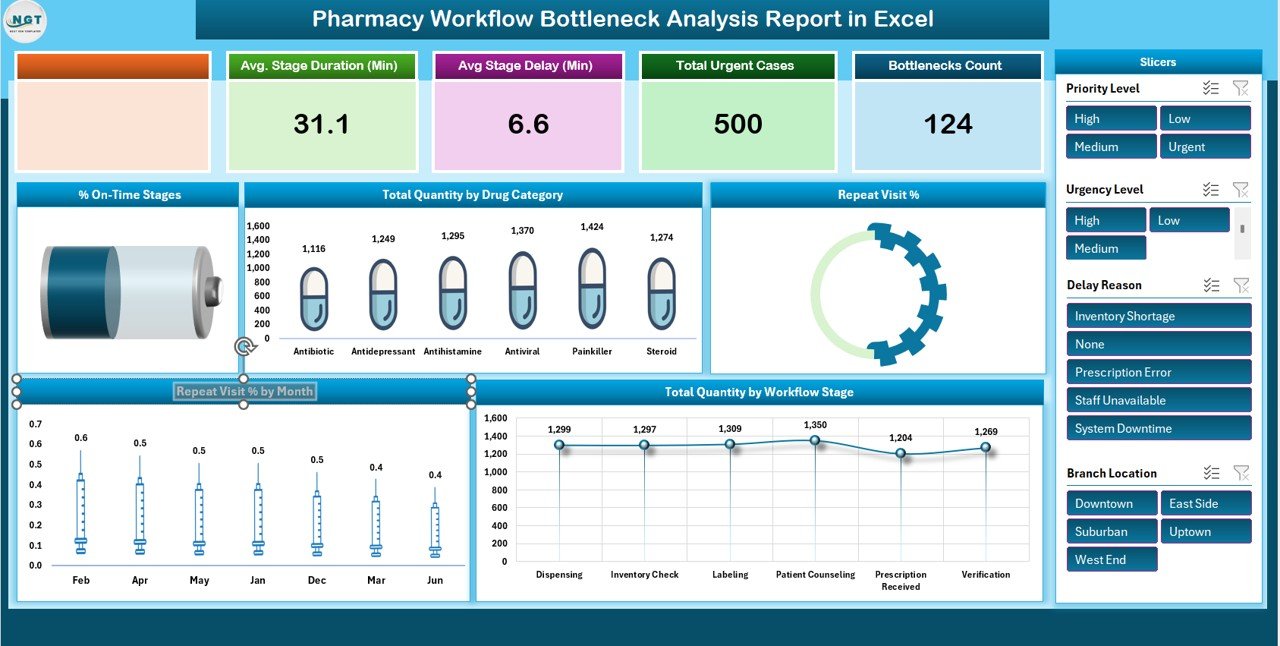
The Summary Sheet Tab offers a high-level overview of the pharmacy workflow and its performance. Key features include:
Cards:
- Total Workflows: Displays the total number of workflows processed during the reporting period.
- Avg. Stage Duration (Min): Shows the average time taken for each workflow stage (in minutes).
- Avg. Stage Delay (Min): Highlights the average delay encountered in each workflow stage (in minutes).
- Total Urgent Cases: Tracks the number of urgent cases handled by the pharmacy.
- Bottlenecks Count: Indicates the number of bottlenecks or delays identified in the workflow.
Charts:
- % On-Time Stages: Displays the percentage of stages completed on time, helping identify delays and bottlenecks.
- Total Quantity by Drug Category: Shows the quantity of drugs processed, categorized by type, to identify any drug-specific bottlenecks.
- Repeat Visit %: Tracks the percentage of repeat visits for the same prescription or service.
- Total Quantity by Workflow Stage: Visualizes the total quantity of workflows completed per stage, identifying stages that may require additional resources.
- Repeat Visit % by Month: Displays the repeat visit percentage by month to track trends and identify any recurring workflow issues.
The Summary Sheet Tab provides a snapshot of the pharmacy’s performance, making it easier for management to identify critical workflow issues.
Click to buy Pharmacy Workflow Bottleneck Analysis Report in Excel
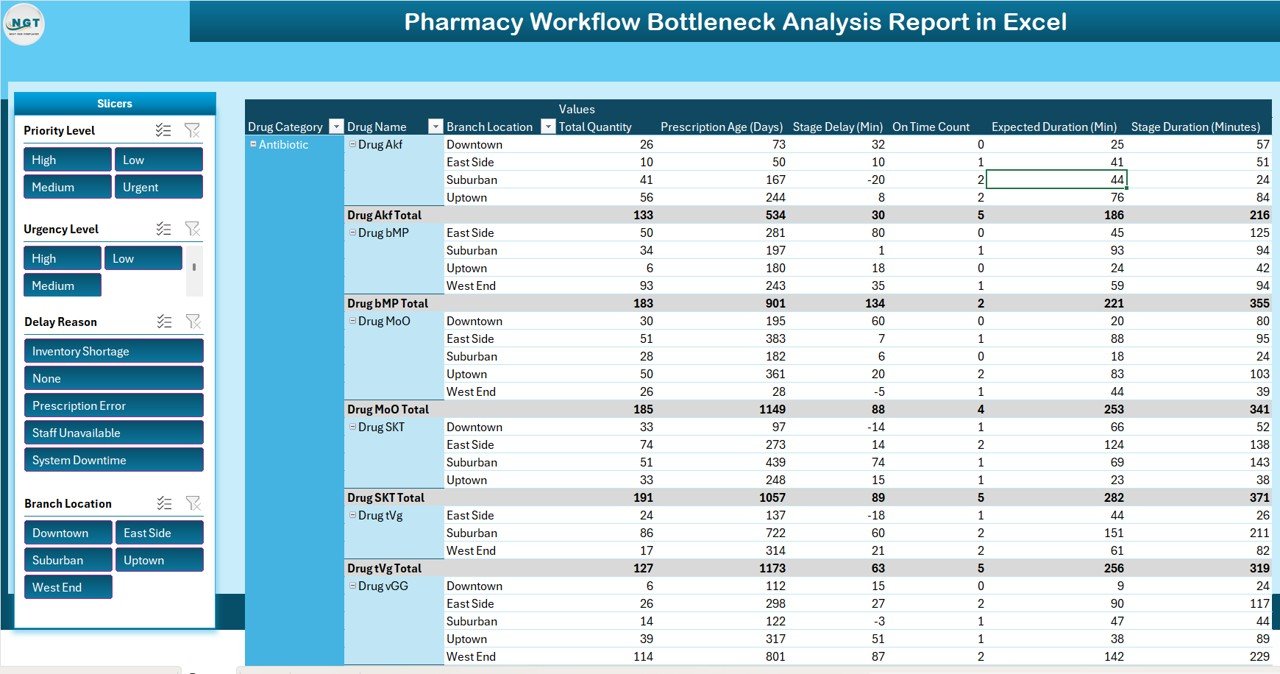
2) Report Tab: Pivot Table Analysis
The Report Tab uses pivot tables to break down the data for detailed analysis. This tab allows for easy filtering and deep-diving into the various workflow stages. Features include:
-
Pivot Table Analysis: The data from the Data Sheet Tab is processed into pivot tables to present the performance of different stages, identify bottlenecks, and track any stage delays.
-
Customizable Views: Users can filter data by different criteria (e.g., stage, drug category, urgency) to focus on specific aspects of the workflow.
-
Comprehensive Reports: The pivot table view helps create comprehensive reports for management, which can be used for decision-making and continuous improvement.
This report is ideal for understanding the specifics of workflow bottlenecks, providing actionable insights to enhance pharmacy performance.
Click to buy Pharmacy Workflow Bottleneck Analysis Report in Excel
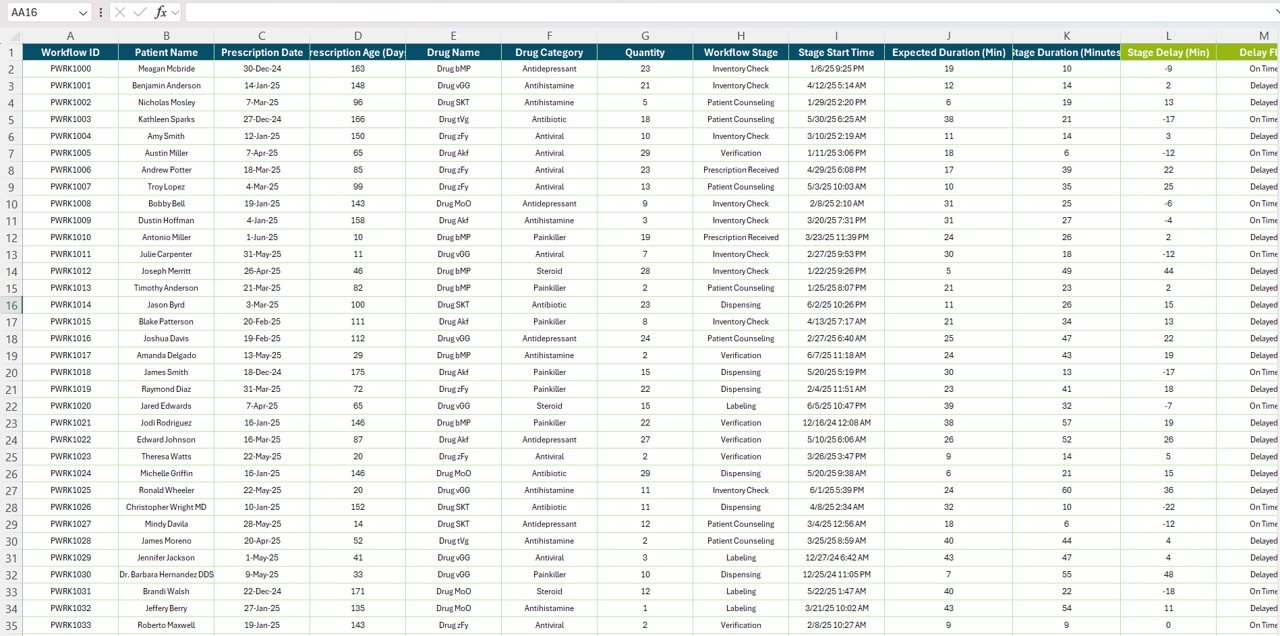
3) Data Sheet Tab: Raw Data for Workflow Tracking
The Data Sheet Tab is where raw data is inputted to feed the analysis. Key columns include:
- Workflow ID: A unique identifier for each workflow processed in the pharmacy.
- Drug Category: The category of the drug being processed (e.g., pain relievers, antibiotics).
- Stage Name: The stage in the workflow process (e.g., prescription received, medication dispensed).
- Stage Duration: The time taken for each workflow stage (in minutes).
- Stage Delay: The delay encountered at each workflow stage (in minutes).
- Urgency: Indicates whether the case is urgent or routine.
- Repeat Visits: Tracks whether the workflow resulted in a repeat visit.
- Completion Status: Indicates whether the workflow was completed on time or delayed.
- Approval Status: Indicates if the workflow was approved or pending.
This sheet serves as the foundation for generating insights and reports in the Summary Sheet and Report Tab, making it essential for accurate tracking.
Click to buy Pharmacy Workflow Bottleneck Analysis Report in Excel
Benefits of Using the Pharmacy Workflow Bottleneck Analysis Report
The Pharmacy Workflow Bottleneck Analysis Report in Excel offers several key benefits for pharmacy managers:
-
Identifies Bottlenecks: The report helps identify stages where delays or inefficiencies occur, enabling management to address these bottlenecks and improve workflow efficiency.
-
Improves Decision-Making: With insights into bottlenecks, stage delays, and repeat visits, the report helps pharmacy managers make data-driven decisions to streamline operations.
-
Enhances Operational Efficiency: By tracking workflow performance, the report helps optimize resource allocation and improve staff performance.
-
Tracks Urgent Cases Effectively: The report allows for better tracking and management of urgent cases, ensuring that critical requests are handled promptly.
-
Data Transparency: The use of pivot tables and charts ensures that all data is clearly visualized and accessible for analysis, improving transparency and accountability.
Best Practices for Using the Pharmacy Workflow Bottleneck Analysis Report
Click to buy Pharmacy Workflow Bottleneck Analysis Report in Excel
To get the most out of the Pharmacy Workflow Bottleneck Analysis Report, consider these best practices:
-
Regularly Update Data: Ensure that the Data Sheet Tab is updated regularly to capture accurate information and keep reports up to date.
-
Monitor Repeat Visits: Pay attention to the Repeat Visit % and Repeat Visit % by Month to identify recurring issues in the workflow and take corrective actions.
-
Analyze Bottlenecks: Use the Bottlenecks Count and % On-Time Stages to track delays in the workflow and identify the root causes of bottlenecks.
-
Use Pivot Tables for Detailed Analysis: Leverage the Report Tab with pivot tables to gain deeper insights into workflow performance and stage delays.
-
Make Data-Driven Decisions: Use the insights from the report to make informed decisions about resource allocation, staffing, and workflow optimization.
Conclusion
The Pharmacy Workflow Bottleneck Analysis Report in Excel is an invaluable tool for improving the efficiency of pharmacy operations. By tracking workflow stages, identifying bottlenecks, and analyzing performance metrics, this report enables pharmacy managers to make data-driven decisions that enhance service delivery, reduce delays, and optimize operational workflows.
Frequently Asked Questions (FAQs)
Click to buy Pharmacy Workflow Bottleneck Analysis Report in Excel
1. How do I track the performance of different workflow stages?
You can track the performance of workflow stages using the Charts in the Summary Sheet Tab and the Pivot Table Analysis in the Report Tab.
2. Can I track repeat visits in the system?
Yes, the Repeat Visit % column in the Data Sheet Tab and the Repeat Visit % by Month chart in the Summary Sheet help you track repeat visits effectively.
3. What should I do if I identify bottlenecks in the workflow?
Once bottlenecks are identified, you can address them by reallocating resources, optimizing staffing, and improving stage efficiency.
4. Can I modify the template to suit my pharmacy’s specific needs?
Yes, the template is fully customizable. You can add new columns, modify existing data, and adjust the charts as needed.
5. How can I ensure accurate data input?
Ensure that the Data Sheet Tab is updated regularly and that all staff members responsible for entering data follow a consistent process.
Visit our YouTube channel to learn step-by-step video tutorials
Watch the step-by-step video Demo:
Click to buy Pharmacy Workflow Bottleneck Analysis Report in Excel