Physiotherapy and rehabilitation centers handle many daily activities. They treat patients, manage appointments, track therapy progress, support long-term recovery, and monitor the performance of therapists. Because of this, leaders need a clear view of operations, patient outcomes, and resource use. When data stays in many files, teams often miss patterns, delays, and improvement areas.
A Physiotherapy & Rehabilitation KPI Dashboard in Power BI solves this problem. It gives a simple and smart way to analyze clinical, operational, and performance data. Managers can see progress in real time, track targets, monitor therapist performance, and review patient recovery trends with a single click.
In this detailed article, you will learn everything about this dashboard—its importance, structure, worksheets, pages, KPIs, advantages, best practices, and answers to the most common questions. The goal is to help physiotherapy and rehab centers use data to improve care quality and business outcomes.
Click to buy Physiotherapy & Rehabilitation KPI Dashboard in Power BI
What Is a Physiotherapy & Rehabilitation KPI Dashboard in Power BI?
A Physiotherapy & Rehabilitation KPI Dashboard in Power BI is a ready-to-use reporting tool designed for physiotherapy centers, rehab hospitals, clinics, wellness centers, and specialized therapy institutes. It brings all important KPIs into one place and allows decision-makers to track results in a fast, visual, and interactive way.
The dashboard uses Excel sheets as the data source, so teams can update the numbers easily without technical skills. Power BI reads the Excel file and creates real-time charts, visuals, and comparisons.
You can track:
- Patient visits
- Treatment success rates
- Session attendance
- Therapist workload
- Patient satisfaction
- Equipment utilization
- Appointment efficiency
- Revenue and billing
- MTD (Month to Date) and YTD (Year to Date) performance
Because therapists work with long-term treatment plans, progress tracking becomes very important. This dashboard gives a clear snapshot of how well patients respond to treatment and how efficiently the clinic operates.
Why Do Physiotherapy & Rehabilitation Centers Need a KPI Dashboard?
Physiotherapy centers deal with many moving parts. Without clear tracking, teams struggle with delays, follow-ups, and missed performance targets. A KPI dashboard helps you:
- Track patient progress
- Measure recovery outcomes
- Reduce appointment gaps
- Improve staff performance
- Boost therapy quality
- Monitor MTD and YTD progress
- Compare performance with previous years
Since decisions based on guesswork cause errors, Power BI makes sure your decisions are based on facts and trends.
Key Features of the Physiotherapy & Rehabilitation KPI Dashboard in Power BI
This dashboard contains three powerful pages. Each page gives a different perspective to understand performance.
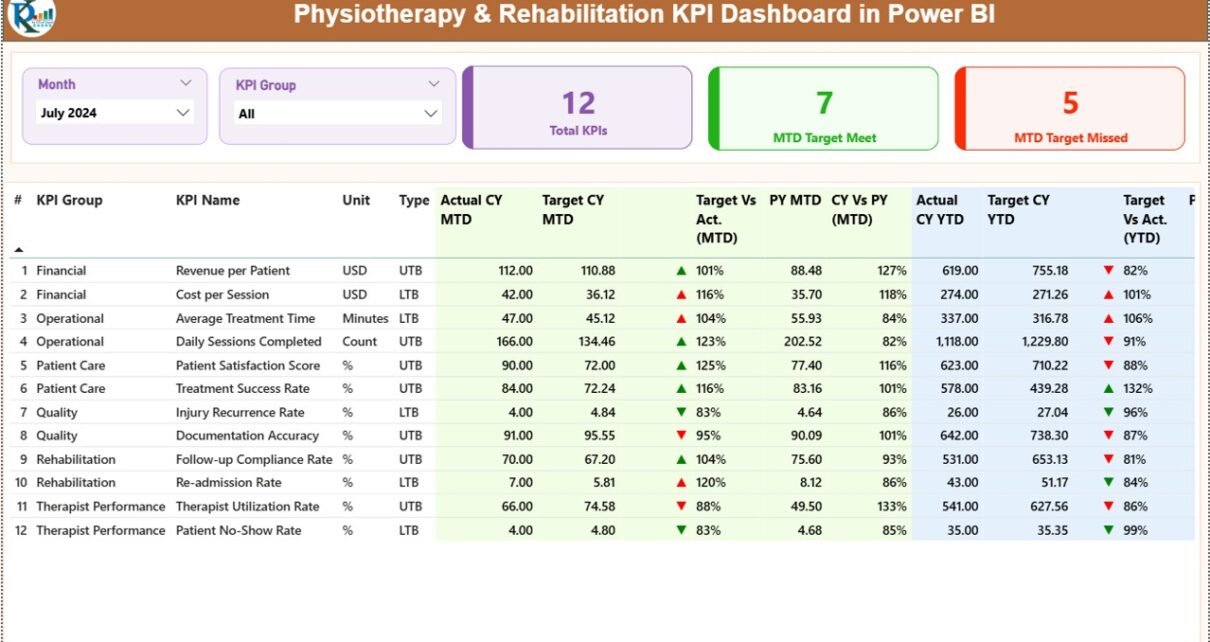
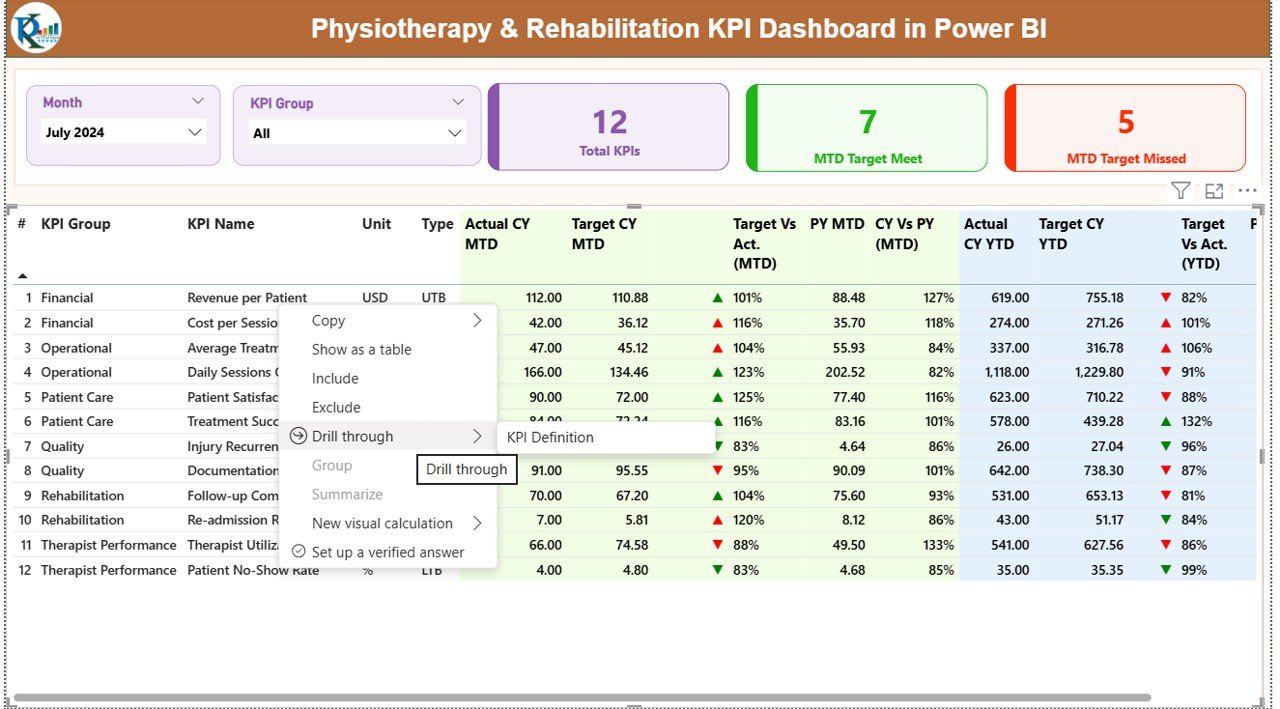
Summary Page – The Main Performance View
The Summary Page provides a complete overview of all KPIs. The design makes the page simple to read and easy to understand. The slicers and visuals help you analyze data for any month and any KPI group.
Top Features of the Summary Page
- Month slicer to filter results
- KPI Group slicer to select therapy, operations, finance, or patient-related KPIs
- Three KPI cards showing:
- Total KPIs count
- MTD Target Met
- MTD Target Missed
- Detailed KPI table with complete performance indicators
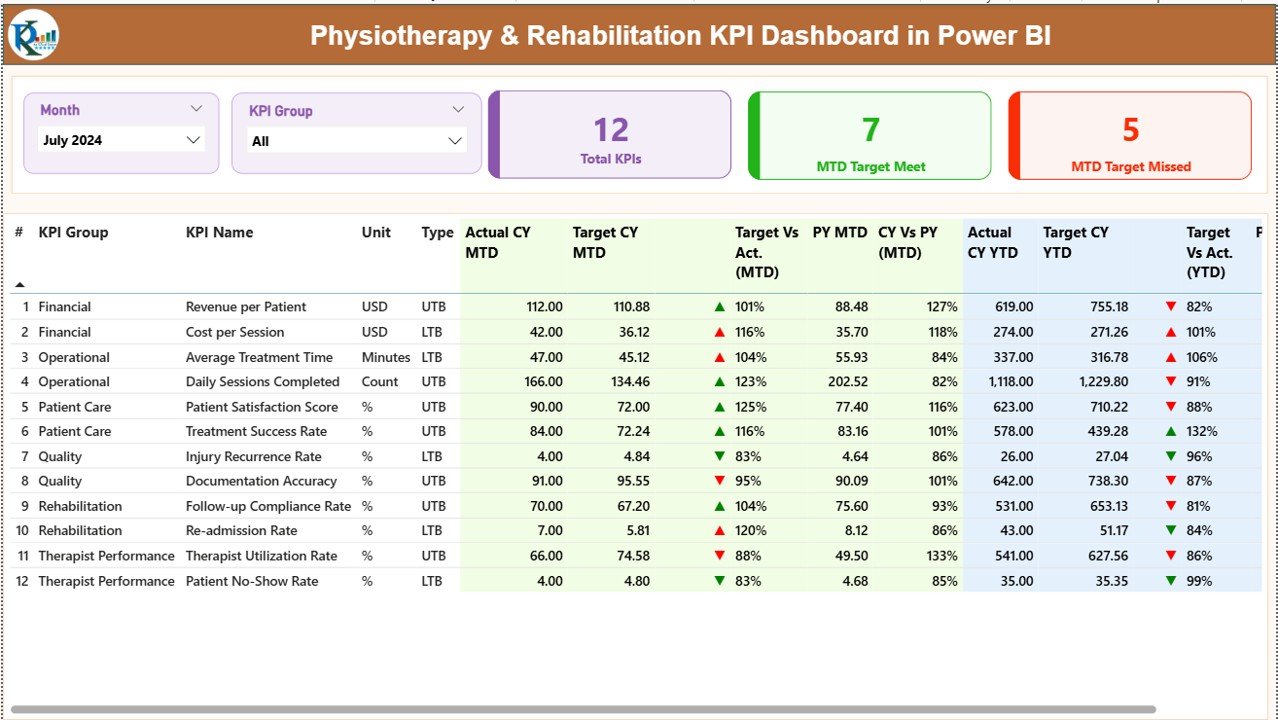
KPI Details Displayed
The dashboard shows every KPI with complete performance insights:
- KPI Number – Unique sequence number
- KPI Group – Therapy, Operations, Financials, Patient Care
- KPI Name – The specific performance indicator
- Unit – % or numeric
- Type – LTB (Lower the Better) or UTB (Upper the Better)
- Actual CY MTD – Actual Month-to-Date value
- Target CY MTD – Target for the month
- MTD Icon – ▲ or ▼ with color indicators
- Target vs Actual (MTD) – Actual ÷ Target
- PY MTD – Previous Year MTD value
- CY vs PY (MTD) – Current MTD ÷ Previous MTD
- Actual CY YTD – Year-to-Date actual
- Target CY YTD – Year-to-Date target
- YTD Icon – ▲ or ▼ for target comparison
- Target vs Actual (YTD) – Actual ÷ Target
- PY YTD – Previous YTD
- CY vs PY (YTD) – Current YTD ÷ Previous YTD
The icons and conditional colors help you detect improvement or decline quickly.
Click to buy Physiotherapy & Rehabilitation KPI Dashboard in Power BI
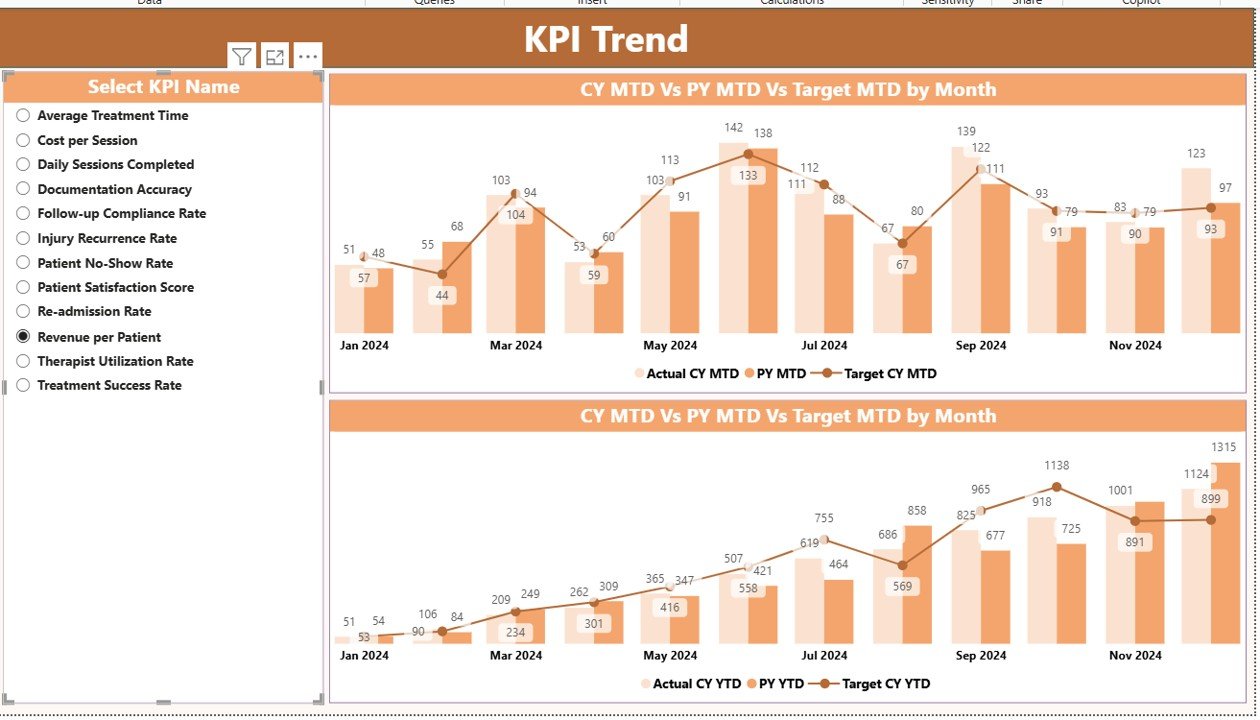
KPI Trend Page – Visual View of Progress
The KPI Trend Page gives powerful visual charts that compare:
- Current Year (CY)
- Previous Year (PY)
- Target
This helps management understand improvement or decline across months.
Dashboard Shows:
- Combo chart for MTD trend
- Combo chart for YTD trend
- Slicer to select any KPI name
This page helps identify seasonal patterns, patient recovery cycles, or workload changes.
Click to buy Physiotherapy & Rehabilitation KPI Dashboard in Power BI
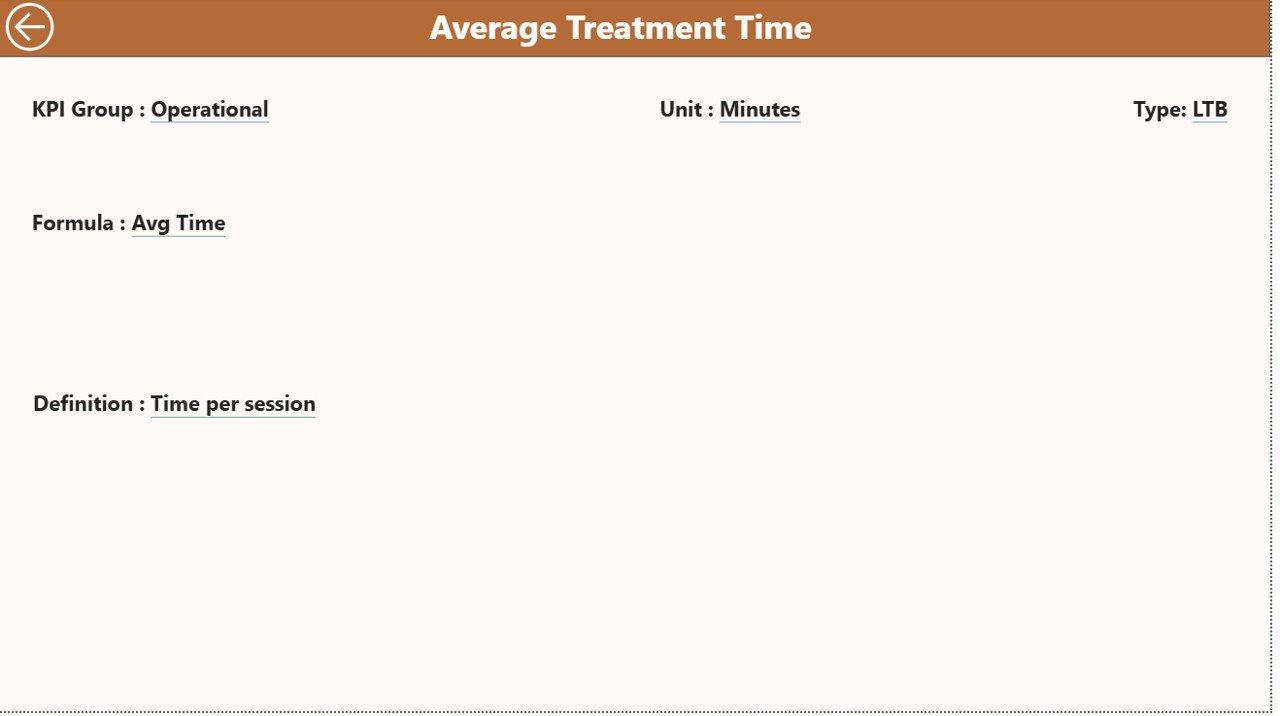
KPI Definition Page – Drill-Through Details
This hidden drill-through page helps you see the complete definition of any KPI.
When you right-click any KPI on the Summary Page → Drill Through → KPI Definition, you can view:
- KPI Number
- KPI Group
- KPI Name
- Unit
- Formula
- Definition
- Type (UTB or LTB)
This page helps new staff understand KPIs clearly and maintain accuracy.
Click to buy Physiotherapy & Rehabilitation KPI Dashboard in Power BI
Excel Data Structure for the Dashboard
The dashboard works with three Excel sheets. These sheets form the data foundation.
Input_Actual Sheet
Here you enter:
- KPI Name
- Month (use first date of the month)
- MTD Actual
- YTD Actual
Input_Target Sheet
Here you enter:
- KPI Name
- Month
- MTD Target
- YTD Target
KPI Definition Sheet
Here you enter:
- KPI Number
- KPI Group
- KPI Name
- Unit
- Formula
- Definition
- KPI Type (LTB or UTB)
This makes the dashboard fully dynamic and ready for automation.
Click to buy Physiotherapy & Rehabilitation KPI Dashboard in Power BI
What KPIs Should Physiotherapy & Rehabilitation Centers Track?
Here are the most important performance indicators every rehab center must monitor:
Patient-Related KPIs
- Number of patient visits
- Appointment adherence rate
- Therapy completion rate
- Patient satisfaction score
- New patient conversion rate
- Recovery score
Therapist & Staff KPIs
- Therapist productivity
- Treatment session capacity
- Average recovery time
- Treatment success rate
- Re-assessment completion rate
Operational KPIs
- Appointment waiting time
- Treatment room utilization
- Equipment usage
- Billing cycle time
Financial KPIs
- Revenue per therapist
- Revenue per patient
- Pending payments
- Therapy package conversion
Because these KPIs affect performance directly, Power BI helps track them clearly.
Advantages of Physiotherapy & Rehabilitation KPI Dashboard in Power BI
A dedicated dashboard offers many benefits. Here are the most important ones:
Clear Performance Visibility
The dashboard shows all KPIs on one screen. Managers can understand results at a glance.
Better Decision-Making
Power BI displays trends, comparisons, and performance gaps. Decisions become fast and accurate.
Improved Patient Outcomes
When you track patient progress regularly, you can adjust treatment plans and improve recovery.
Higher Therapist Productivity
Therapists can see their performance numbers. This encourages consistency and quality.
Reduced Missed Appointments
By analyzing patient attendance patterns, you can improve booking efficiency.
Year-on-Year Comparison
The dashboard compares PY and CY for both MTD and YTD. This gives strong insights for planning.
Data Accuracy and Real-Time Updates
You only need to update the Excel sheets. Power BI refreshes the visuals automatically.
Better Resource Utilization
You can track treatment rooms, therapy equipment, and therapist load with clarity.
Best Practices for Using the Physiotherapy & Rehabilitation KPI Dashboard
Here are the best methods to make your dashboard more powerful:
Update Excel Data Regularly
Consistent updates keep results accurate.
Use Clear KPI Definitions
All saff should know what each KPI means. This improves data entry accuracy.
Review Trends Weekly
Trend analysis helps find root causes and improvement areas quickly.
Add New KPIs When Needed
As the clinic grows, add more KPIs to track new services.
Train Your Team
A short training session ensures everyone uses the dashboard correctly.
Monitor MTD and YTD Separately
This helps you detect short-term and long-term performance differences.
Use Slicers for Deep Analysis
Filter by month or KPI group to study patterns clearly.
Conclusion
A Physiotherapy & Rehabilitation KPI Dashboard in Power BI helps clinics, therapy centers, and rehabilitation hospitals track performance in a smart and organized way. It presents detailed KPI insights, trend visuals, MTD and YTD comparisons, and simple drill-through definitions. Because physiotherapy requires continuous tracking and progress measurement, this dashboard becomes a powerful tool to improve patient care, team performance, and operational efficiency.
With the right KPIs and regular updates, any physiotherapy clinic can take better decisions and deliver great results.
Frequently Asked Questions (FAQs)
- What makes this dashboard useful for physiotherapy centers?
It gives real-time data, target tracking, and patient progress insights in one place.
- Do I need technical skills to use this dashboard?
No. You only update Excel sheets. Power BI does the rest automatically.
- Can I add new KPIs?
Yes. You can add KPIs in the definition sheet, and the dashboard updates after refresh.
- How often should I update the data?
Daily or weekly updates give the best results.
- Can small clinics use this dashboard?
Yes. It works well for both small therapy centers and large rehabilitation hospitals.
- What is LTB and UTB in KPIs?
- LTB: Lower the Better
- UTB: Upper the Better
- Can this dashboard track financial data too?
Yes. You can track revenue, billing, payments, and package conversions.
Visit our YouTube channel to learn step-by-step video tutorials
Watch the step-by-step video tutorial: