In today’s fast-paced business environment, procurement teams play a vital role in maintaining cost efficiency, supplier performance, and timely delivery of goods and services. However, without proper visibility into key performance indicators (KPIs), it becomes difficult to track progress, identify inefficiencies, and make informed decisions.
That’s where a Procurement Efficiency KPI Dashboard in Power BI comes into play. This modern, interactive dashboard transforms raw procurement data into meaningful insights—helping organizations improve operational efficiency and achieve strategic goals.
This article provides an in-depth look into the Procurement Efficiency KPI Dashboard in Power BI, its key features, benefits, best practices, and how it simplifies the monitoring and management of procurement performance.
Click to buy Procurement Efficiency KPI Dashboard in Power BI
What Is a Procurement Efficiency KPI Dashboard in Power BI?
A Procurement Efficiency KPI Dashboard in Power BI is a dynamic and visually rich analytics tool designed to track, analyze, and visualize procurement-related key performance indicators.
It provides real-time insights into supplier performance, purchase order cycle time, cost savings, contract compliance, and more—all in one central interface.
The dashboard uses Microsoft Power BI to connect with an Excel-based dataset containing all KPI metrics. It automatically updates visuals, charts, and tables based on the data entered in the Excel sheets, ensuring that procurement professionals always have access to up-to-date performance metrics.
This dashboard helps procurement teams answer critical questions such as:
- Are we meeting our monthly procurement targets?
- How are current performance levels compared to last year?
- Which suppliers or categories need attention?
- Are procurement cycle times improving over time?
By answering these questions, the dashboard enables better resource allocation, faster decision-making, and stronger supplier relationships.
Key Features of the Procurement Efficiency KPI Dashboard
This Power BI dashboard includes three interactive pages that deliver a complete overview of procurement efficiency metrics. Each page focuses on a specific layer of performance tracking.
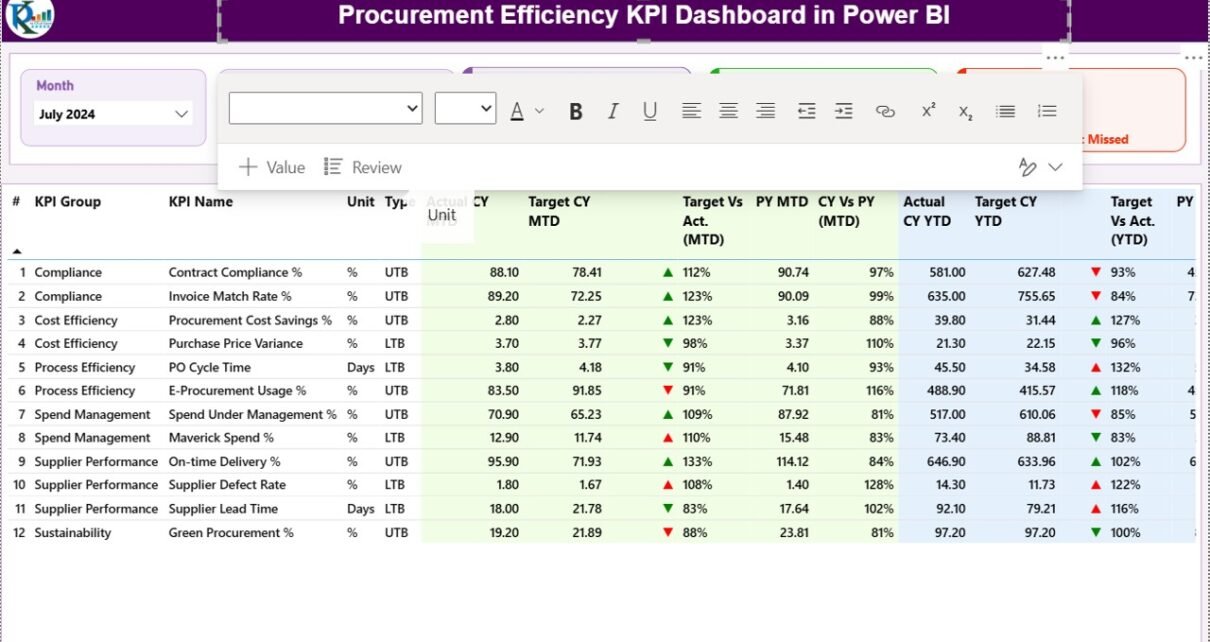
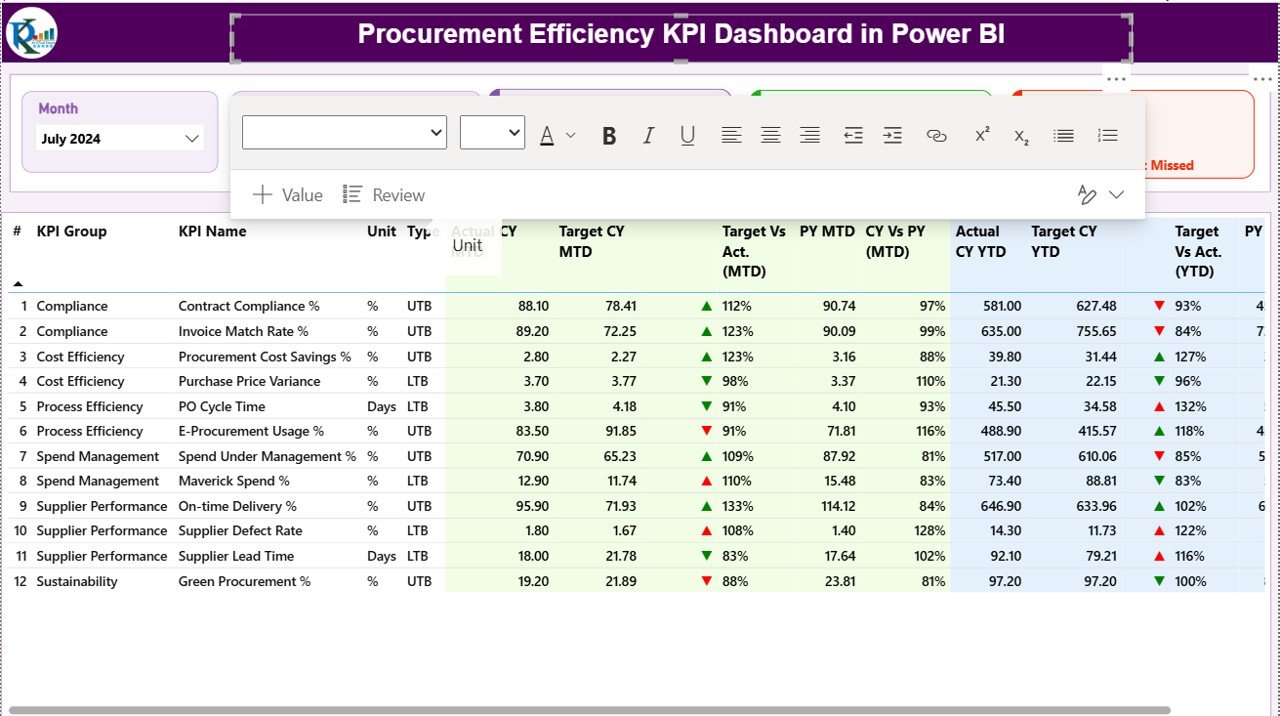
Summary Page – The Performance Overview
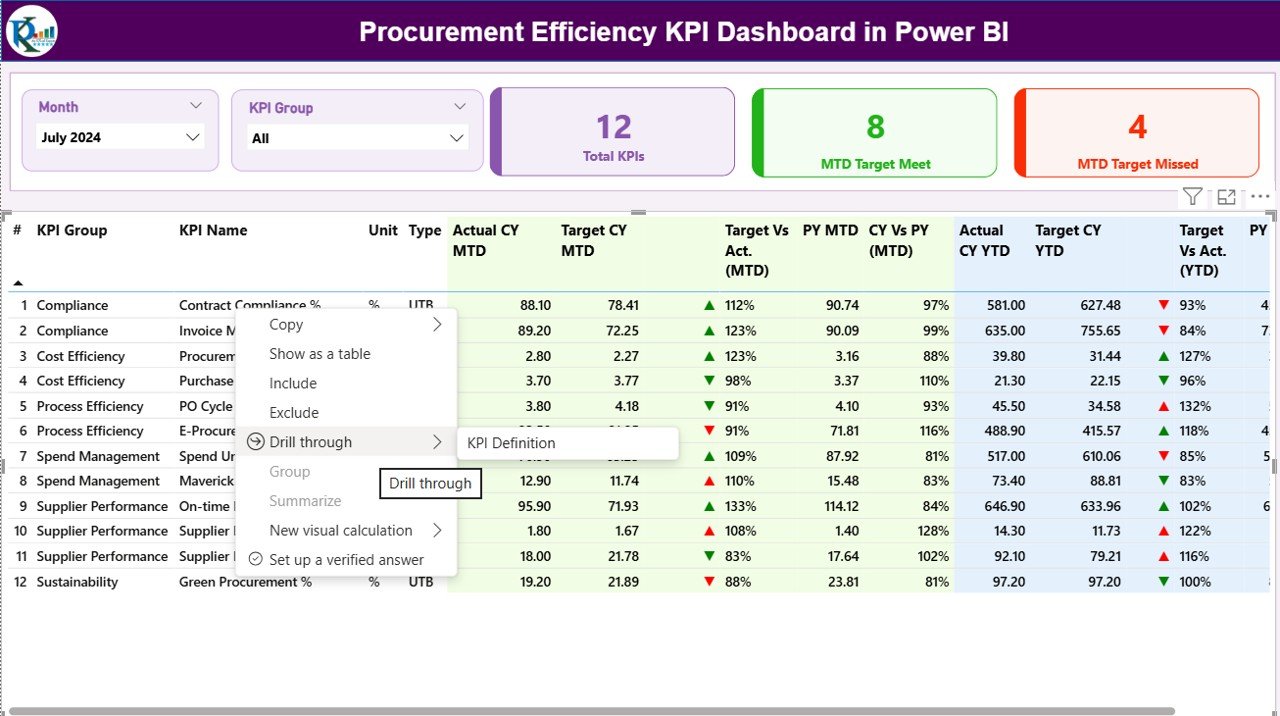
The Summary Page is the heart of the dashboard and provides an at-a-glance view of all procurement KPIs.
It includes slicers for Month and KPI Group at the top, allowing users to filter the data quickly.
Below the slicers, three key performance cards summarize:
- Total KPIs Count
- MTD Target Met Count
- MTD Target Missed Count
These cards immediately show how the procurement function is performing within the selected time frame.
The detailed table below these cards presents essential KPI data, including:
- KPI Number: Sequential identification number.
- KPI Group: Category such as Supplier Management, Purchase Order Efficiency, or Cost Control.
- KPI Name: Specific KPI being measured.
- Unit: Unit of measurement (e.g., %, Days, USD).
- Type: Indicates whether the KPI is Lower the Better (LTB) or Upper the Better (UTB).
- Actual CY MTD: Actual Month-to-Date (MTD) value for the current year.
- Target CY MTD: Target value for the same period.
- MTD Icon: Up (▲) or Down (▼) icons in green and red color, showing performance vs target.
- Target vs Actual (MTD): Percentage comparison between actual and target values.
- PY MTD: MTD data for the same period of the previous year.
- CY vs PY (MTD): Comparison between the current year and the previous year’s MTD numbers.
- Actual CY YTD: Actual Year-to-Date (YTD) number for the current year.
- Target CY YTD: Target YTD number for the current year.
- YTD Icon: Similar performance indicator for YTD numbers.
- Target vs Actual (YTD): YTD performance percentage.
- PY YTD: Previous year’s YTD number.
- CY vs PY (YTD): Comparison between current and previous year YTD results.
With these indicators, users can easily identify which KPIs are on track and which require immediate attention.
Click to buy Procurement Efficiency KPI Dashboard in Power BI
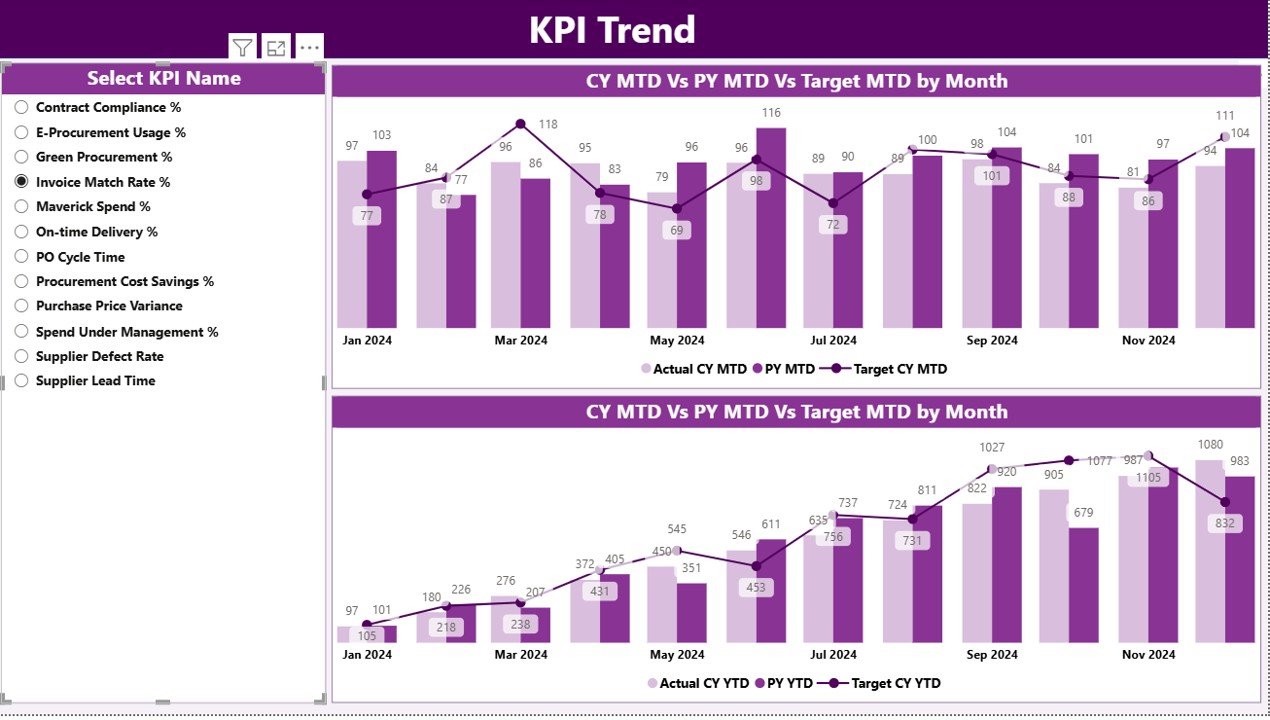
KPI Trend Page – Visualizing Performance Over Time
The KPI Trend Page allows users to explore performance trends across months for each KPI.
Here, two combo charts illustrate:
- MTD Trends: Comparing Current Year Actual, Previous Year Actual, and Target values for MTD.
- YTD Trends: Comparing Current Year Actual, Previous Year Actual, and Target values for YTD.
A slicer on the left enables the selection of specific KPI names. By choosing a KPI, users can observe its performance evolution over time, helping identify consistent improvements or recurring problems.
This page is especially useful for management reviews and quarterly procurement meetings where data-driven insights are essential.
Click to buy Procurement Efficiency KPI Dashboard in Power BI
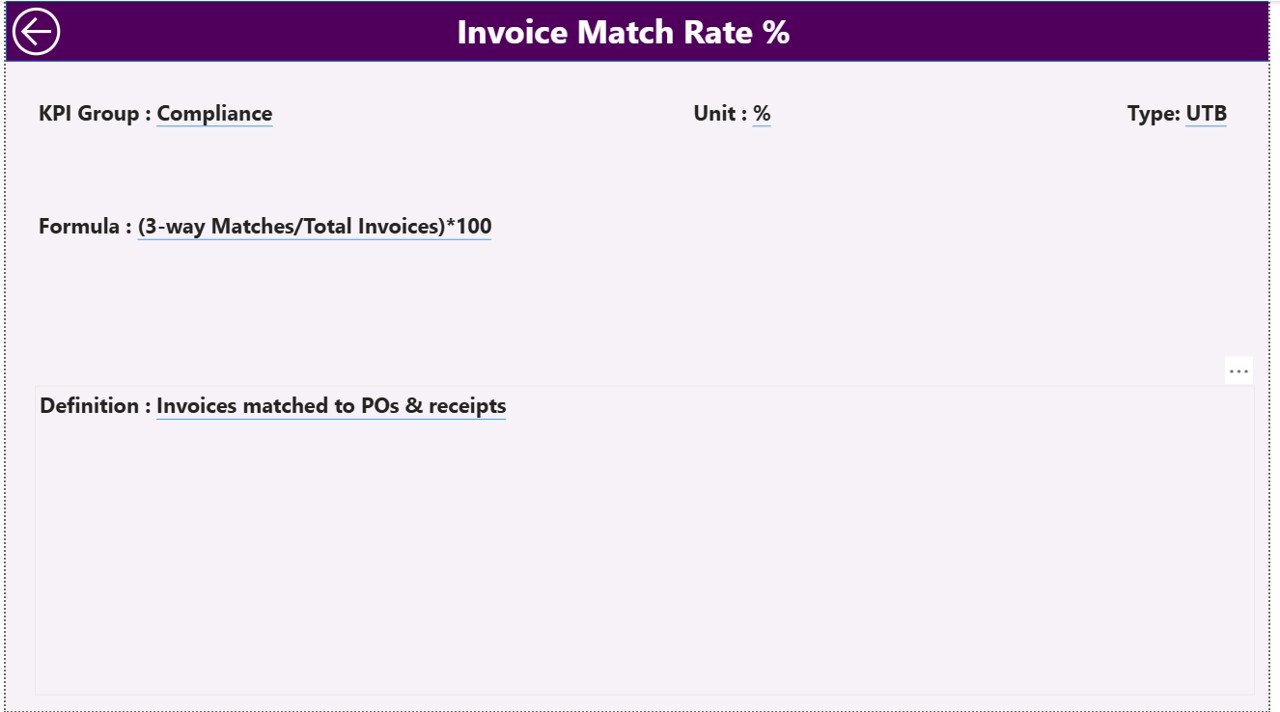
KPI Definition Page – Understanding the Metrics
The KPI Definition Page is a hidden drill-through page. From the Summary Page, users can right-click on any KPI and select Drill Through to open this page.
It provides detailed information about:
- KPI Formula: Calculation logic behind each KPI.
- KPI Definition: Description of what the KPI measures.
- Measurement Type: Whether the KPI is LTB (Lower the Better) or UTB (Upper the Better).
This feature improves transparency and helps new users or managers understand the logic behind the numbers they see on the main dashboard.
A Back Button on the top-left corner allows users to return to the main Summary Page effortlessly.
Excel Data Source Structure
The Power BI dashboard draws data from a structured Excel file that contains three worksheet tabs. This Excel file acts as the data backbone for the entire dashboard.
Input_Actual Sheet
This sheet stores the Actual performance data.
Each record includes:
- KPI Name
- Month (first day of the month, e.g., 01-Jan-2024)
- MTD Value
- YTD Value
Users must update this sheet regularly with actual numbers to ensure accurate reporting.
Input_Target Sheet
This sheet stores the Target data for the same KPIs and months.
Columns include:
- KPI Name
- Month (first day of the month)
- MTD Target
- YTD Target
These target numbers serve as benchmarks for measuring performance.
KPI Definition Sheet
This sheet defines the structure of each KPI, including:
- KPI Number
- KPI Group
- KPI Name
- Unit
- Formula
- Definition
- Type (LTB or UTB)
By keeping this data organized, Power BI can easily link, calculate, and visualize procurement performance with minimal manual effort.
Why Procurement Efficiency Matters
Procurement efficiency directly influences cost savings, supplier reliability, and operational agility. When organizations optimize their procurement processes, they can:
- Reduce procurement cycle times.
- Improve supplier performance.
- Lower purchase costs.
- Strengthen contract compliance.
- Improve visibility across the entire supply chain.
The Procurement Efficiency KPI Dashboard in Power BI helps achieve all of the above by delivering real-time insights that drive continuous improvement.
Advantages of the Procurement Efficiency KPI Dashboard in Power BI
Here are the major benefits of implementing this Power BI dashboard:
- Real-Time Decision Making
- Power BI connects to the Excel data source and updates visuals automatically. This ensures that stakeholders always see real-time procurement performance without manual reporting.
- Improved Visibility
- The dashboard consolidates all KPIs—such as purchase order cycle time, cost variance, and supplier lead time—into one unified interface, eliminating scattered data silos.
- Performance Benchmarking
- By comparing actual performance against targets (MTD/YTD), procurement teams can identify areas where performance meets or exceeds expectations and where improvement is required.
- Year-over-Year Analysis
- With the CY vs PY comparison, users can measure performance improvement trends over time, helping evaluate long-term strategic success.
- Interactive Visuals and Drill-Through
- Users can interact with slicers, click on visuals, and drill through to detailed KPI definitions. This interactivity makes analysis more engaging and insightful.
- Data Transparency
- The KPI Definition page ensures all users understand the calculation method and purpose of each KPI, fostering clarity and accountability.
- Easy Integration and Maintenance
- Because it uses Excel as the data source, updating and maintaining the dashboard is simple—even for non-technical users.
- Enhanced Reporting
- The dashboard replaces lengthy manual reports with dynamic visuals, saving time and improving presentation quality for management meetings.
Best Practices for Using the Procurement Efficiency KPI Dashboard
To get the most value from your dashboard, follow these best practices:
- Keep the Data Updated
- Ensure that the Input_Actual and Input_Target sheets are updated regularly—ideally monthly. Fresh data maintains the accuracy of visuals and KPIs.
- Define Clear KPI Ownership
- Assign responsible persons for each KPI to maintain data integrity and accountability.
- Use Consistent KPI Definitions
- Avoid confusion by maintaining standard definitions and formulas across teams and time periods.
- Monitor Trends, Not Just Numbers
- Focus on analyzing MTD and YTD trends to identify patterns. For example, if cost savings dip for three consecutive months, investigate the root cause.
- Utilize Drill-Throughs for Deeper Insight
- Encourage users to explore KPI details through drill-through functionality. Understanding the formula and definition helps interpret results more accurately.
- Keep Visuals Simple
- Do not overcrowd the dashboard. Use simple, clean visuals that quickly convey the message.
- Automate Data Refresh
- If possible, automate the Excel-to-Power BI data refresh using Power BI Service, ensuring your dashboard is always up to date.
- Use Color Indicators Wisely
- Use green for good performance and red for underperformance. Consistent color coding enhances understanding at a glance.
- Review Performance Monthly
- Set up a monthly review process where teams analyze KPI results, discuss deviations, and implement improvement actions.
How to Build the Procurement Efficiency KPI Dashboard in Power BI
Building this dashboard involves these main steps:
- Prepare the Excel Data Source:
Create and populate the three required worksheets—Input_Actual, Input_Target, and KPI Definition. - Load Data into Power BI:
Connect Power BI Desktop to your Excel file and load all sheets. - Create Relationships:
Use the Model View to establish relationships between KPI Name and Month across all tables. - Build Measures:
Write DAX formulas to calculate MTD and YTD comparisons, such as: - Target vs Actual (%) = DIVIDE([Actual MTD], [Target MTD])
- CY vs PY (%) = DIVIDE([Actual MTD], [PY MTD])
- Design the Summary Page:
Add slicers, KPI cards, and a detailed performance table using icons and conditional formatting. - Design KPI Trend Page:
Create combo charts showing MTD and YTD trends across months. - Add Drill-Through Functionality:
Link the KPI Definition page to provide deeper explanations and navigation. - Publish and Share:
Publish the dashboard to Power BI Service and share it with stakeholders for collaborative access.
Conclusion
The Procurement Efficiency KPI Dashboard in Power BI is an indispensable tool for modern procurement teams. It combines performance tracking, trend analysis, and data visualization in a single platform, ensuring that every decision is backed by reliable insights.
By leveraging this dashboard, organizations can streamline procurement operations, reduce costs, and enhance supplier relationships—ultimately driving better business outcomes.
From monitoring monthly targets to analyzing year-over-year improvements, this dashboard provides everything procurement professionals need to measure, manage, and improve efficiency effectively.
Frequently Asked Questions (FAQs)
- What is the purpose of a Procurement Efficiency KPI Dashboard?
- It helps track and analyze procurement performance metrics such as cost savings, supplier performance, and order cycle times. It allows decision-makers to identify inefficiencies and improve procurement operations.
- Why use Power BI for procurement dashboards?
- Power BI offers dynamic visuals, easy data integration, drill-through functionality, and automated updates—making it ideal for tracking procurement KPIs effectively.
- Can the dashboard be customized for specific industries?
- Yes. The dashboard structure is flexible and can be adapted for manufacturing, retail, healthcare, or government procurement processes.
- What data sources can be used besides Excel?
- While this version uses Excel, Power BI supports other data sources such as SQL Server, SharePoint, Google Sheets, and cloud-based ERP systems.
- How often should the data be updated?
- Ideally, update the Excel sheets monthly or automate the refresh in Power BI Service for real-time updates.
- Do I need Power BI Pro to share this dashboard?
- If you want to share it online with other users securely, a Power BI Pro license is recommended.
- What are common KPIs to include in procurement efficiency tracking?
- Examples include:
- Purchase Order Cycle Time
- Supplier On-Time Delivery %
- Cost Savings %
- Contract Compliance Rate
- Procurement ROI
- Can I export visuals from Power BI?
Yes, Power BI allows exporting visuals or full reports to PDF, PowerPoint, or Excel for presentations.
Visit our YouTube channel to learn step-by-step video tutorials
Watch the step-by-step video tutorial:
Click to buy Procurement Efficiency KPI Dashboard in Power BI