In today’s fast-moving business environment, professional training and coaching play a vital role in developing employee skills, leadership abilities, and organizational performance. However, without proper measurement, it becomes difficult to track progress or prove the return on investment (ROI) of training initiatives.Professional Training & Coaching KPI Dashboard in Excel
That’s where the Professional Training & Coaching KPI Dashboard in Excel comes in. This ready-to-use Excel dashboard helps training managers, HR professionals, and learning consultants monitor key performance indicators (KPIs), evaluate training effectiveness, and make data-driven decisions.
By consolidating performance data into one visual interface, this dashboard allows you to see how your training programs contribute to individual growth, team productivity, and company success.
Click to buy Professional Training & Coaching KPI Dashboard in Excel
What Is a Professional Training & Coaching KPI Dashboard?
A Professional Training & Coaching KPI Dashboard is an interactive Excel-based tool that helps organizations analyze the effectiveness of their learning and development programs. It tracks various KPIs such as training attendance, completion rate, feedback scores, cost per participant, and post-training performance improvement.
The dashboard automatically updates based on the month selected and displays Month-to-Date (MTD) and Year-to-Date (YTD) results against set targets and previous year data. With built-in formulas, visual indicators, and charts, it transforms complex training data into easy-to-understand insights.Professional Training & Coaching KPI Dashboard in Excel
Key Features of the Professional Training & Coaching KPI Dashboard
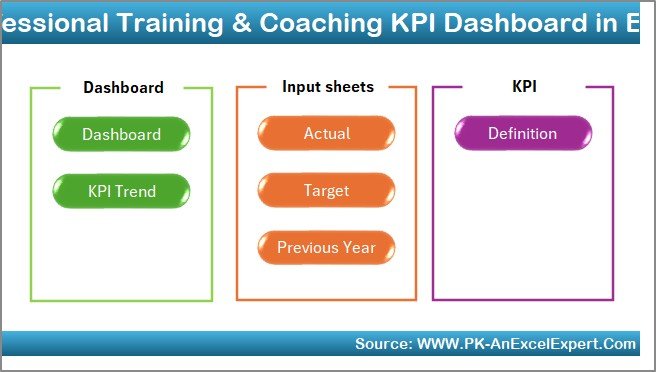
The dashboard is built with seven well-structured worksheets, each serving a unique purpose. Let’s explore them in detail.Professional Training & Coaching KPI Dashboard in Excel
Home Sheet
The Home sheet serves as your navigation hub. It includes six smart buttons that let you jump instantly to other sections of the dashboard — such as KPI Trends, Actuals, Targets, and more.Professional Training & Coaching KPI Dashboard in Excel
This sheet makes it easy to access different parts of the workbook without scrolling or searching.
Click to buy Professional Training & Coaching KPI Dashboard in Excel
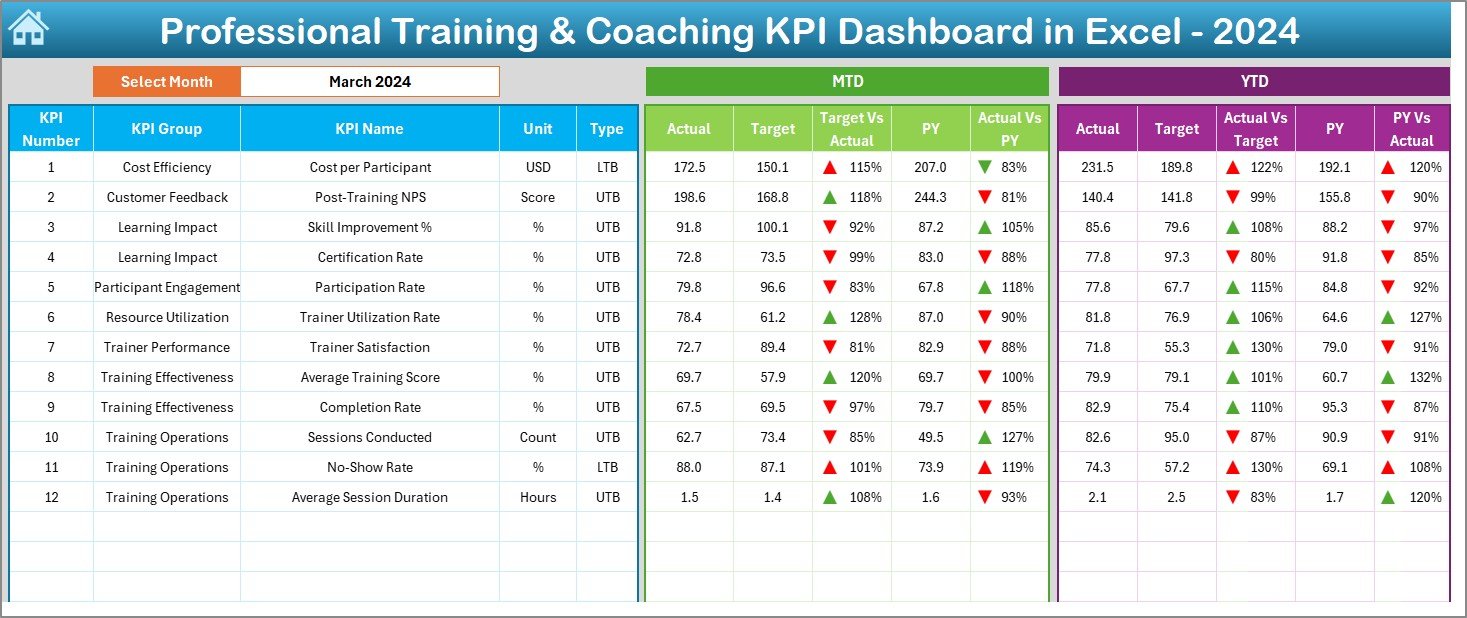
Dashboard Sheet Tab
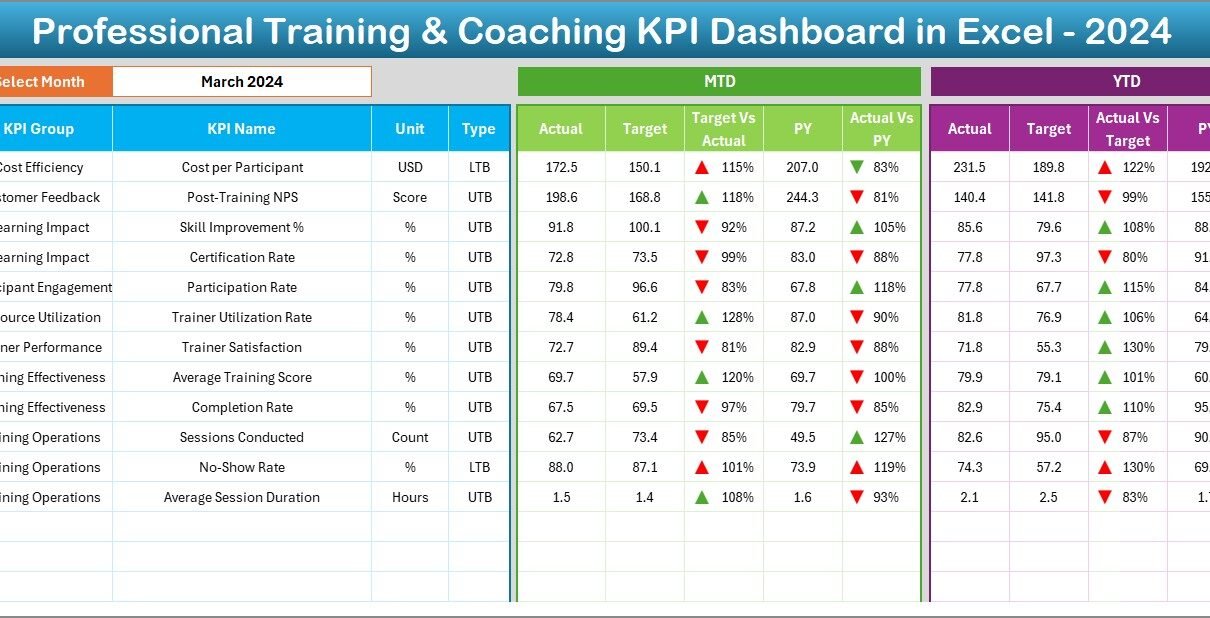
This is the main analytical sheet where all performance insights come together.
- You can select a Month from the drop-down menu in cell D3 to update the visuals dynamically.
- It displays both MTD and YTD Actual vs. Target data along with Previous Year comparisons.
- The dashboard uses conditional formatting with up/down arrows to indicate performance improvements or declines.
- It provides a clear, visual overview of all KPIs, making it ideal for management reviews and progress meetings.
With this dashboard, you can instantly identify which KPIs are on track and which ones need attention.
Click to buy Professional Training & Coaching KPI Dashboard in Excel
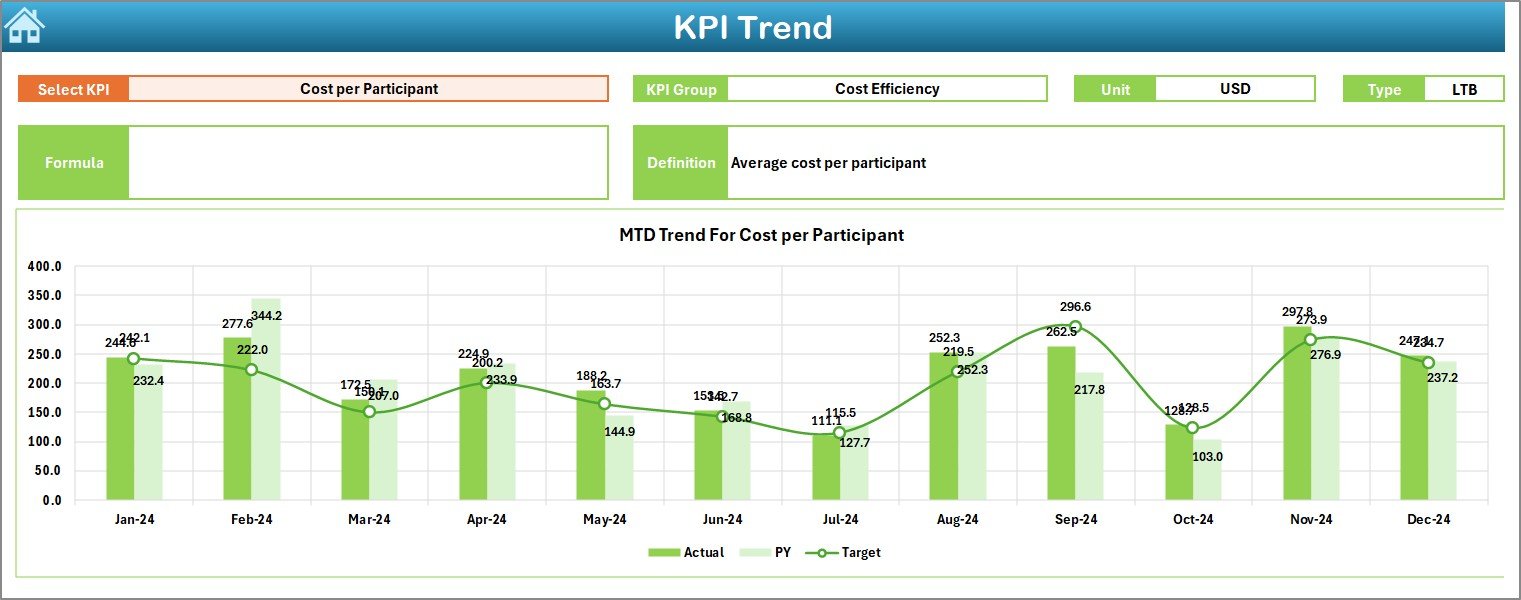
KPI Trend Sheet Tab
This tab focuses on detailed performance trends.
- You can select any KPI from a drop-down (C3) to analyze its performance over time.
- The sheet shows information such as KPI Group, Unit, Type (LTB or UTB), Formula, and Definition.
- It features MTD and YTD trend charts that visualize Actual, Target, and Previous Year (PY) data for deeper insights.
This trend analysis helps identify long-term improvements, seasonal variations, and areas that require additional training or resources.
Click to buy Professional Training & Coaching KPI Dashboard in Excel
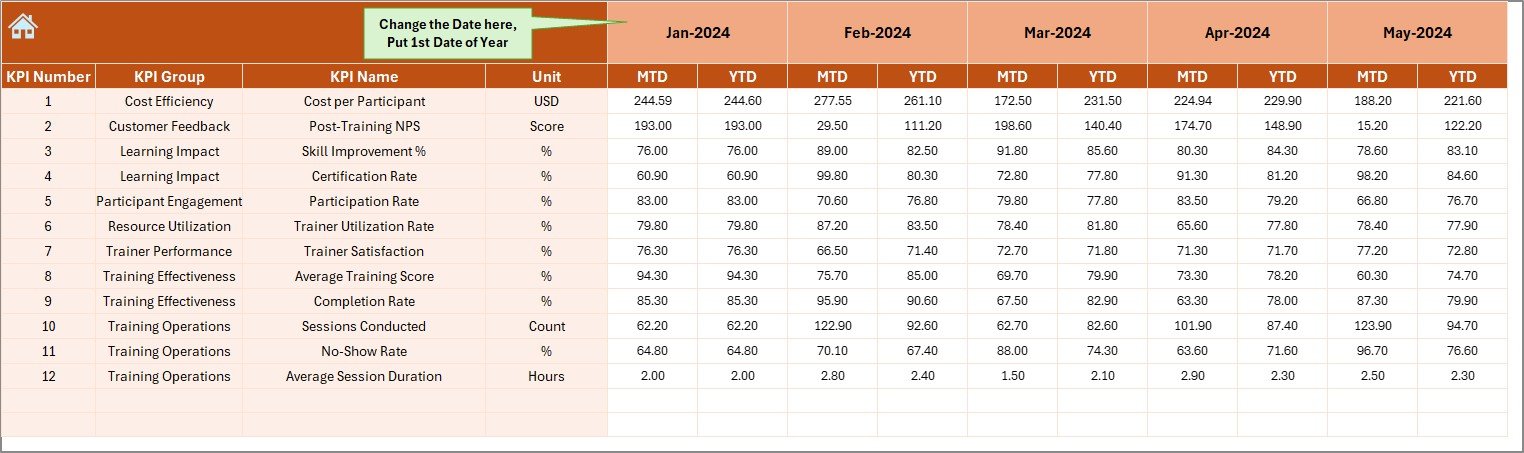
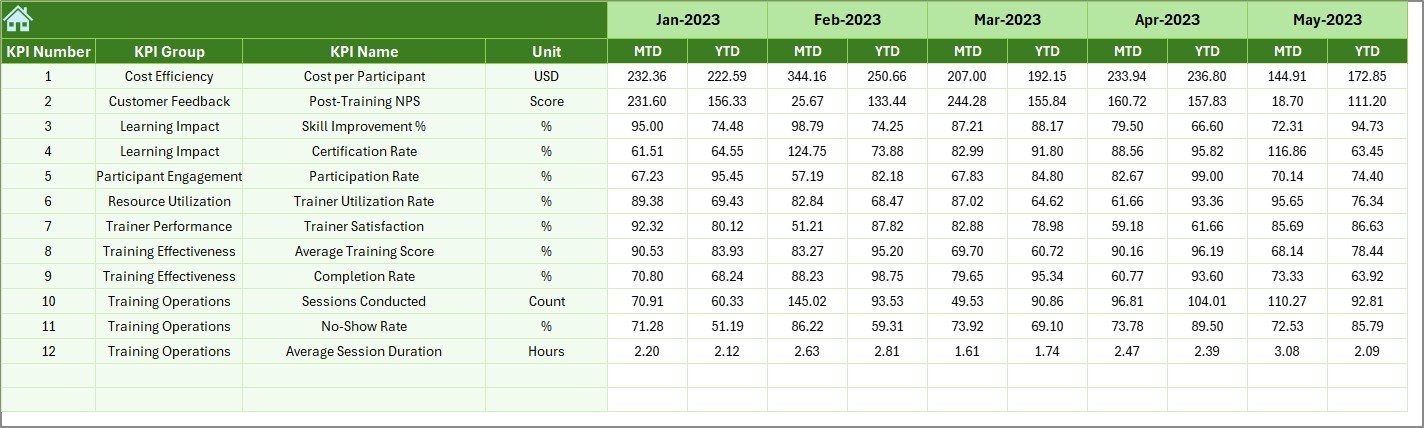
Actual Numbers Input Sheet
This is where you enter your monthly performance data.
- Input MTD and YTD Actual numbers for each KPI.
- The month can be changed dynamically from cell E1 — just enter the first month of the year to set your reporting cycle.
- Data entered here automatically flows into all relevant dashboard sections.
This structure ensures accuracy and keeps your dashboard data centralized.
Click to buy Professional Training & Coaching KPI Dashboard in Excel
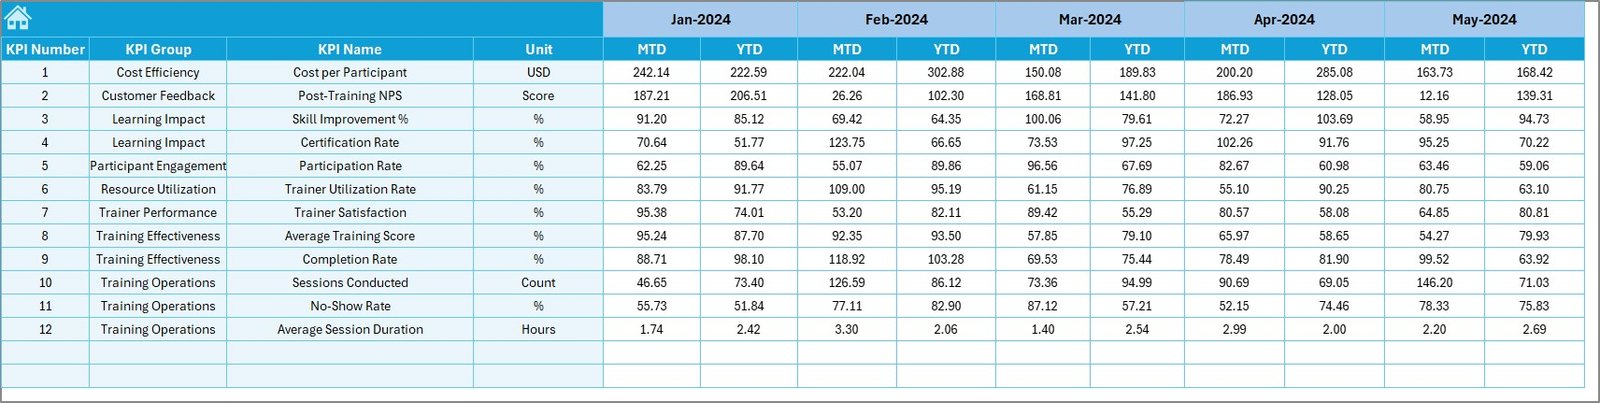
Target Sheet Tab
In this section, you define performance targets for each KPI.
- Input MTD and YTD targets for every KPI by month.
- The dashboard compares these targets with actual data to calculate variances.
- Conditional formatting highlights whether each KPI is above or below target.
Setting clear, measurable targets helps maintain accountability and ensures your training initiatives align with business goals.
Click to buy Professional Training & Coaching KPI Dashboard in Excel
Previous Year Numbers Sheet Tab
This sheet stores historical data from the previous year for comparison purposes.
By analyzing how current results perform against last year’s outcomes, you can evaluate progress and determine whether your training strategies are evolving effectively.
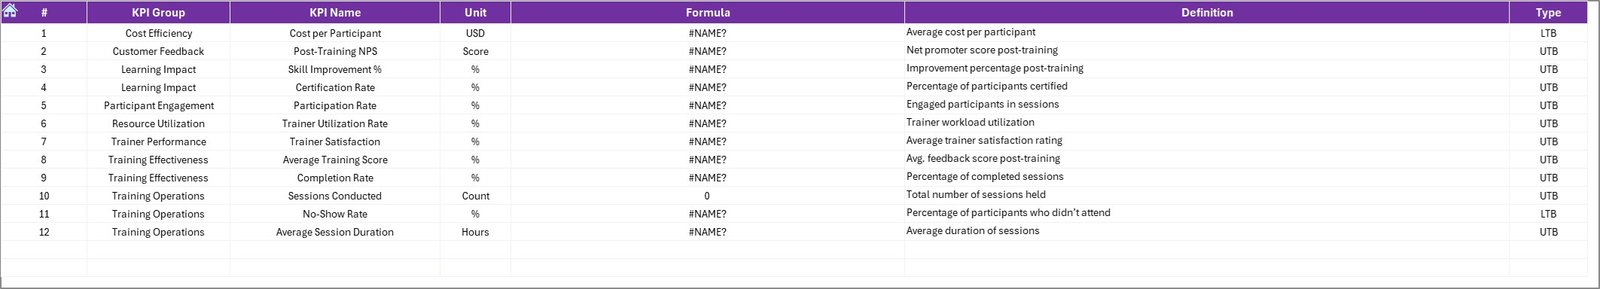
KPI Definition Sheet Tab
This sheet serves as a reference database for all KPIs used in the dashboard.
Each KPI entry includes:
- KPI Name
- KPI Group
- Unit of Measure
- Formula
- Definition
This ensures consistency and helps new users quickly understand each performance metric.
Why Use a KPI Dashboard for Training and Coaching?
Implementing a structured KPI dashboard brings clarity and precision to your training management. Here are some key reasons to adopt one:
- Track Training Effectiveness
Measure the success of training sessions by comparing actual performance improvements with goals.
- Align Learning with Business Objectives
Ensure your training programs directly contribute to company performance and strategic goals.
- Identify Skill Gaps
Easily identify where additional coaching or reskilling is needed to boost overall productivity.
- Improve Budget Efficiency
Monitor training costs, ROI, and participant engagement to optimize resources.
- Simplify Reporting
Instead of compiling manual reports, use visual dashboards that automatically refresh with the latest data.
Advantages of the Professional Training & Coaching KPI Dashboard
Using this Excel-based dashboard offers numerous advantages for training professionals and organizations alike:
- Centralized Data Management: Consolidate all performance data in one structured workbook.
- Instant Visual Insights: Quickly interpret KPI results using intuitive charts and conditional formatting.
- Time Savings: Automate reporting and reduce manual calculations.
- Data-Driven Decisions: Rely on factual performance metrics instead of assumptions.
- Scalability: Add or modify KPIs as your training strategy evolves.
- Accessibility: Built entirely in Excel — no need for specialized software or coding knowledge.
- Performance Transparency: Share progress reports easily with management and stakeholders.
How Does the Dashboard Work?
The Professional Training & Coaching KPI Dashboard combines Excel formulas, data validation lists, and visual charts to create a dynamic analysis environment.
Here’s how it works step-by-step:
- Data Input:
Enter Actual, Target, and Previous Year data in their respective sheets. - Automatic Calculations:
Formulas calculate MTD and YTD progress, variances, and performance indicators. - Visualization:
Charts and arrows dynamically update based on user selection (month or KPI). - Analysis:
Compare actual results against targets and previous years to evaluate performance. - Decision-Making:
Use visual trends to refine coaching plans, allocate resources, and improve employee engagement.
How to Use the Dashboard Effectively
To get maximum value from your Professional Training & Coaching KPI Dashboard, follow these best practices:
- Set SMART KPIs
Ensure each KPI is Specific, Measurable, Achievable, Relevant, and Time-bound. - Update Data Regularly
Enter actual data at the end of each month to keep the dashboard current. - Review Trends Quarterly
Use trend charts to monitor progress and adjust strategies as needed. - Engage Stakeholders
Share visual reports with leadership, HR teams, and department heads. - Track Both Quantitative and Qualitative Data
Combine numerical KPIs with feedback ratings and satisfaction surveys. - Use Conditional Formatting for Alerts
Highlight underperforming KPIs in red to take timely corrective action.
Best Practices for the Professional Training & Coaching KPI Dashboard
- Keep Your Data Clean: Always validate entries to prevent calculation errors.
- Avoid Overloading the Dashboard: Focus on meaningful KPIs that align with strategic goals.
- Compare Year-over-Year Trends: Identify long-term improvements.
- Incorporate Feedback Loops: Use results to refine upcoming training sessions.
- Customize Charts and Colors: Maintain visual consistency with your company’s branding.
- Automate Repetitive Tasks: Use Excel macros or formulas to speed up monthly updates.
Following these practices ensures accuracy, clarity, and sustained improvement.
Conclusion
The Professional Training & Coaching KPI Dashboard in Excel transforms how organizations manage and evaluate training programs. It combines clarity, precision, and automation to deliver meaningful insights that drive improvement.
By using this tool, HR professionals and training managers can easily monitor KPIs, analyze performance trends, and align learning initiatives with strategic business outcomes. Whether you’re running small workshops or large-scale leadership programs, this dashboard empowers you to measure what matters most — and continuously enhance your organization’s learning culture.
Frequently Asked Questions (FAQs)
- What is the purpose of a Training & Coaching KPI Dashboard?
It helps organizations measure the effectiveness of their training and coaching programs using key performance indicators and visual analysis tools.Professional Training & Coaching KPI Dashboard in Excel
- Can I customize the dashboard for my organization?
Yes. Since it’s built in Excel, you can easily modify KPIs, add departments, or change visuals to match your specific needs.
- How often should I update the data?
Update it monthly or after each training session to ensure accuracy and real-time insights.Professional Training & Coaching KPI Dashboard in Excel
- What skills are required to use this dashboard?
Basic Excel knowledge is enough. The dashboard uses formulas and drop-downs — no coding required.
- Can it calculate ROI for training programs?
Absolutely. You can include KPIs like Training Cost vs. Performance Improvement to estimate ROI.
- Does it support Year-to-Date and Month-to-Date tracking?
Yes, it provides both MTD and YTD data views with actual vs. target and previous year comparisons.
- How can this dashboard help HR teams?
It allows HR teams to monitor employee progress, evaluate trainers, and improve training effectiveness across the organization.
Visit our YouTube channel to learn step-by-step video tutorials
Watch the step-by-step video tutorial:
Click to buy Professional Training & Coaching KPI Dashboard in Excel