In the ever-evolving world of healthcare, public health organizations face increasing pressure to deliver measurable results. From tracking disease outbreaks to evaluating vaccination coverage, every decision must rely on accurate data. That’s where a Public Health KPI Scorecard in Excel becomes a game-changing tool.
This ready-to-use Excel template enables health departments, NGOs, hospitals, and policymakers to monitor critical performance indicators (KPIs) in real time. It transforms raw data into actionable insights, allowing teams to measure progress, identify gaps, and make data-driven improvements.
In this article, we’ll explore everything about the Public Health KPI Scorecard in Excel—its structure, features, benefits, and best practices. You’ll also learn how to use it effectively to improve health outcomes and achieve your public health goals.
Click to buy Public Health KPI Scorecard in Excel
What Is a Public Health KPI Scorecard in Excel?
A Public Health KPI Scorecard in Excel is an interactive, data-driven tool designed to help public health professionals monitor and evaluate key performance metrics. It consolidates multiple indicators—such as disease prevention rates, immunization coverage, mortality ratios, and healthcare accessibility—into one easy-to-understand dashboard.
Instead of dealing with scattered reports or complex databases, users can rely on this scorecard to:
- View Month-to-Date (MTD) and Year-to-Date (YTD) performance.
- Compare Actual vs Target results for each KPI.
- Analyze trends over time through charts and visual cues.
- Track progress toward public health goals.
This Excel-based scorecard simplifies data analysis for both small and large organizations, making it suitable for local health offices, regional health authorities, or national monitoring teams.
Structure of the Public Health KPI Scorecard in Excel
The scorecard is organized into four main worksheets, each designed for a specific function. Together, they provide a complete view of performance measurement and trend analysis.
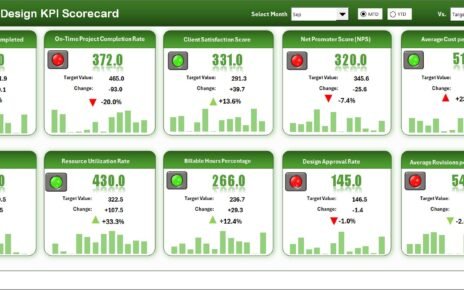
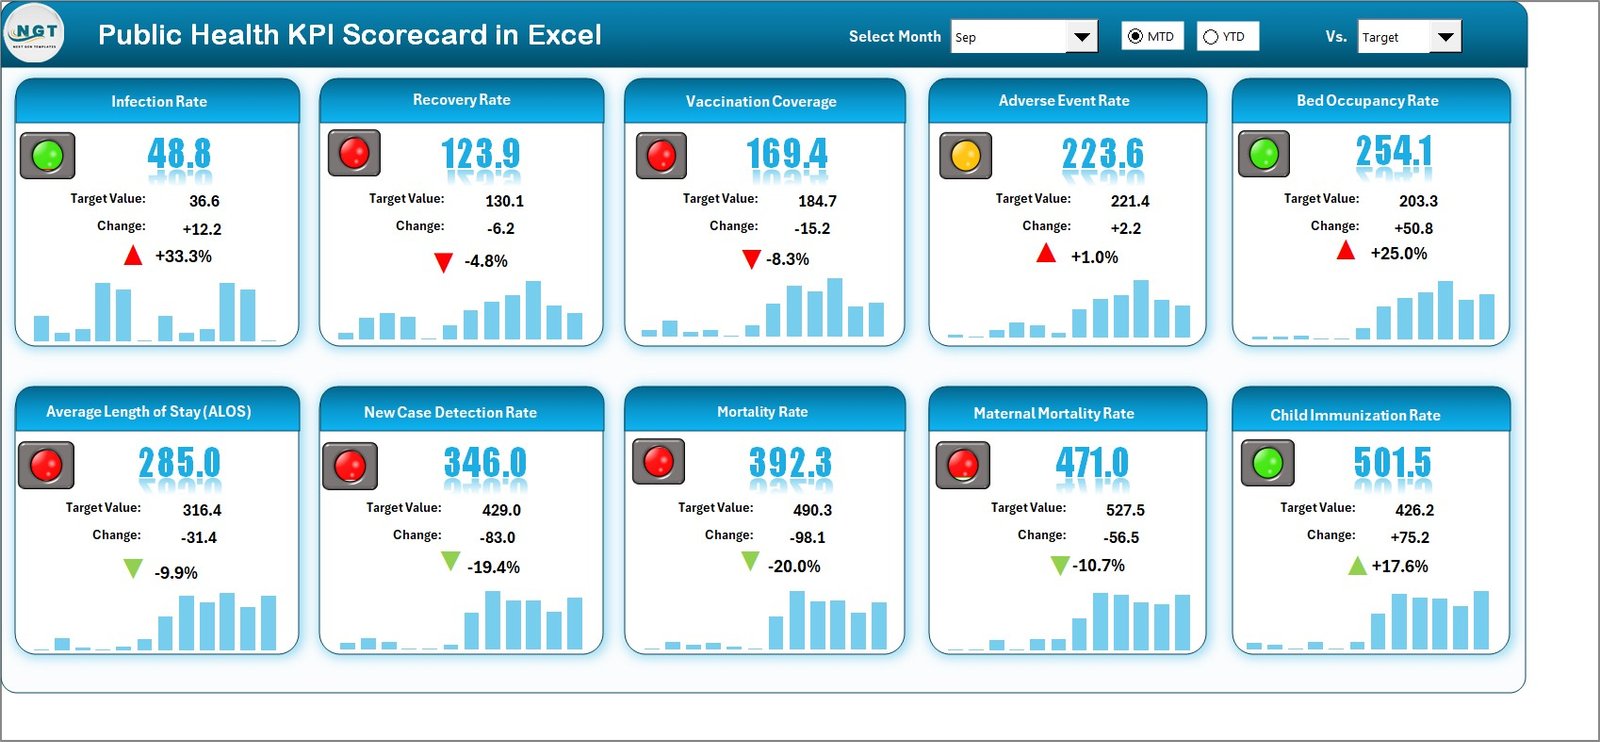
Scorecard Sheet — The Main Dashboard
The Scorecard Sheet is the core of the template. It acts as the main interface where users view all KPIs and performance insights in a clean, visual layout.
Key Features:
- Dropdown Menus: Select the reporting month or switch between MTD and YTD analysis easily.
- Actual vs Target Comparison: Instantly compare actual outcomes with the defined targets for every KPI.
- Visual Indicators: Use color-coded formatting (like green for achieved and red for missed) to highlight performance status.
- Comprehensive Overview: Displays 10 KPIs per view, offering a quick snapshot of all performance areas without clutter.
With this sheet, public health officials can quickly see which programs are meeting expectations and which need attention.
Click to buy Public Health KPI Scorecard in Excel
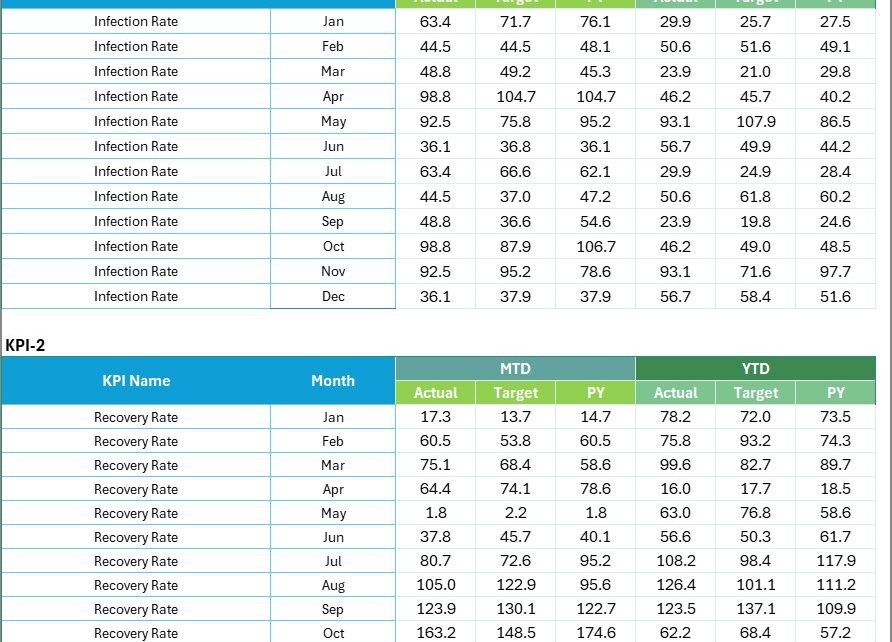
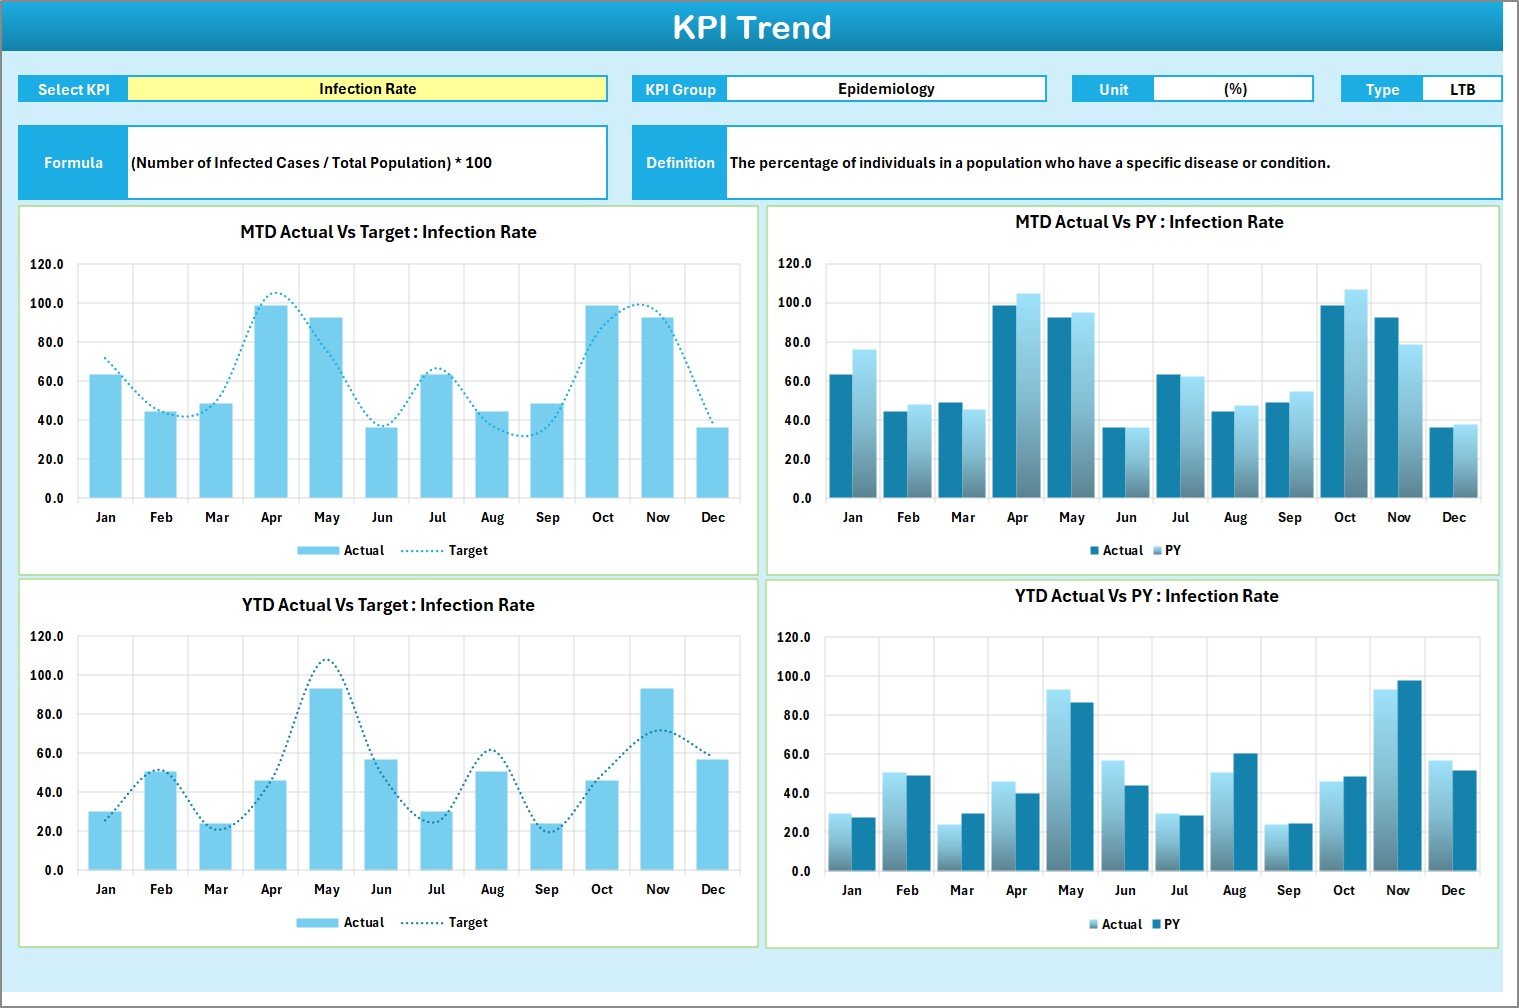
KPI Trend Sheet — Analyze Progress Over Time
The KPI Trend Sheet focuses on time-based performance tracking. It helps users visualize the progress of each KPI over months or years, identifying whether the organization is improving or lagging.
Features of the KPI Trend Sheet:
- Dynamic Dropdown Selection: Choose the KPI name using the dropdown in cell C3.
- Detailed KPI Info: Displays KPI Group, Unit, Type (Lower the Better or Upper the Better), Formula, and Definition.
- Trend Charts: View side-by-side charts showing MTD and YTD trends for Actual, Target, and Previous Year (PY) values.
These charts are particularly valuable for identifying long-term patterns, such as seasonal variations in infection rates or year-over-year improvements in vaccination coverage.
Click to buy Public Health KPI Scorecard in Excel
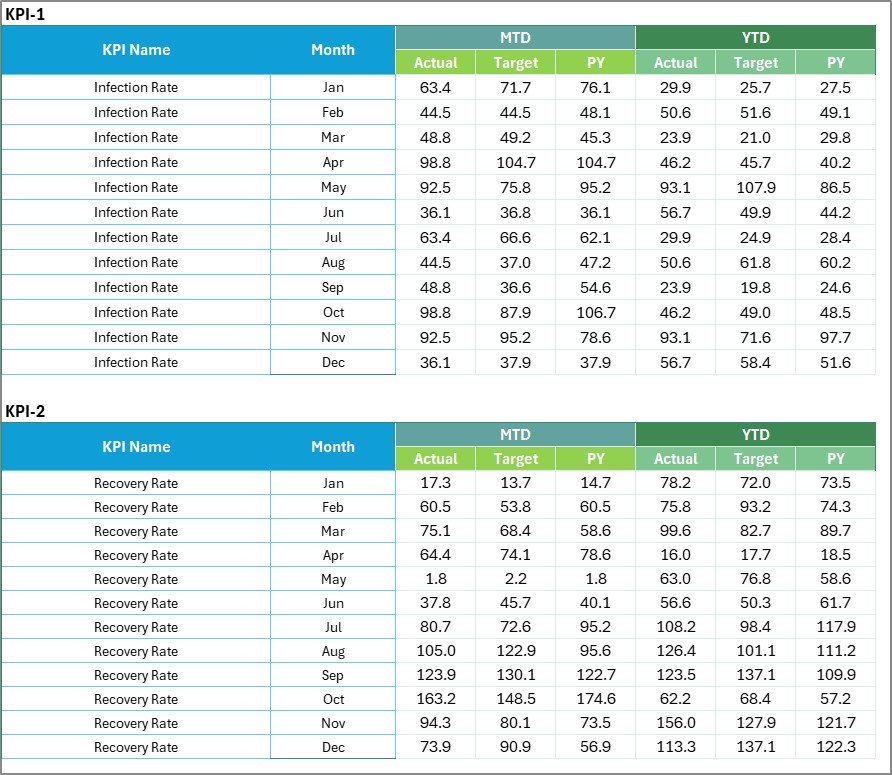
Input Data Sheet — Data Entry and Management
The Input Data Sheet is the foundation of the entire scorecard. It’s where you record and maintain all KPI data for analysis.
Key Highlights:
- Data Entry Flexibility: Enter actual values, targets, and supporting figures for every KPI.
- Continuous Updates: As new results come in, update this sheet to keep the dashboard live and accurate.
- Ease of Use: Clear structure and organized columns make data management simple, even for non-technical users.
This sheet ensures your scorecard remains accurate, dynamic, and ready for decision-making at any moment.
Click to buy Public Health KPI Scorecard in Excel
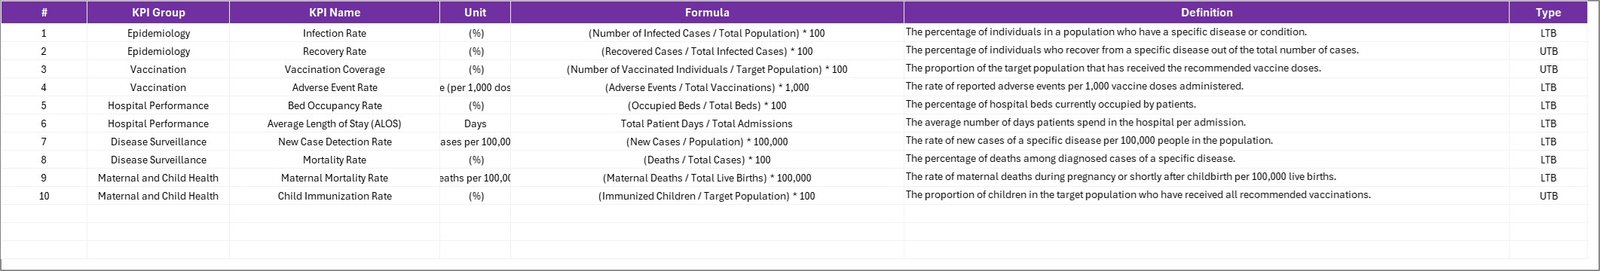
KPI Definition Sheet — Building the Framework
The KPI Definition Sheet is where users define all key performance indicators and their details.
This sheet includes columns such as:
- KPI Name: Clearly identify each performance metric.
- KPI Group: Categorize indicators (e.g., Immunization, Disease Surveillance, Maternal Health).
- Unit: Define measurement units like %, Rate per 1,000 population, or Absolute Count.
- Formula: Document how each KPI is calculated to ensure consistency.
- Definition: Explain the KPI’s meaning and purpose for clarity.
By maintaining a structured KPI definition table, organizations can ensure everyone understands how each metric is derived and what it represents.
Why Is KPI Tracking Important in Public Health?
Public health initiatives require measurable evidence to assess impact. Without proper tracking, decision-making becomes guesswork. KPI tracking helps bridge this gap by providing factual insights into program effectiveness.
Advantages of Using the Public Health KPI Scorecard in Excel
Using this Excel-based tool offers numerous benefits that go beyond basic tracking. Let’s explore the top advantages:
- Centralized Data Management
All your performance metrics are available in one file, making it easy to manage, update, and share across teams.
- Real-Time Performance Insights
Dynamic formulas and charts enable instant updates. The moment you enter new data, the visuals and KPIs adjust automatically.
- Cost-Effective and Accessible
Unlike costly software platforms, Excel is widely available and easy to use—no coding or specialized training needed.
- Visual Analysis Made Easy
Color coding, trend lines, and conditional formatting simplify complex data, making interpretation quick and intuitive.
- Supports Strategic Planning
Helps leadership teams align programs with performance outcomes, ensuring better allocation of resources.
- Encourages Transparency
Stakeholders and funders can see exactly how programs perform, promoting trust and accountability.
How to Use the Public Health KPI Scorecard in Excel Effectively
To get the most out of this tool, follow these steps for effective implementation:
- Define Your KPIs Clearly: Start by listing all critical health indicators relevant to your organization.
- Set Realistic Targets: Ensure each KPI has measurable and achievable goals.
- Collect Quality Data: Gather data from verified sources—surveys, health management systems, or regional reports.
- Update Regularly: Refresh the Input Data Sheet periodically to maintain accuracy.
- Review Trends: Use the KPI Trend Sheet to identify recurring patterns or anomalies.
- Act on Insights: Use findings to guide policy decisions and operational improvements.
Following this process transforms your scorecard from a static report into a strategic decision-making tool.
Best Practices for the Public Health KPI Scorecard in Excel
To ensure reliable results and long-term usability, follow these best practices:
- Maintain Consistent Data Formats: Use standard units and formats for all data entries.
- Automate Calculations: Use Excel formulas to reduce manual errors.
- Validate Data Regularly: Check for inconsistencies or missing values.
- Use Protected Sheets: Lock formulas and structure to prevent accidental edits.
- Integrate Visual Alerts: Use icons or traffic-light indicators to highlight KPI status.
- Encourage Collaboration: Share the scorecard with all stakeholders for joint decision-making.
- Document All Changes: Keep a version log to track updates over time.
By following these practices, you’ll ensure that your KPI scorecard remains accurate, efficient, and effective.
Tips to Customize the KPI Scorecard
Every public health organization has unique objectives. Fortunately, this scorecard is flexible enough for customization.
You can:
- Add or remove KPIs based on your region’s needs.
- Modify chart types (line, bar, combo) to better visualize trends.
- Create region-wise or department-wise filters.
- Integrate Excel Power Query for automated data import.
- Include a “Performance Summary” sheet for executive reporting.
Such personalization helps make the tool perfectly aligned with your operational requirements.
Common Challenges in Public Health KPI Monitoring
Even with a great tool, some challenges can arise during implementation. Understanding them early helps you overcome potential barriers.
- Data Inconsistency
Different departments may use varying data formats. Regular training and clear guidelines solve this issue.
- Incomplete Reporting
Some metrics may lack updated data. Establishing clear reporting timelines ensures completeness.
- Misinterpretation of Results
Not everyone is trained in data analysis. Simplified visuals and training sessions improve understanding.
- Lack of Accountability
When KPIs are not assigned clearly, progress slows. Assign responsibility for each metric to specific individuals or teams.
- Overloaded Dashboards
Too many KPIs can overwhelm users. Focus on key indicators that align with strategic goals.
Addressing these challenges ensures your scorecard remains reliable and actionable.
Conclusion
The Public Health KPI Scorecard in Excel is more than just a spreadsheet—it’s a complete performance management solution. By turning complex data into visual insights, it empowers public health professionals to make informed, timely, and impactful decisions.
Whether you’re tracking vaccination campaigns, analyzing mortality rates, or assessing hospital performance, this Excel scorecard simplifies your workflow, improves accuracy, and drives continuous improvement.
With structured data entry, visual analysis, and trend tracking, it offers everything needed for evidence-based public health management.
Start using the Public Health KPI Scorecard in Excel today, and experience how clarity and data-driven decisions can transform health outcomes across your organization.
Frequently Asked Questions (FAQs)
- What is the purpose of a Public Health KPI Scorecard?
The purpose is to track, measure, and evaluate the performance of public health programs. It helps managers assess effectiveness, identify gaps, and make data-backed decisions.
- Can I customize the KPIs in this Excel template?
Yes. The scorecard allows full customization. You can add, remove, or modify KPIs based on your organization’s focus areas.
- How often should I update the scorecard?
You should update it monthly for MTD and quarterly or annually for YTD reviews. Regular updates ensure accuracy and relevance.
- Do I need technical skills to use it?
Not at all. The scorecard is designed for ease of use with simple dropdowns, formulas, and pre-built visuals. Basic Excel knowledge is sufficient.
- Can this scorecard handle large datasets?
Yes. Excel supports large datasets efficiently, especially when using tables and pivot charts. For very large data, you can link it with Power BI or Access.
- How is this different from other reporting tools?
Unlike complex software platforms, this scorecard is affordable, offline, and easy to maintain—ideal for both small and large organizations.
- Is the scorecard suitable for NGOs and government agencies?
Absolutely. It’s perfect for NGOs, hospitals, health departments, and government agencies involved in monitoring health initiatives.
Visit our YouTube channel to learn step-by-step video tutorials
Watch the step-by-step video tutorial:
Click to buy Public Health KPI Scorecard in Excel