Religious and faith-based organizations work with people, communities, and several activities every day. They manage events, monitor donations, support members, plan outreach programs, and track volunteer involvement. Because of this, leaders need a simple and reliable way to understand performance. A Religious & Faith-Based Organizations KPI Dashboard in Power BI solves this need by showing important insights on one screen.
This dashboard turns raw numbers into meaningful visuals. It helps religious institutions make informed decisions, improve operations, and strengthen community impact. In this detailed guide, you will learn everything about this dashboard, why it matters, how it works, its advantages, best practices, and frequently asked questions.
Click to buy Religious & Faith-Based Organizations KPI Dashboard in Power BI
What Is a Religious & Faith-Based Organizations KPI Dashboard in Power BI?
A Religious & Faith-Based Organizations KPI Dashboard in Power BI is an interactive reporting system that tracks the key performance indicators of a church, mosque, temple, nonprofit ministry, or any faith-based institution. It shows real-time insights related to:
- Donations and offerings
- Attendance and event participation
- Volunteer involvement
- Outreach activities
- Membership growth
- Program performance
- Financial health
- Community engagement
Because Power BI works with dynamic visuals, you can analyze the data from different angles. You can filter by months, events, groups, and categories. You can compare current performance with past performance, and you can view targets versus actual values.
This dashboard supports every leader—pastors, administrators, group heads, committee members, and volunteers. It offers a clear picture of operations and helps them make quick and accurate decisions.
Why Do Religious Organizations Need KPI Tracking?
Many religious and faith-based organizations rely on manual tracking. They use physical registers, spreadsheets, or handwritten records. These methods lead to confusion, errors, and delays. When you track KPIs in Power BI, you get a smarter and faster way to understand performance.
Here are the main reasons why KPI tracking is important:
- It shows how well your programs run.
- It helps you improve member experience.
- It supports transparent financial management.
- It highlights successful events and outreach activities.
- It helps leaders set practical goals.
- It identifies areas that need improvement.
- It builds trust among members and donors.
With a powerful dashboard, you manage your institution with confidence and clarity.
Key Features of the Religious & Faith-Based Organizations KPI Dashboard in Power BI
This dashboard comes with a structured layout. It has three main pages, along with an Excel data source. Each part plays a specific role in tracking performance.
Let’s understand each page in detail.
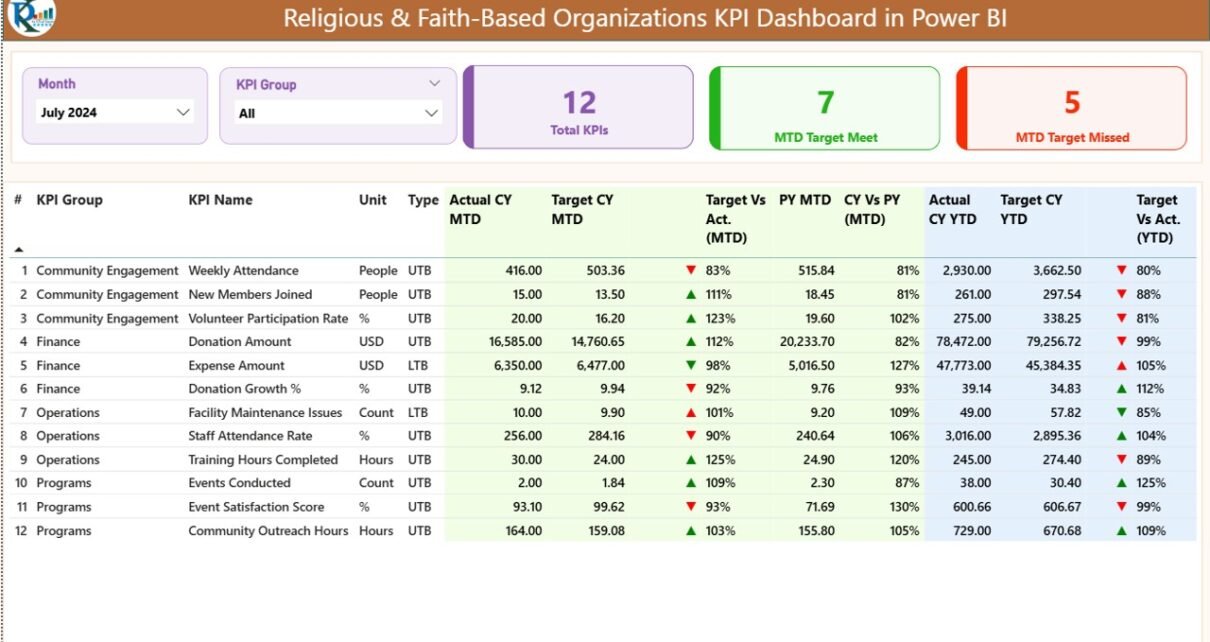
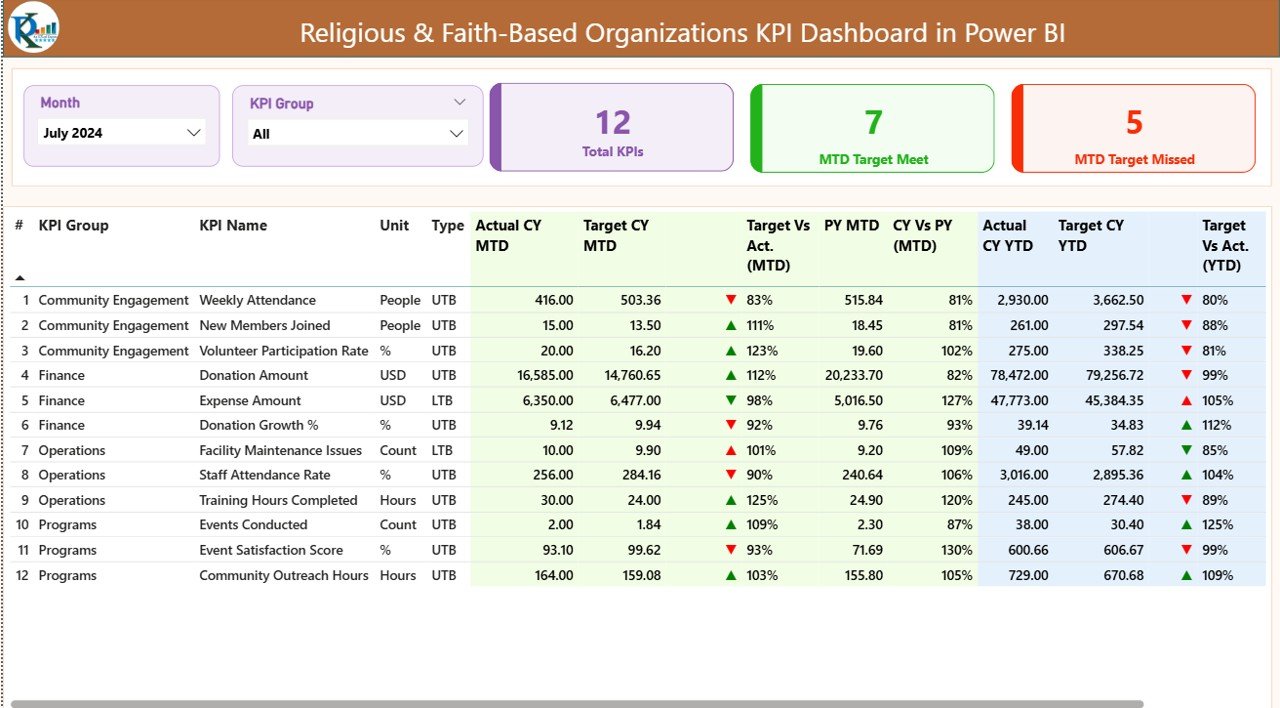
Summary Page: What Does the Main Dashboard Show?
The Summary Page is the heart of the dashboard. It gives a complete overview of all KPIs in one place. Leaders and users can see trends, compare values, and evaluate performance instantly.
Key elements of the Summary Page
Month Slicer
You can select any month to analyze the performance of that period.
KPI Group Slicer
This filter helps you focus on a specific category such as:
- Donations
- Attendance
- Membership
- Volunteer performance
- Outreach activities
- Events
- Financial KPIs
KPI Cards
Three main cards appear at the top:
- Total KPI Count
- MTD Target Met KPIs
- MTD Target Missed KPIs
These cards give a quick summary of overall performance.
Detailed KPI Table on Summary Page
The table below the cards shows detailed information for each KPI. This table displays:
KPI Number
A unique sequence number for every KPI.
KPI Group
The category or area of the KPI.
KPI Name
The name of the KPI such as:
- Total Donors
- Event Attendance
- Volunteer Hours
- New Members
- Outreach Participation
Unit
The measurement unit like:
- Count
- Hours
- Percentage
- Amount
Type
The KPI type:
- UTB (Upper the Better)
- LTB (Lower the Better)
Actual CY MTD
The current year’s Month-to-Date actual value.
Target CY MTD
The target value for the same period.
MTD Icon
A green ▲ arrow shows the KPI met the target.
A red ▼ arrow shows the KPI missed the target.
Target vs Actual (MTD)
This shows the percentage achievement using the formula:
Actual / Target × 100
PY MTD
The previous year’s MTD for comparison.
CY vs PY (MTD)
This shows the improvement ratio compared to last year.
Actual CY YTD
Year-to-Date actual value for the current year.
Target CY YTD
Year-to-Date target value for the current year.
YTD Icon
A visual indicator for YTD performance.
Target vs Actual (YTD)
Percentage achievement for YTD.
PY YTD
Previous year’s YTD for comparison.
CY vs PY (YTD)
Year-over-year performance indicator.
This page helps leaders see every KPI clearly and take timely action.
Click to buy Religious & Faith-Based Organizations KPI Dashboard in Power BI
KPI Trend Page: How Does Trend Analysis Help?
The KPI Trend Page shows visual insights using dynamic combo charts. This page allows you to compare:
- Current Year Actuals
- Previous Year Actuals
- Monthly Targets
- YTD patterns
Users can select a KPI using the slicer on the left side. Once they select the KPI, the page instantly updates the visuals. This makes it easy to understand:
- Growth patterns
- Seasonal trends
- Improvement opportunities
- Performance gaps
Leaders depend on trends because they show whether the institution improves month by month.

Click to buy Religious & Faith-Based Organizations KPI Dashboard in Power BI
KPI Definition Page: Why Is a Drill-Through Page Important?
This is a hidden drill-through page. Users can right-click on any KPI on the Summary Page and view the detailed definition.
The KPI Definition Page includes:
- KPI Name
- KPI Number
- KPI Group
- Unit
- Formula
- Clear Definition
- KPI Type (UTB or LTB)
This page helps users understand how each KPI works. It also ensures that leaders follow a consistent measurement method.
Excel Data Structure for the Dashboard
The dashboard reads its data from an Excel file. This Excel file has three worksheets.

Click to buy Religious & Faith-Based Organizations KPI Dashboard in Power BI
Input_Actual Worksheet
This sheet includes:
- KPI Name
- Month (first date of the month)
- MTD values
- YTD values
Users fill actual numbers in this sheet every month.
Input_Target Worksheet
This sheet includes:
- KPI Name
- Month
- MTD targets
- YTD targets
This helps Power BI calculate the KPI performance status.
KPI Definition Worksheet
This sheet includes:
- KPI Number
- KPI Group
- KPI Name
- Unit
- Formula
- Definition
- Type (LTB/UTB)
This sheet acts as a reference for the drill-through page.

Click to buy Religious & Faith-Based Organizations KPI Dashboard in Power BI
Advantages of Religious & Faith-Based Organizations KPI Dashboard in Power BI
Brings all data in one place
The dashboard combines donation data, attendance records, outreach activities, and volunteer metrics into one view.
Supports data-driven leadership
Leaders make strong decisions because they see real numbers, trends, and comparisons.
Improves transparency
Members and donors trust the organization when performance becomes visible.
Offers faster reporting
Instead of checking multiple registers or spreadsheets, you get instant results.
Helps track targets with ease
The dashboard shows which KPIs meet targets and which need improvement.
Strengthens community performance
With clear dashboards, leaders improve services, events, and support programs.
Easy comparisons
Comparing current year vs previous year gives a realistic understanding of growth.
Reduces manual work
Power BI automates calculations and reduces errors.
Encourages continuous improvement
Leaders see areas that need support and take corrective steps immediately.
Best Practices for the Religious & Faith-Based Organizations KPI Dashboard
Follow these practices to get the most value from your dashboard:
Update actual data every month
Accurate and timely data keeps your dashboard reliable.
Define KPIs clearly
Use meaningful KPI names, definitions, units, and formulas.
Set realistic targets
Use previous year values to set practical and achievable goals.
Use slicers for deeper analysis
Slicers help you analyze specific groups, categories, and months.
Compare trends regularly
Trend analysis shows performance gaps and improvement areas.
Use icons and color codes wisely
Visual cues help leaders understand performance faster.
Improve KPIs when needed
If one KPI underperforms for several months, revise the strategy.
Keep the Excel data clean
Avoid duplicate entries or formatting errors.
Share the dashboard with teams
Let committees, staff, and volunteers view the dashboard for better coordination.
Review definitions annually
Ensure KPI definitions stay updated as programs grow.
Conclusion
A Religious & Faith-Based Organizations KPI Dashboard in Power BI helps institutions manage their operations with clarity and purpose. It offers a complete view of community engagement, financial health, outreach performance, and volunteer involvement. With real-time visuals, trend analysis, and well-structured KPIs, leaders make better decisions and improve the spiritual and social impact of their organization.
This dashboard brings structure, transparency, and growth. When you use it regularly, you guide your institution toward a stronger future.
Frequently Asked Questions (FAQ)
What is the purpose of a KPI dashboard for religious organizations?
It helps leaders track performance, monitor activities, and understand community impact using real-time data.
Can beginners use this Power BI dashboard easily?
Yes. The dashboard is simple, visual, and user-friendly. Anyone can navigate it using filters and slicers.
What kind of KPIs can faith-based organizations track?
They can track donations, attendance, volunteer hours, outreach participation, events, membership growth, and financial KPIs.
Do I need advanced technical skills to update the data?
No. You can update data by filling the Excel sheets. Power BI updates the visuals automatically.
Can I customize the KPIs?
Yes. You can add new KPIs, change definitions, update formulas, or modify targets based on your requirements.
How often should I update the data?
You can update it monthly or weekly depending on how your organization works.
Why does the dashboard compare current year and previous year data?
Year-over-year comparison helps you track growth, improvement, and performance trends.
What makes Power BI ideal for religious institutions?
Power BI offers automation, interactive visuals, easy filtering, and fast reporting, making it perfect for performance tracking.
Visit our YouTube channel to learn step-by-step video tutorials
Click to buy Religious & Faith-Based Organizations KPI Dashboard in Power BI
Watch the step-by-step video tutorial: