In today’s digital-first era, an organization’s reputation defines its credibility and success. Every review, comment, and customer interaction leaves a digital footprint that shapes public perception. But how can companies track and measure something as dynamic as reputation?
The answer lies in data-driven reputation monitoring — and that’s exactly what the Reputation Management KPI Dashboard in Power BI delivers.
This interactive, visually engaging, and easy-to-use dashboard allows businesses to measure, analyze, and compare key performance indicators (KPIs) related to brand sentiment, customer satisfaction, service response, and online engagement — all in one place.
Whether you’re managing a single brand or multiple service units, this dashboard empowers you to identify performance gaps, monitor improvement areas, and make data-backed decisions that strengthen brand trust and customer loyalty.
Click to buy Reputation Management KPI Dashboard in Power BI
What Is a Reputation Management KPI Dashboard in Power BI?
A Reputation Management KPI Dashboard is a business intelligence solution built using Microsoft Power BI. It helps you visualize and track the KPIs that define your brand’s reputation.
By integrating your Excel data source into Power BI, this dashboard transforms raw metrics into clear, insightful visuals — such as trend charts, KPI cards, and comparison tables — making performance tracking faster and more reliable.
It provides a consolidated view of monthly and yearly performance metrics, helping decision-makers evaluate progress against goals and historical data. From tracking customer satisfaction scores to monitoring sentiment trends, this tool keeps your organization’s reputation transparent and measurable.
Key Features of the Reputation Management KPI Dashboard in Power BI
This Power BI dashboard includes three pages, each offering unique insights and functionality. Let’s explore them one by one.
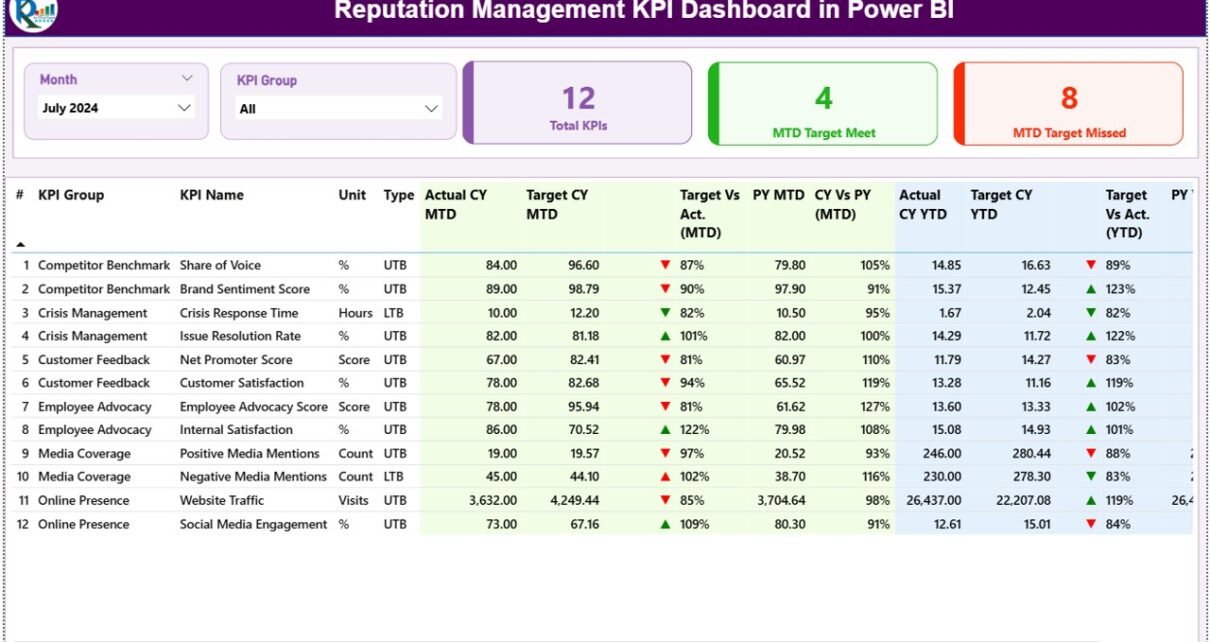
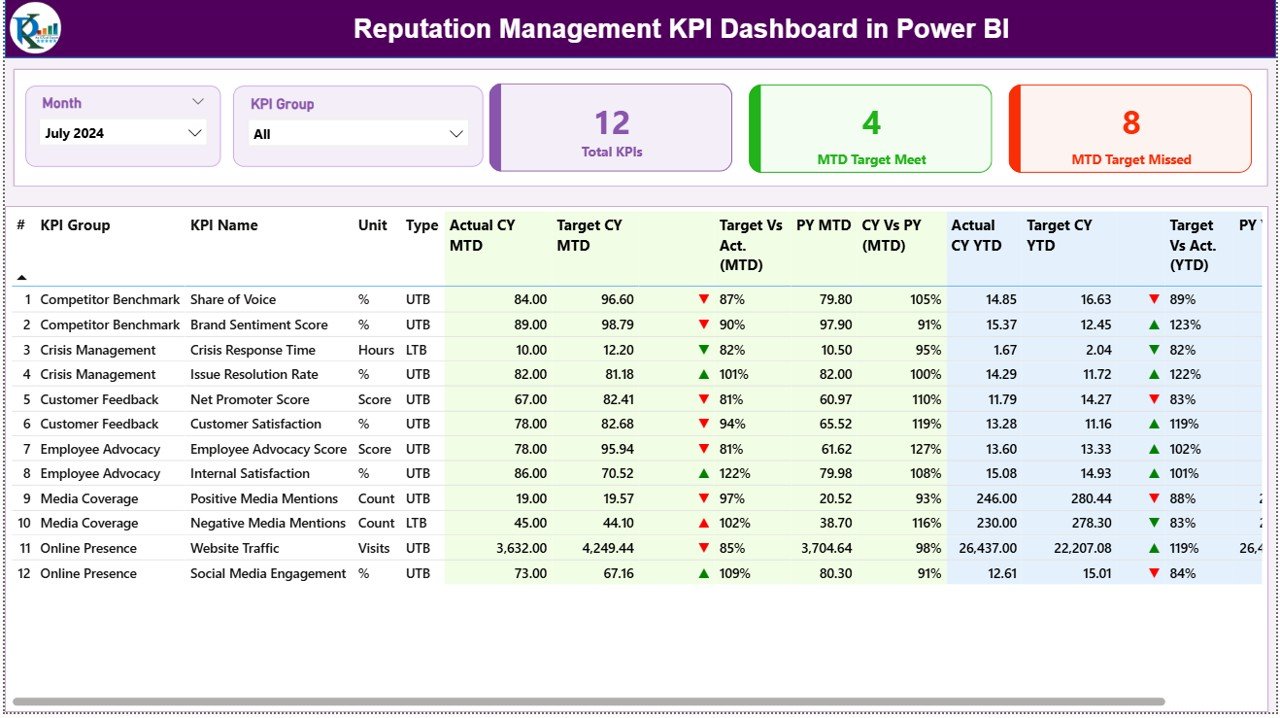
⃣ Summary Page
The Summary Page serves as the central command center of your dashboard.
- Key Highlights:
- Slicers for Month and KPI Group at the top allow users to customize the view.
- Three KPI Cards display high-level metrics:
- Total KPIs count
- Month-to-Date (MTD) Target Met count
- MTD Target Missed count
Beneath these visuals lies a detailed KPI Performance Table that displays all essential reputation metrics in a structured and insightful way.
Click to buy Reputation Management KPI Dashboard in Power BI
The table includes:
- KPI Number: The serial ID for each KPI.
- KPI Group: The functional or thematic category (e.g., Customer Experience, Brand Engagement).
- KPI Name: The specific indicator being measured.
- Unit: The measurement unit (e.g., %, Count, Rating).
- Type: Whether the KPI is “Lower the Better (LTB)” or “Upper the Better (UTB).”
- Actual CY MTD: Current Year Month-to-Date actual values.
- Target CY MTD: The benchmark target for the same period.
- MTD Icon: ▲ (green) for target achieved and ▼ (red) for target missed.
- Target vs Actual (MTD): A % ratio of actual vs target performance.
- PY MTD: Previous Year MTD values for comparison.
- CY vs PY (MTD): Performance comparison percentage between the current and previous years.
- Actual CY YTD: Year-to-Date actual numbers.
- Target CY YTD: YTD target benchmarks.
- YTD Icon: ▲ or ▼ with color indicators for YTD performance.
- Target vs Actual (YTD): Actual vs target ratio for yearly progress.
- PY YTD: Previous Year YTD values.
- CY vs PY (YTD): YTD performance comparison with last year.
This page ensures that users can instantly identify which areas are performing well and where attention is needed.
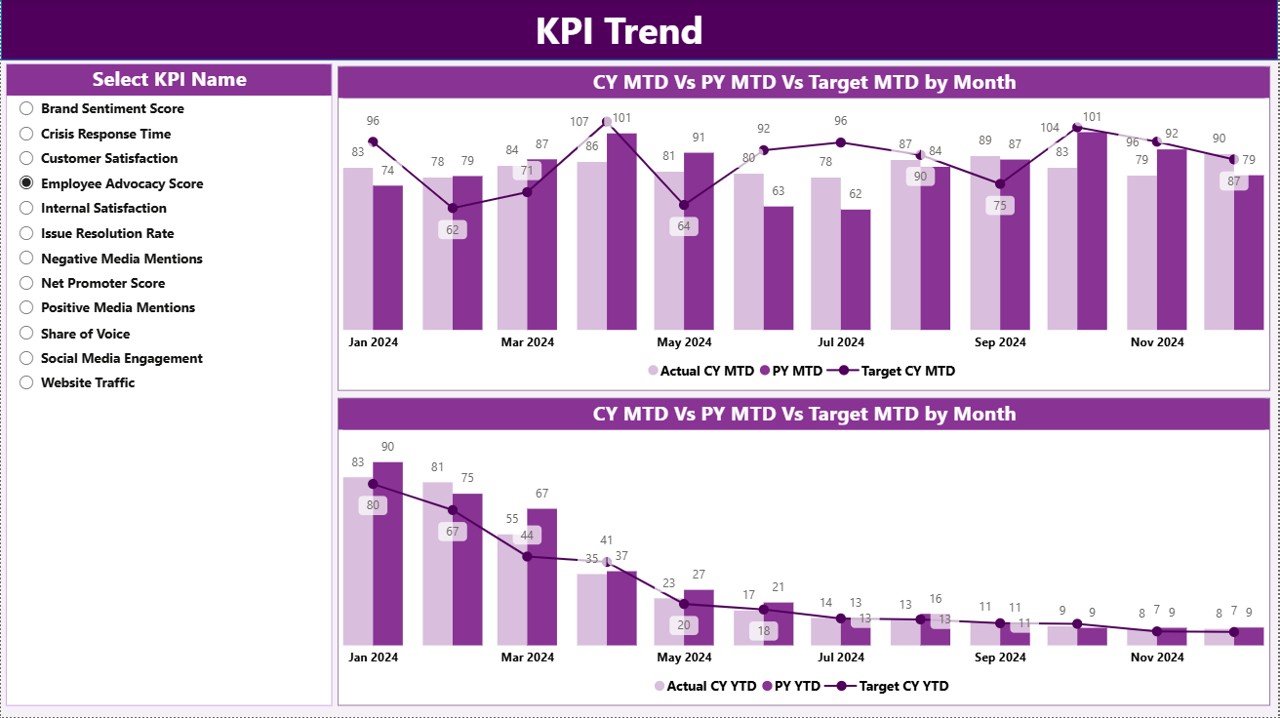
KPI Trend Page
The KPI Trend Page allows you to visualize the progress of each KPI across months.
Key Features:
- Slicer for KPI Selection: Choose a specific KPI to view its performance.
- Combo Charts: Two combination visuals show both bar and line comparisons for:
- MTD (Month-to-Date) trends: Tracks monthly progress across actual, target, and previous-year data.
- YTD (Year-to-Date) trends: Displays cumulative performance throughout the year.
These visuals make it easy to identify growth patterns, seasonal variations, and long-term trends — turning data into actionable insights at a glance.
Click to buy Reputation Management KPI Dashboard in Power BI
KPI Definition Page
The KPI Definition Page is a drill-through page (hidden by default).
From the Summary Page, users can right-click on a specific KPI and select “Drill Through” to explore detailed KPI definitions, including:
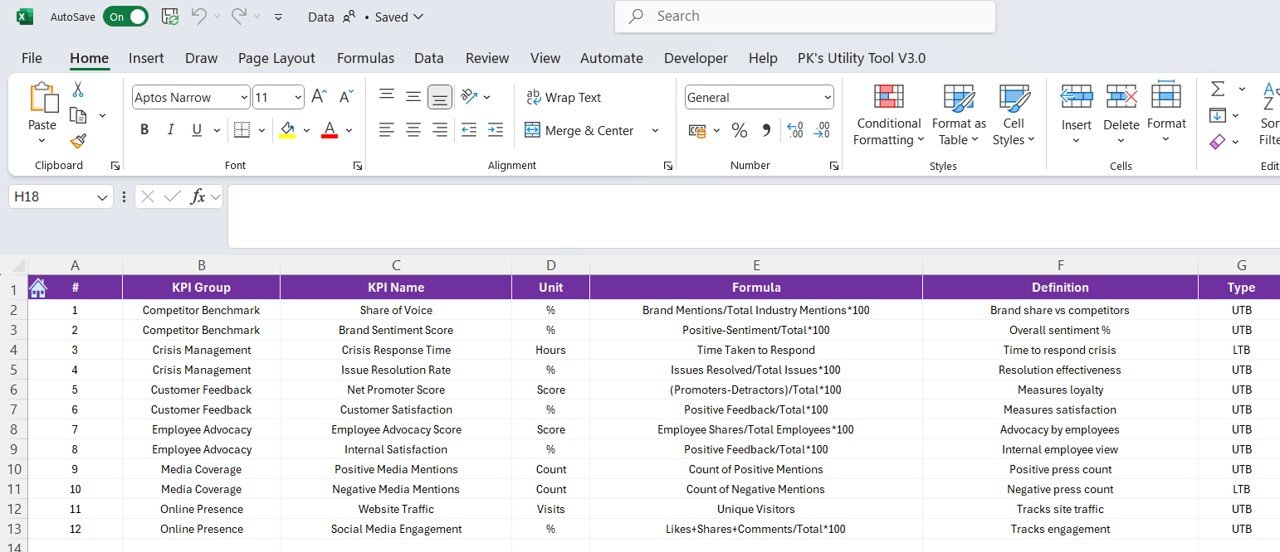
- Formula: The calculation logic used for each KPI.
- Definition: A concise description of what the KPI measures.
- KPI Type (UTB/LTB): The direction of performance desirability.
A back button located in the top-left corner enables users to return smoothly to the main Summary Page.
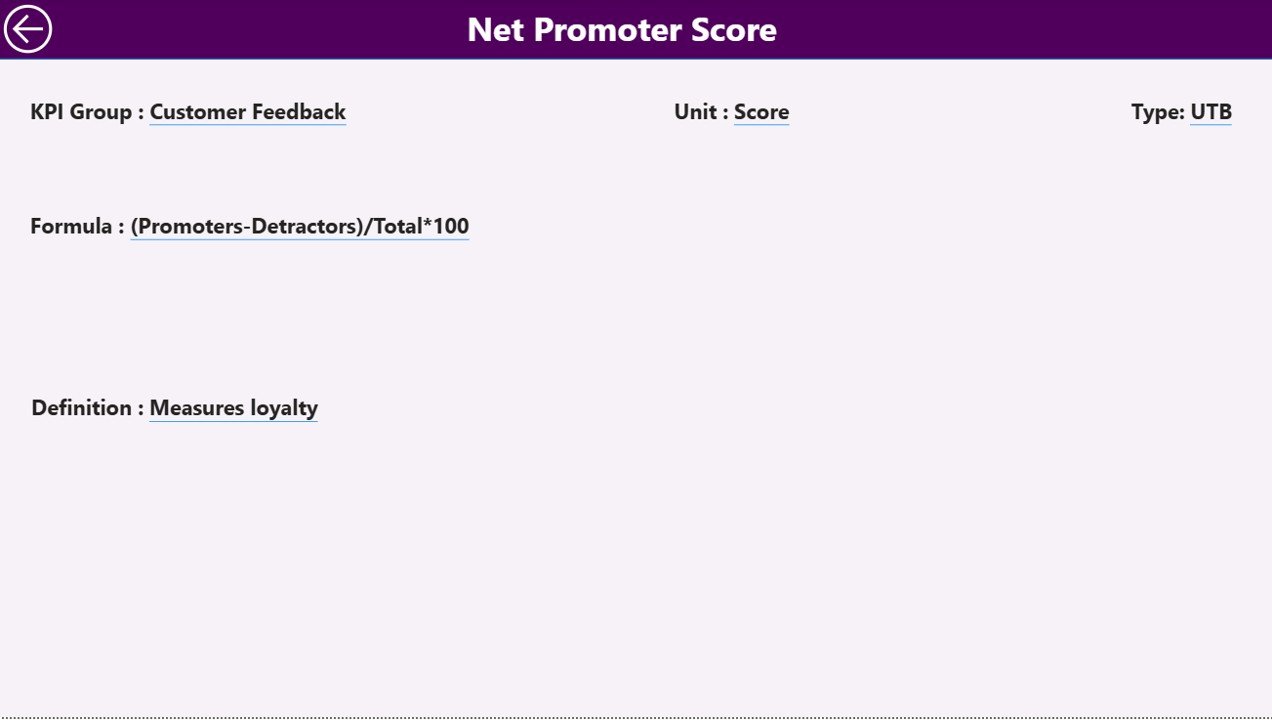
This page ensures full transparency and consistency in understanding KPI logic across teams.
Click to buy Reputation Management KPI Dashboard in Power BI
Data Source: Excel Integration
The dashboard connects seamlessly to an Excel file, making data input and updates quick and simple.
You only need to fill three worksheets in the Excel data source:
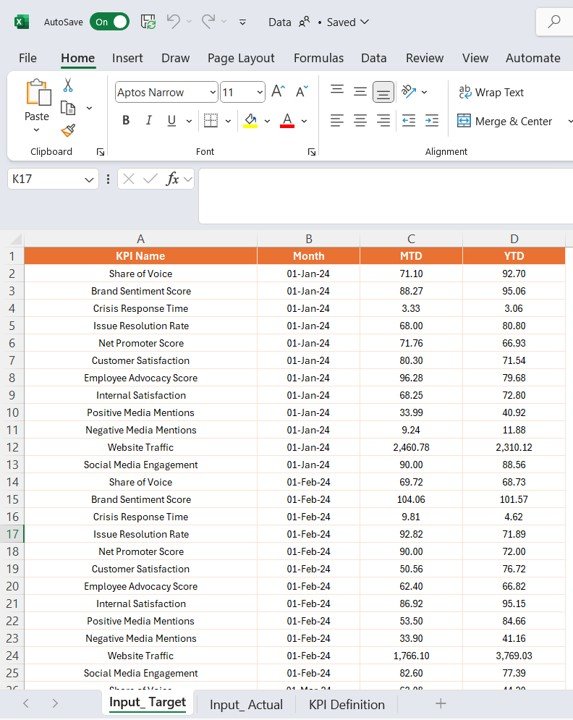
Input_Actual Sheet
- Contains actual numbers for each KPI.
- Fields: KPI Name, Month (first date of each month), MTD value, YTD value.
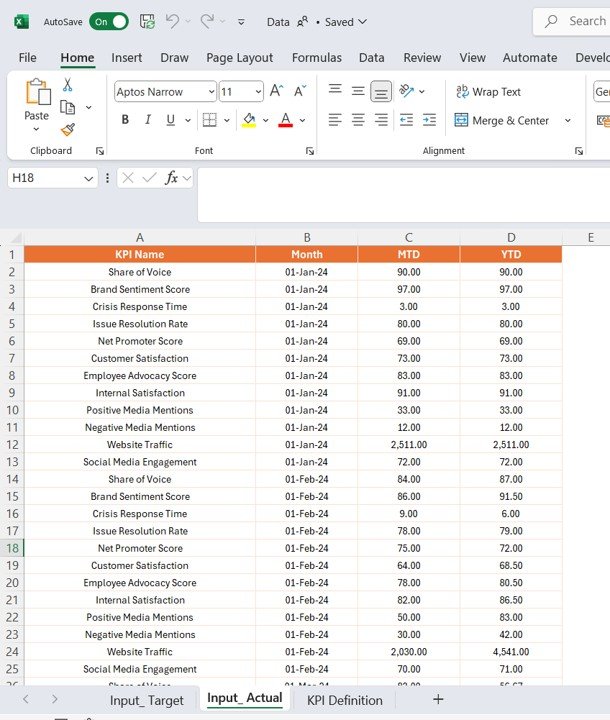
Input_Target Sheet
- Contains target values.
- Fields: KPI Name, Month (first date), MTD value, YTD value.
KPI Definition Sheet
- Lists KPI Number, KPI Group, KPI Name, Unit, Formula, Definition, and Type (UTB or LTB).
When these sheets are updated, Power BI automatically refreshes all visuals — keeping your dashboard dynamic and up to date.
Why Businesses Need a Reputation Management KPI Dashboard
Managing a brand’s reputation involves handling multiple dynamic factors like customer feedback, social sentiment, and service quality. Traditional manual tracking through spreadsheets can be slow and error-prone.
With a Power BI dashboard, you can:
- Get real-time reputation insights.
- Automate performance reporting.
- Identify trends in customer behavior and sentiment.
- Visualize strengths and weaknesses instantly.
- Benchmark performance across time and categories.
This reduces reporting time while improving the accuracy and reliability of your reputation data.
Advantages of Using the Reputation Management KPI Dashboard in Power BI
Implementing this dashboard offers both strategic and operational benefits.
1. Real-Time Insights
Instantly monitor KPIs such as review scores, feedback volume, and sentiment ratios without manual updates.
2. Improved Decision-Making
Clear visualizations help management teams make quick, data-driven decisions to maintain brand trust.
3. Time Savings
Automated data refresh from Excel eliminates repetitive manual calculations and reporting.
4. Cross-Team Transparency
All stakeholders — from marketing to customer service — can access the same KPI definitions and performance summaries.
5. Historical Comparison
Side-by-side charts for Current vs Previous Year enable performance benchmarking over time.
6. Enhanced Accountability
Each KPI clearly shows responsible groups or departments, promoting ownership and continuous improvement.
Opportunities for Improvement
Even with its strong features, the dashboard can be further enhanced. Consider these opportunities:
- Integrate sentiment analysis APIs: Pull data directly from social platforms for real-time feedback.
- Add alert notifications: Automate email or Teams alerts for KPI deviations.
- Include region or branch filters: Analyze reputation by geography or outlet.
- Incorporate NPS trend charts: Track customer advocacy levels over time.
- Add dynamic commentary fields: Let managers input remarks for context behind changes.
These additions can transform your dashboard from a reporting tool into a comprehensive reputation intelligence system.
Best Practices for Using the Reputation Management KPI Dashboard
Follow these guidelines to get the best results:
1. Keep Data Clean
Ensure no blank or duplicate KPI entries exist in the Excel file. Accurate data drives reliable visuals.
2. Update Monthly
Refresh your Excel data and Power BI visuals regularly — ideally every month — for up-to-date reputation tracking.
3. Use Consistent KPI Definitions
Maintain uniform KPI formulas and descriptions in the definition sheet. This avoids confusion and ensures consistent reporting.
4. Customize for Your Industry
Modify KPI groups and metrics to match your business type — for instance, use “Customer Sentiment” for retail or “Service Quality Index” for healthcare.
5. Add Role-Based Dashboards
Create role-specific pages (e.g., Marketing View, Operations View) using Power BI’s role-level security feature.
6. Leverage Power BI Mobile App
Access your dashboard on the go. This helps executives review key metrics anytime, anywhere.
7. Automate Data Refresh
Set scheduled refreshes in Power BI Service to keep insights current without manual updates.
How This Dashboard Supports Strategic Growth
The Reputation Management KPI Dashboard in Power BI isn’t just about tracking performance — it’s about driving long-term brand growth.
By continuously monitoring how customers perceive your brand, management teams can:
- Identify weak areas in service delivery.
- Track improvements over time.
- Spot emerging risks early.
- Align strategy with reputation goals.
When decisions are based on accurate, timely insights, organizations can strengthen customer trust and maintain a positive brand image in an increasingly competitive digital world.
Integration Possibilities
This dashboard works perfectly as part of a broader analytics ecosystem.
You can integrate it with:
- Microsoft Teams for collaboration.
- SharePoint for centralized data access.
- Power Automate for workflow alerts.
- Google Reviews API or social media feeds for real-time reputation data.
These integrations allow you to expand functionality and make your reputation management strategy more dynamic and proactive.
Conclusion
In a world where perception drives profit, understanding how your brand is viewed has never been more critical.
The Reputation Management KPI Dashboard in Power BI empowers you with real-time visibility into customer sentiment, performance trends, and improvement areas — all through a visually rich, easy-to-use interface.
By combining Excel-based data with Power BI’s analytical power, this tool helps organizations turn feedback into strategy and metrics into growth.
When used consistently, it becomes an essential part of your performance management ecosystem — ensuring that your reputation stays not only protected but continuously strengthened.
Frequently Asked Questions (FAQs)
⃣ What is the main purpose of a Reputation Management KPI Dashboard in Power BI?
It tracks and visualizes KPIs related to brand perception, customer feedback, and sentiment. The goal is to help organizations make informed, data-backed decisions to maintain a positive brand reputation.
⃣ Can I connect the dashboard to live data sources?
Yes. While it currently uses Excel as a data source, you can easily connect it to online databases, APIs, or CRM tools like Dynamics 365 or HubSpot for real-time updates.
What kind of KPIs can be tracked in this dashboard?
You can track metrics such as:
- Customer Satisfaction Score (CSAT)
- Net Promoter Score (NPS)
- Review Rating Averages
- Response Time to Feedback
- Brand Sentiment Ratio
Can I customize KPI Groups and Definitions?
Absolutely. You can edit the “KPI Definition” sheet in Excel to add, remove, or modify KPI names, groups, and formulas according to your business needs.
How often should the dashboard be updated?
Ideally, update the data monthly. However, if connected to live data sources, Power BI can auto-refresh the dashboard daily or even hourly.
Is Power BI necessary to use this dashboard?
Yes, this dashboard is designed for Power BI Desktop or Power BI Service. However, the Excel data file can be edited or viewed separately without Power BI.
7️ Can this dashboard handle multiple brands or branches?
Yes. You can add “Brand” or “Location” columns in the Excel data and use Power BI slicers to compare multiple units easily.
⃣ Is it possible to share this dashboard with others?
Yes. Power BI allows you to publish and share reports with authorized users through Power BI Service, Teams, or SharePoint.
Visit our YouTube channel to learn step-by-step video tutorials
Watch the step-by-step video tutorial:
Click to buy Reputation Management KPI Dashboard in Power BI