Sports and recreation organizations run many programs, manage multiple facilities, and handle thousands of participants every year. Because of this, leaders must monitor performance closely. If they don’t track progress, they miss opportunities to improve programs, increase engagement, and grow revenue. A Sports & Recreation KPI Dashboard in Power BI solves this challenge with a clear, visual, and fully automated reporting system.
In this detailed article, you will learn what this dashboard is, why it matters, how it works, and how you can use it to track performance month-to-month and year-to-date. You will also explore its core features, best practices, and advantages.
Click to buy Sports & Recreation KPI Dashboard in Power BI
What Is a Sports & Recreation KPI Dashboard in Power BI?
A Sports & Recreation KPI Dashboard in Power BI is a ready-to-use analytical tool that gives teams instant visibility into their KPIs. It captures all performance data inside an Excel file and transforms it into powerful visual insights using Power BI.
Sports clubs, recreation centers, gyms, community programs, coaching academies, and wellness facilities can all use this dashboard. It helps leaders track participation levels, membership growth, event performance, facility utilization, revenue, customer experience, and more. Because everything stays organized, leaders make better decisions with confidence.
Why Do Organizations Need a Sports & Recreation KPI Dashboard?
Sports and recreation organizations handle many activities every day. Although each activity generates data, teams struggle to convert it into meaningful insights. Without a structured dashboard, they cannot monitor trends or compare growth across months.
This dashboard brings clarity. It gives a unified view of:
- Member participation
- Program performance
- Attendance levels
- Budget vs. actual results
- Customer satisfaction
- Facility usage
- Training quality
- Revenue and expenses
With Power BI, teams can slice, filter, compare, and explore KPIs with just a click. As a result, they stay ahead of challenges and make quick decisions.
Key Features of the Sports & Recreation KPI Dashboard in Power BI
This dashboard comes with three powerful pages, each designed to display meaningful insights.
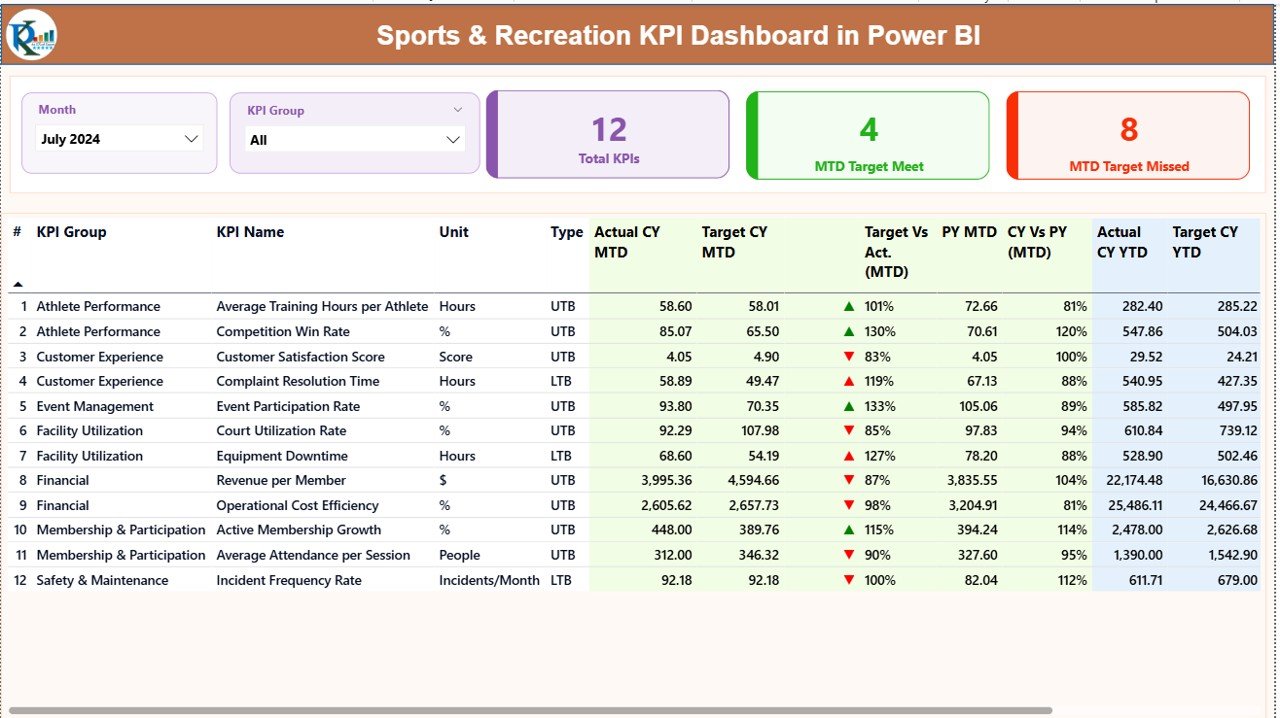
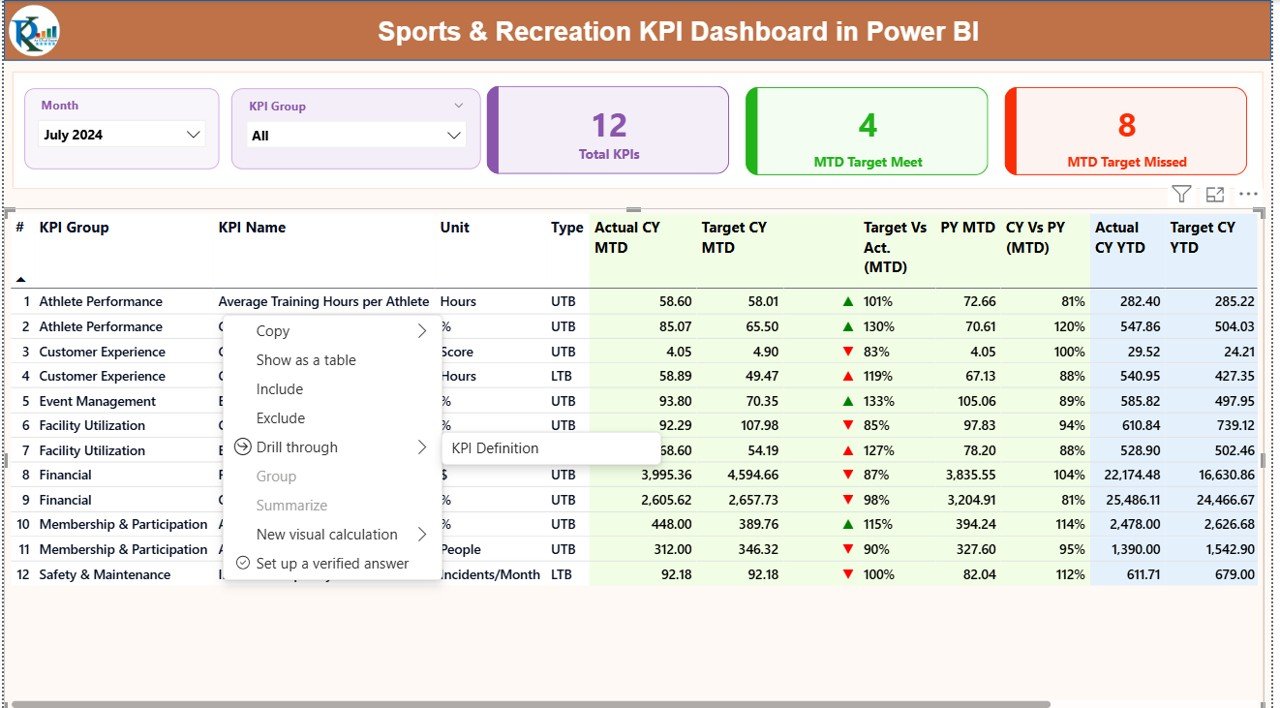
Summary Page – The Main Performance Overview
The Summary Page is the heart of the dashboard. It gives a complete month-wise and KPI-wise view of performance. On the top, you will find two slicers:
- Month Slicer
- KPI Group Slicer
These help you switch between months and different KPI categories easily.
Below the slicers, you see three performance cards:
- Total KPIs Count
- MTD Target Met Count
- MTD Target Missed Count
These cards reveal the overall health of your KPIs in one glance.
Detailed KPI Table
The table below displays essential information for each KPI:
- KPI Number
- KPI Group
- KPI Name
- Unit of Measurement
- KPI Type (UTB or LTB)
- Actual CY MTD Value
- Target CY MTD Value
- MTD Performance Icon (▲ or ▼)
- Target vs. Actual (MTD %)
- PY MTD Value
- CY vs. PY (MTD %)
- Actual CY YTD Value
- Target CY YTD Value
- YTD Performance Icon (▲ or ▼)
- Target vs. Actual (YTD %)
- PY YTD Value
- CY vs. PY (YTD %)
This detailed view helps managers understand what drives performance, how targets compare with actuals, and how the organization performs compared to the previous year.
Click to buy Sports & Recreation KPI Dashboard in Power BI
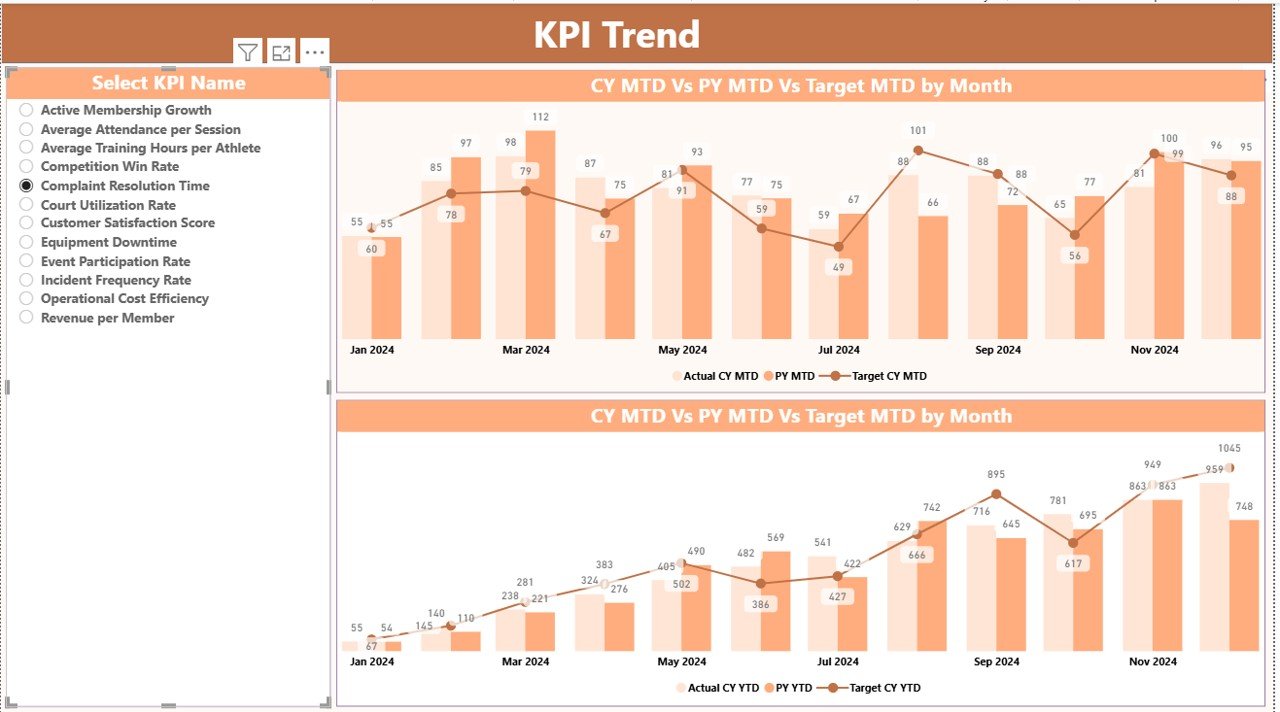
KPI Trend Page – Trend Analysis for Better Decisions
The KPI Trend Page focuses on comparing performance over time. It contains:
- Two combo charts
- MTD Trend (Month-to-Date)
- YTD Trend (Year-to-Date)
- Both charts display:
- Actual Current Year
- Previous Year
- Target Values
This gives a clear understanding of whether your KPIs move in the right direction.
On the left side, you also get a KPI Name Slicer. You can choose any KPI to see its trend visually. Because the charts update instantly, you explore patterns and take decisions quickly.
Click to buy Sports & Recreation KPI Dashboard in Power BI
KPI Definition Page – Drill-Through for Detailed Understanding
The KPI Definition Page is a hidden drill-through page. When you right-click a KPI on the Summary Page, you can jump to this definition page.
Here you will find:
- KPI Number
- KPI Group
- KPI Name
- Unit
- Formula
- Definition
- KPI Type (LTB or UTB)
This page increases transparency and ensures your team understands how KPIs work.
A back button on the top left helps you return to the Summary Page easily.

Click to buy Sports & Recreation KPI Dashboard in Power BI
How Does the Excel Data Structure Work?
This dashboard uses a simple Excel file as the data source. You only fill in the numbers, and Power BI updates the visuals automatically.
There are three worksheets:
Input_Actual Sheet
In this sheet, you enter:
- KPI Name
- Month (first date of each month)
- MTD Actual Value
- YTD Actual Value
Input_Target Sheet
Here you enter the target values for each KPI:
- KPI Name
- Month
- MTD Target
- YTD Target
KPI Definition Sheet
This sheet stores:
- KPI Number
- KPI Group
- KPI Name
- Unit
- Formula
- Definition
- KPI Type (LTB or UTB)
This structured format keeps calculations clean and efficient.
Click to buy Sports & Recreation KPI Dashboard in Power BI
Which KPIs Can You Track in Sports & Recreation?
Although each organization has unique goals, common KPIs include:
Participation & Membership
- Monthly Active Members
- New Memberships
- Membership Renewals
- Drop-Out Rate
Facility Usage
- Court Occupancy Rate
- Class Capacity Utilization
- Peak Hour Usage
Program Performance
- Program Enrollment Rate
- Class Attendance
- Event Participation
Financial KPIs
- Revenue per Program
- Total Operational Cost
- Cost per Participant
- MTD and YTD Budget Variance
Customer Satisfaction
- Survey Score
- Program Feedback Rating
- Complaint Resolution Time
Power BI tracks these KPIs across months and years so teams understand performance deeply.
Advantages of the Sports & Recreation KPI Dashboard in Power BI
A dedicated dashboard offers many benefits. Here are the most important advantages:
- Clear Visibility of All KPIs
You see everything in one place — trends, comparisons, targets, and numbers. This clarity improves decision-making.
- Real-Time Insights
Because Power BI connects directly to Excel, changes reflect instantly. Teams stay updated without manual reports.
- Easy Trend Analysis
MTD and YTD charts help you compare current performance with past results. You identify issues early and act fast.
- Improved Accountability
Each KPI has clear definitions. This builds accountability and ensures everyone understands what success looks like.
- Time Savings Through Automation
Leaders save hours every month because the dashboard updates automatically.
- Better Communication Across Teams
Visual insights make discussions easier. Coaches, managers, and administrators stay aligned.
- Target Tracking Made Simple
Green and red arrows (▲ ▼) help you understand which KPIs meet or miss targets instantly.
- Encourages Data-Driven Culture
When teams see numbers clearly, they move from guesswork to informed decision-making.
How This Dashboard Helps Different Roles
A Sports & Recreation KPI Dashboard supports various stakeholders:
Sports Directors
They track participation, program growth, and success metrics.
Coaches
They monitor performance trends and attendance.
Operations Team
They manage facility occupancy and resource allocation.
Finance Team
They analyze revenue, costs, and budget variances.
Management
They review overall performance and compare results month-over-month and year-over-year.
Because each person views the same dashboard, collaboration becomes easier.
Best Practices for Using the Sports & Recreation KPI Dashboard in Power BI
To get the most out of this dashboard, follow these best practices:
- Keep Your KPI Definitions Clear
Use short formulas and simple descriptions. This avoids confusion and ensures consistency.
- Enter Data on Time
Regular updates maintain the accuracy of MTD and YTD calculations.
- Review Trends Every Month
Monthly reviews help you identify patterns early and adjust strategies.
- Compare Actual vs. Target Regularly
Track both MTD and YTD metrics to understand whether your progress stays on track.
- Use Drill-Through for Deeper Insights
Do not skip the KPI Definition Page. It helps teams understand calculations and performance logic.
- Group KPIs Smartly
Create KPI groups such as:
- Participation
- Facility Usage
- Finance
- Customer Experience
- Program Quality
This organization improves clarity.
- Monitor Previous Year Comparisons
CY vs. PY percentages show whether your programs grow or decline.
- Keep Data Clean
Avoid blank values, wrong dates, or inconsistent entries. Clean data ensures accurate visuals.
- Share the Dashboard Across Teams
A shared dashboard builds transparency and improves teamwork.
Conclusion
A Sports & Recreation KPI Dashboard in Power BI brings structure, clarity, and powerful insights to performance tracking. It helps organizations monitor participation, revenue, facility usage, customer satisfaction, and program success with ease. Because it uses Excel as the data source, updates stay simple, and Power BI handles all the visuals.
With three important pages — Summary, KPI Trend, and KPI Definitions — this dashboard gives everything you need to make informed and confident decisions. When you follow the best practices outlined here, you unlock the full potential of your sports and recreation programs.
Frequently Asked Questions (FAQs)
- What is a Sports & Recreation KPI Dashboard in Power BI?
It is a ready-to-use analytical tool that tracks KPIs related to participation, finances, program performance, and customer experience using visual insights.
- Can I customize the KPIs in this dashboard?
Yes. You can modify KPI definitions, add new KPIs, or remove old ones based on your organization’s needs.
- Does this dashboard update automatically?
Yes. When you update the Excel data file, Power BI refreshes the visuals.
- Who can use this dashboard?
Sports clubs, gyms, recreation centers, coaching academies, and community programs can all use it.
- Do I need technical skills to use it?
No. You only enter values in Excel. Power BI handles all calculations and visuals.
- Does it support MTD and YTD analysis?
Yes. Both Month-to-Date and Year-to-Date metrics appear clearly with icons, percentage comparisons, and trends.
- Can I compare current performance with the previous year?
Yes. The dashboard shows CY vs. PY comparisons for both MTD and YTD.
- Can I drill through to see more details?
Yes. The KPI Definition Page provides formula, description, KPI type, and more.
- Is this dashboard useful for decision-making?
Absolutely. It gives data-driven insights that help leaders plan programs, manage facilities, and improve customer satisfaction.
- How often should I update the Excel file?
Update it monthly for best results. Regular updates keep your dashboard accurate and meaningful.
Visit our YouTube channel to learn step-by-step video tutorials
Watch the step-by-step video tutorial:
Click to buy Sports & Recreation KPI Dashboard in Power BI