Running a retail store requires constant monitoring of performance across sales, customer service, inventory, and operational efficiency. Without proper tracking, it is easy to lose sight of progress and miss opportunities for growth. That is where a Store Operations KPI Dashboard in Excel comes into play.
In this article, you will learn everything about the Store Operations KPI Dashboard: what it is, how it works, why it is important, its advantages, opportunities for improvement, and best practices. By the end, you will understand how to leverage this Excel-based dashboard to streamline your retail operations and make data-driven decisions.
Click to buy Store Operations KPI Dashboard in Excel
What Is a Store Operations KPI Dashboard in Excel?
A Store Operations KPI Dashboard in Excel is a structured tool designed to track and analyze the performance of key store metrics. It consolidates data from sales, customer interactions, expenses, staffing, and inventory into a visual format that is easy to interpret.
Instead of navigating through multiple reports, managers can view performance at a glance. From monthly revenue and footfall to customer satisfaction and shrinkage rates, this dashboard highlights the most critical Key Performance Indicators (KPIs) in one place.
Excel provides flexibility, simplicity, and affordability, making it one of the best platforms for creating and using such dashboards.
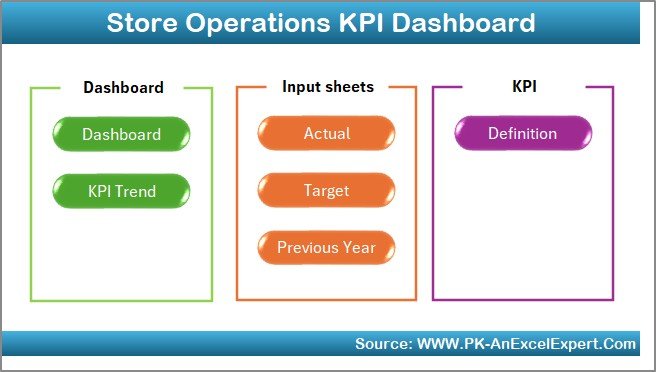
Key Features of the Store Operations KPI Dashboard
This dashboard is designed with seven worksheets that simplify data tracking and analysis:
Home Sheet
The Home Sheet serves as the index page. It includes navigation buttons that let you jump directly to specific dashboard pages, ensuring smooth navigation without wasting time scrolling through multiple tabs.
Click to buy Store Operations KPI Dashboard in Excel
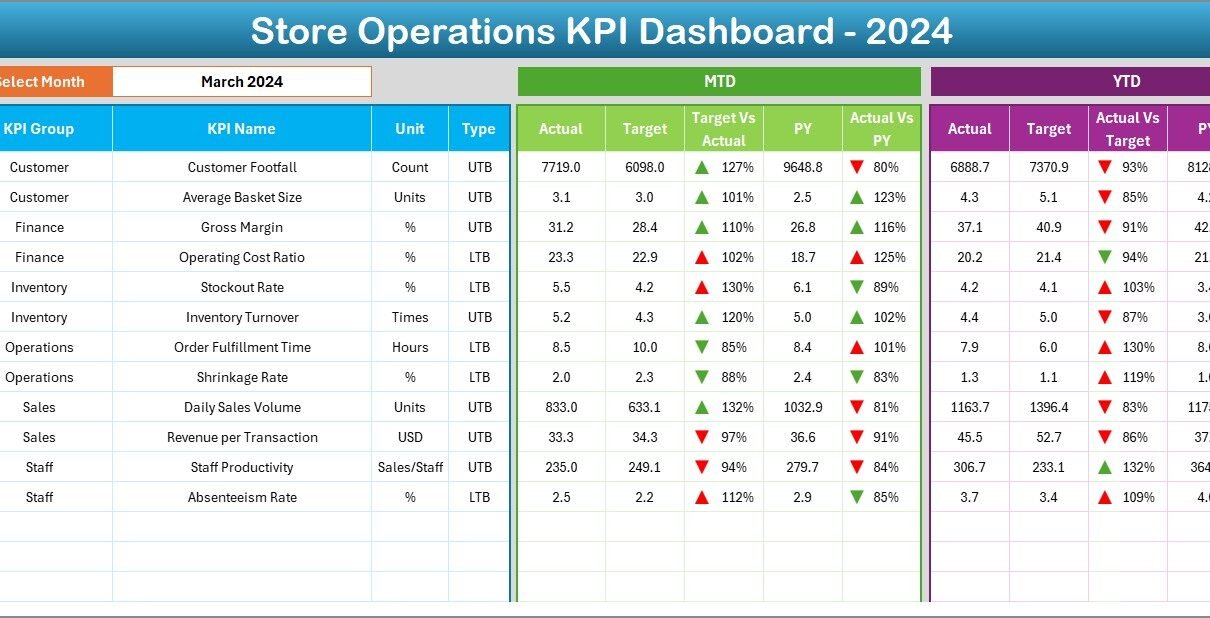
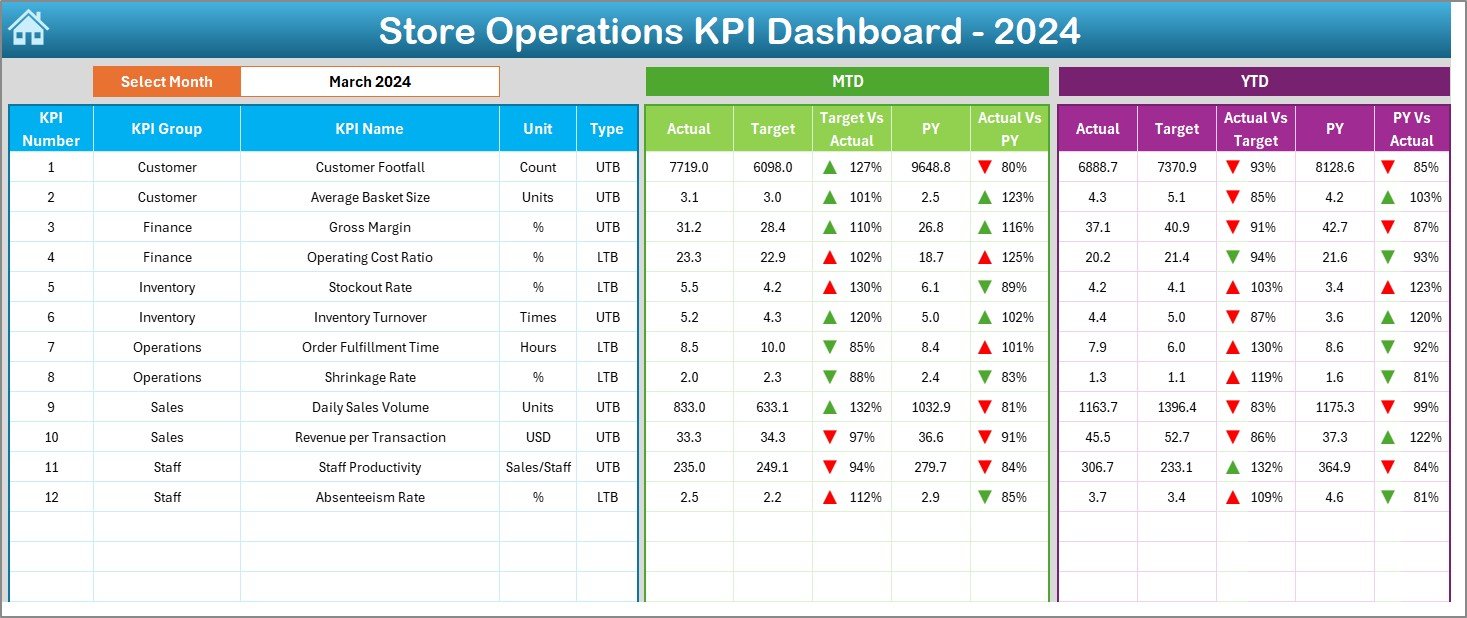
Dashboard Sheet
The Dashboard Sheet is the centerpiece of the system. On this page:
- You can select a specific month from a drop-down menu (cell D3).
- The entire dashboard updates automatically for that month.
- It displays MTD (Month-to-Date) Actuals, Targets, and Previous Year comparisons.
- It also shows YTD (Year-to-Date) Actuals, Targets, and Previous Year comparisons.
- Conditional formatting with arrows helps visualize performance:
- Up arrow = improvement
- Down arrow = decline
Click to buy Store Operations KPI Dashboard in Excel
This visual approach enables managers to see progress instantly.
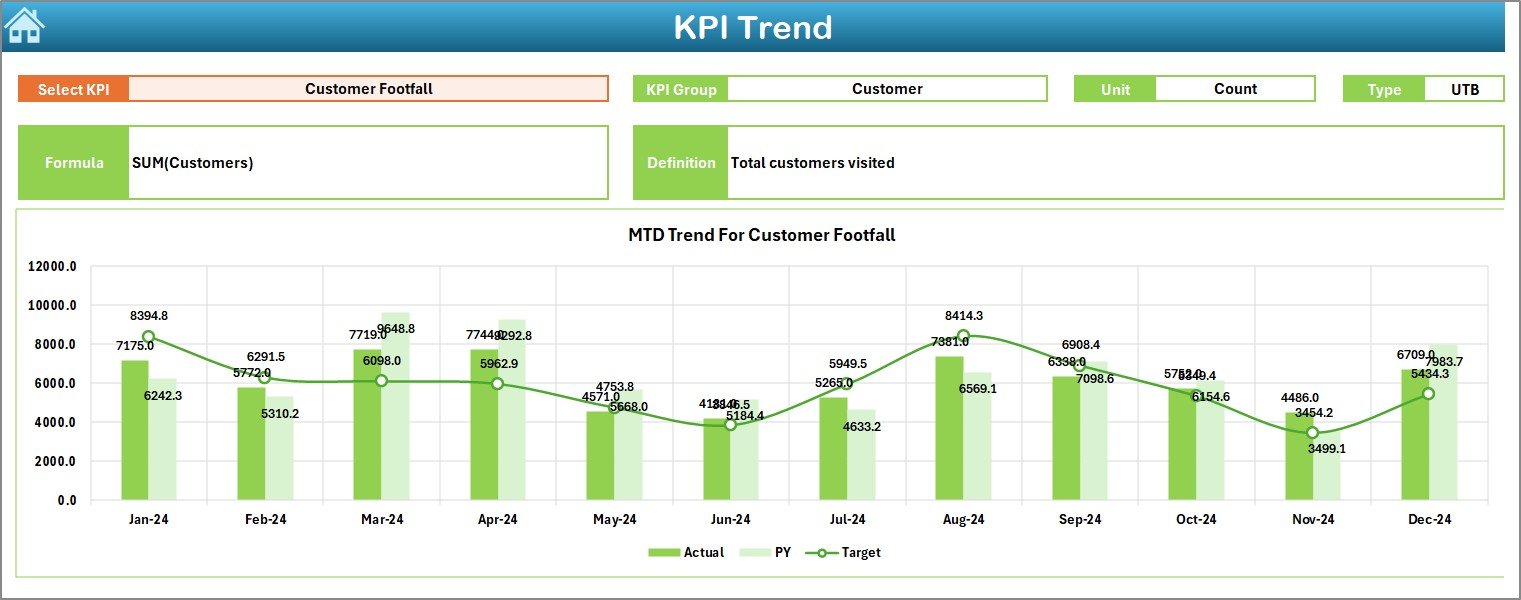
KPI Trend Sheet
The KPI Trend Sheet focuses on detailed analysis:
- Users can select a KPI from a drop-down (cell C3).
- The sheet displays KPI details such as group, unit, type (LTB – Lower the Better or UTB – Upper the Better), formula, and definition.
- Trend charts show how each KPI is performing for MTD and YTD compared to targets and last year.
Click to buy Store Operations KPI Dashboard in Excel
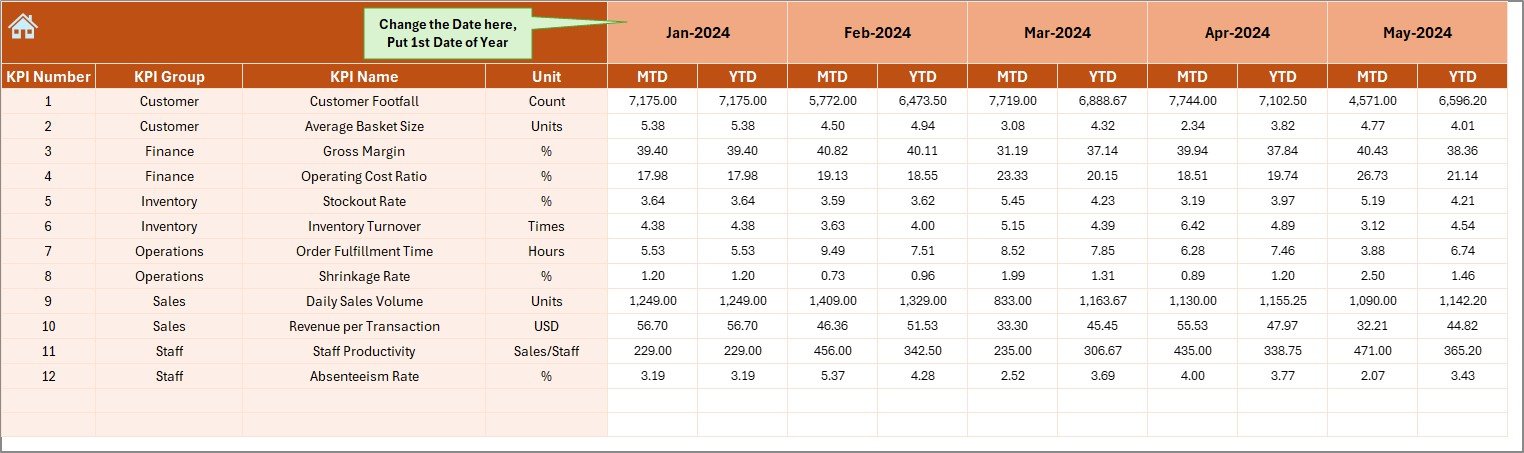
Actual Numbers Input Sheet
This sheet is used to input the actual numbers for MTD and YTD across months. It is flexible and allows you to define the starting month of the year (cell E1).
Target Sheet
The Target Sheet is where you set monthly and yearly targets for each KPI. By doing so, the dashboard can automatically compare actual results against targets.
Click to buy Store Operations KPI Dashboard in Excel
Previous Year Numbers Sheet
Here, you enter the previous year’s data. This allows the dashboard to show year-on-year comparisons, which is extremely valuable for identifying growth trends.
KPI Definition Sheet
This sheet acts as the backbone of the dashboard. It includes:
- KPI Name
- KPI Group
- Unit of Measurement
- Formula
- Definition
This ensures clarity and consistency when tracking and reporting KPIs.
Why Are Store Operations KPIs Important?
KPIs are the heartbeat of store operations. Without KPIs, management becomes guesswork. Here’s why they matter:
- They measure performance against goals.
- They help identify inefficiencies and bottlenecks.
- They allow benchmarking against past performance and industry standards.
- They improve accountability across staff and departments.
- They enable data-driven decision-making.
Examples of Store Operations KPIs
To make the dashboard practical, here are some common KPIs that retailers track:
- Sales per Square Foot (UTB): Total sales ÷ Store area
- Customer Footfall (UTB): Number of visitors entering the store
- Conversion Rate (UTB): Percentage of visitors making a purchase
- Shrinkage % (LTB): Loss from theft, errors, or damage ÷ Total sales
- Average Transaction Value (UTB): Total sales ÷ Number of transactions
- Customer Satisfaction Score (UTB): Based on surveys and feedback
- Inventory Turnover (UTB): Cost of goods sold ÷ Average inventory
- Labor Cost % (LTB): Staff cost ÷ Total sales
By including these in the dashboard, managers can get a 360° view of store performance.
Advantages of Store Operations KPI Dashboard in Excel
Using Excel for this dashboard has many benefits:
- Affordability: No need for expensive software.
- Flexibility: Easy customization for different store sizes and KPIs.
- User-Friendly: Works with a tool that most employees already know.
- Automation: Uses formulas and conditional formatting to update results instantly.
- Visualization: Charts, arrows, and colors make insights easy to understand.
- Benchmarking: Compare monthly and yearly performance at a glance.
Opportunities for Improvement
Although Excel is powerful, the dashboard can always be improved:
- Scalability: For very large retail chains, Excel may slow down. In such cases, integration with Power BI or Tableau can help.
- Automation: Adding macros or VBA scripts can reduce manual data entry.
- Integration: Linking the dashboard with POS systems can make data collection real-time.
- Collaboration: Using Excel Online or Google Sheets can enable multiple managers to work together.
Best Practices for the Store Operations KPI Dashboard
To get the most out of the dashboard, follow these best practices:
- Define Clear KPIs: Ensure all KPIs are relevant and measurable.
- Keep It Simple: Avoid overloading with too many KPIs. Stick to the most impactful ones.
- Update Regularly: Enter actual data and review performance monthly.
- Use Conditional Formatting Wisely: Green for positive, red for negative – keep it intuitive.
- Review Trends, Not Just Numbers: Look for patterns in customer behavior and sales.
- Involve Staff: Share dashboard insights with team members to encourage accountability.
How to Create a Store Operations KPI Dashboard in Excel
Here is a step-by-step process to build the dashboard:
- Plan KPIs: Decide which metrics to track (sales, customers, costs, etc.).
- Create KPI Definition Table: Add KPI names, units, formulas, and type.
- Set Targets: Enter monthly and yearly targets in the Target Sheet.
- Enter Previous Year Data: Add historical numbers for comparison.
- Input Actual Data: Update monthly performance in the Actual Numbers Input sheet.
- Design Dashboard Page: Use formulas, pivot tables, and charts.
- Add Interactivity: Include slicers, drop-downs, and conditional formatting.
- Test and Refine: Validate calculations and ensure visuals are clear.
Conclusion
A Store Operations KPI Dashboard in Excel is a practical, affordable, and powerful tool for retailers. It helps store managers, regional heads, and business owners monitor performance, spot trends, and take corrective action. With structured sheets, interactive visuals, and clear KPI definitions, this dashboard ensures retail operations stay efficient and profitable.
When used correctly, it becomes more than a reporting tool – it becomes a decision-making system.
Frequently Asked Questions (FAQs)
- What are the most important KPIs for store operations?
The key KPIs include sales per square foot, conversion rate, customer footfall, shrinkage percentage, average transaction value, and labor cost percentage.
- Why should I use Excel for a KPI dashboard?
Excel is cost-effective, widely available, and easy to customize. Most managers are familiar with it, reducing the need for additional training.
- Can this dashboard be used for multiple stores?
Yes. You can either create separate dashboards for each store or combine data to analyze performance across multiple branches.
- How often should I update the dashboard?
The best practice is to update it monthly. However, if data is available daily or weekly, more frequent updates can provide deeper insights.
- Can I integrate this dashboard with POS systems?
Yes. By linking Excel to databases or using Power Query, you can automate data imports from POS systems to reduce manual work.
- What if my store operations expand beyond Excel’s capacity?
If the dataset becomes too large, consider migrating to tools like Power BI, Tableau, or Google Data Studio for scalability and advanced visualizations.
- Is this dashboard suitable for online stores?
While it is designed for physical stores, online stores can adapt it by replacing KPIs like footfall with website traffic and conversion rate with online sales.
Visit our YouTube channel to learn step-by-step video tutorials
Watch the step-by-step video tutorial:
Click to buy Store Operations KPI Dashboard in Excel