New: NextGenTemplates Academy - video courses on Excel formulas with AI and Pivot Tables & dashboards. Early-bird: 20% off with code EARLYBIRD20 - first 20 orders only. See the courses →
  • Learn Excel (Free Course)
    • 1. Shortcut Keys
    • 2. Fill & Flash Fill
    • 3. Find & Replace
    • 4. Sort & Filter
    • 5. Formulas & Functions
    • 6. Data Validation
    • 7. Conditional Formatting
    • 8. Basic Charts
    • 9. Advanced Charts
    • 10. Pivot Tables
    • 11. Excel Dashboards
    • 12. VBA Course
    • 13. Excel Formulas with AI
  • Templates
  • Tutorials
    • Charts and Visualization
    • VBA
    • Excel Tips and Tricks
    • Excel Dashboards
    • Power Pivot & DAX
  • Power BI
  • Template Store
    • Ready to Use Templates
  • Courses
  • Academy
    • Excel + AI Mastery: 100 Formulas
    • Excel Pivot Tables & Dashboards
  • About Us
  • Contact Us

PK: An Excel Expert

Transforming Data into Decisions

Tag: 3D Chart

3D Progress Circle in Excel
Charts and Visualization

How to WOW Your Boss: 3D Progress Circle in Excel

August 28, 2023March 1, 2025 PKComments Off on How to WOW Your Boss: 3D Progress Circle in Excel
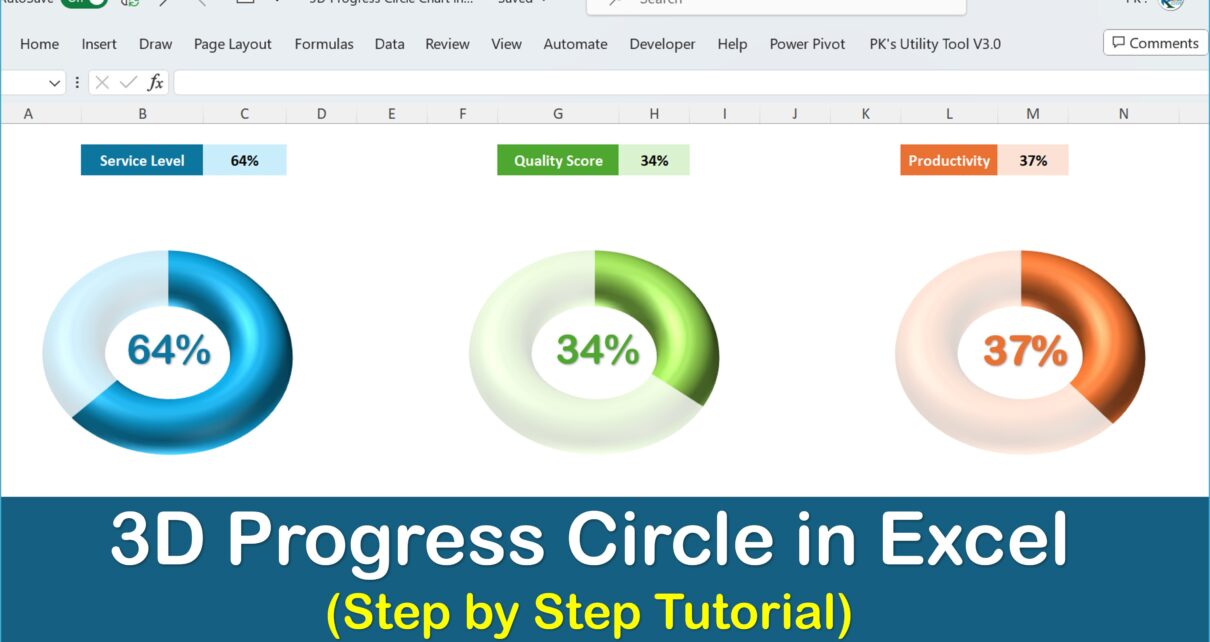
In today's fast-paced digital world, it's not just about delivering information, but more importantly, how you present it. Consequently, stepping away from conventional presentation methods is essential. For this reason,
Read More
Charts and Visualization

Truck Graph in Excel

February 7, 2023March 2, 2025 PKComments Off on Truck Graph in Excel
Excel is a powerful tool for creating a wide range of charts and infographics. including Truck Graph to show Occupancy or workload. In this blog post, we will look at the
Read More
Quick 3D Container Chart
Charts and Visualization

Quick 3D Container chart in Excel

January 3, 2023February 20, 2025 PKComments Off on Quick 3D Container chart in Excel
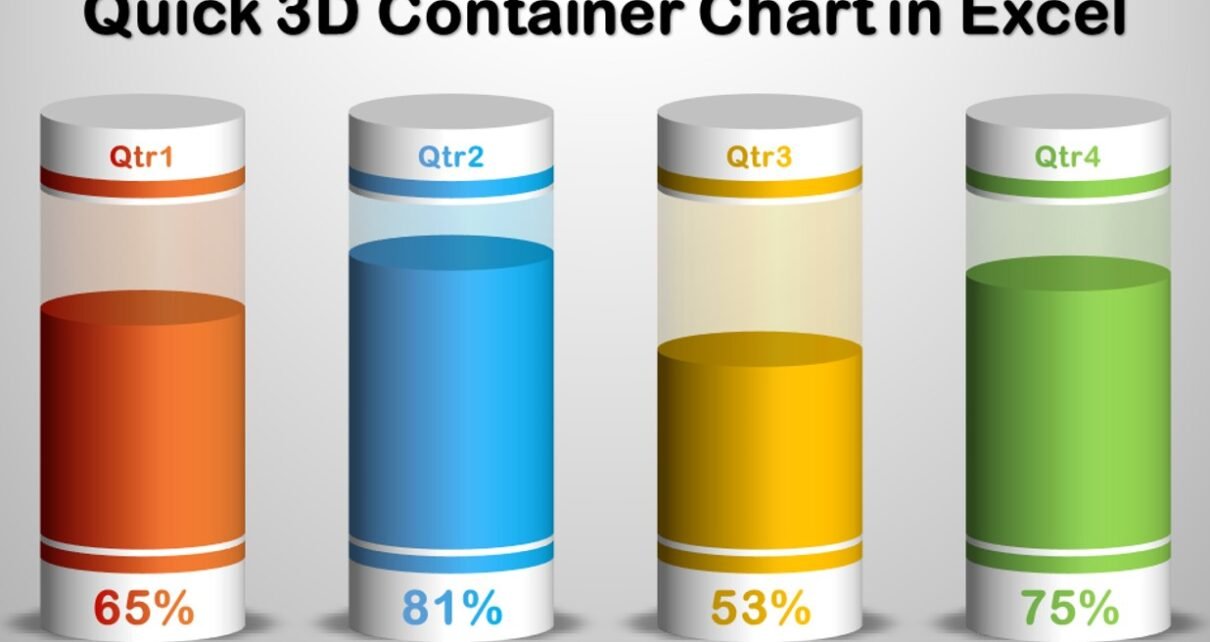
In this article, we have created a beautiful 3D container chart in Microsoft Excel. We have used a 3D Stacked column chart to create this chart. You can use this
Read More
RAG Conditional Formatting in 3D Chart
Charts and Visualization

RAG Conditional Formatting in 3D Chart

March 10, 2020March 5, 2025 PKComments Off on RAG Conditional Formatting in 3D Chart
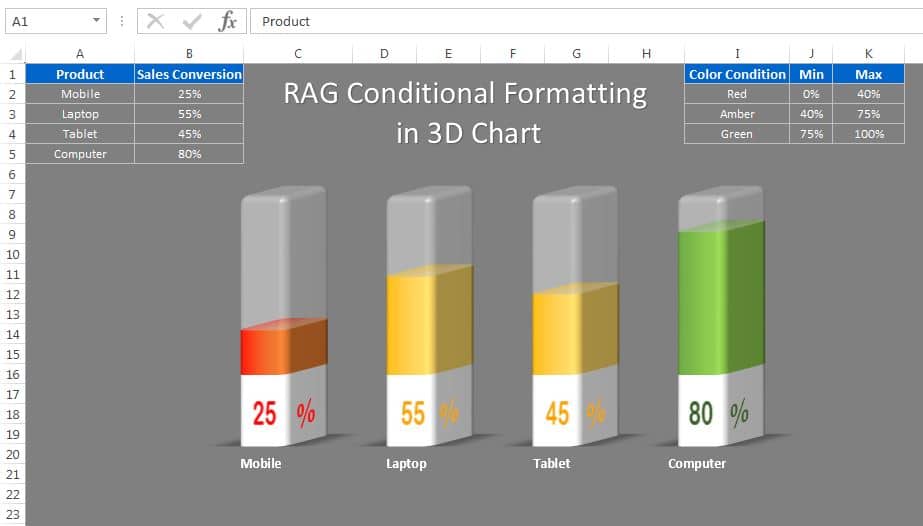
In this article, we have created a beautiful 3D chart to display the Sales conversion for different products. We have used RAG (Red, Amber and Green) Conditional Formatting in this
Read More
3D Container Pivot Chart in Excel with Slicer and Timeline
Charts and Visualization

3D Container Pivot Chart in Excel with Slicer and Timeline

May 15, 2019October 9, 2026 PKComments Off on 3D Container Pivot Chart in Excel with Slicer and Timeline
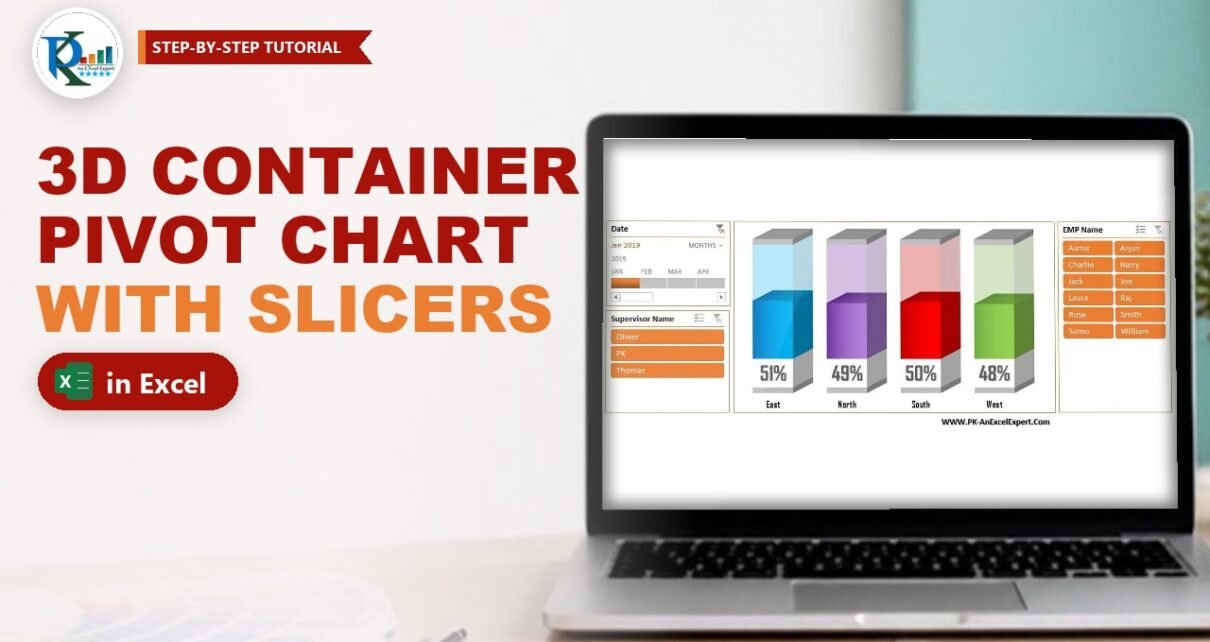
A 3D container pivot chart shows a percentage as a liquid level inside a glass-like box: the solid part is what you achieved and the see-through part is what is
Read More
  • Learn Excel (Free Course)
    • 1. Shortcut Keys
    • 2. Fill & Flash Fill
    • 3. Find & Replace
    • 4. Sort & Filter
    • 5. Formulas & Functions
    • 6. Data Validation
    • 7. Conditional Formatting
    • 8. Basic Charts
    • 9. Advanced Charts
    • 10. Pivot Tables
    • 11. Excel Dashboards
    • 12. VBA Course
    • 13. Excel Formulas with AI
  • Templates
  • Tutorials
    • Charts and Visualization
    • VBA
    • Excel Tips and Tricks
    • Excel Dashboards
    • Power Pivot & DAX
  • Power BI
  • Template Store
    • Ready to Use Templates
  • Courses
  • Academy
    • Excel + AI Mastery: 100 Formulas
    • Excel Pivot Tables & Dashboards
  • About Us
  • Contact Us
Copyright © 2023 PK-AnExcelExpert.com - Privacy Policy