New: NextGenTemplates Academy - video courses on Excel formulas with AI and Pivot Tables & dashboards. Early-bird: 20% off with code EARLYBIRD20 - first 20 orders only.See the courses →
PKComments Off on Farm Supply Chains Dashboard in Power BI
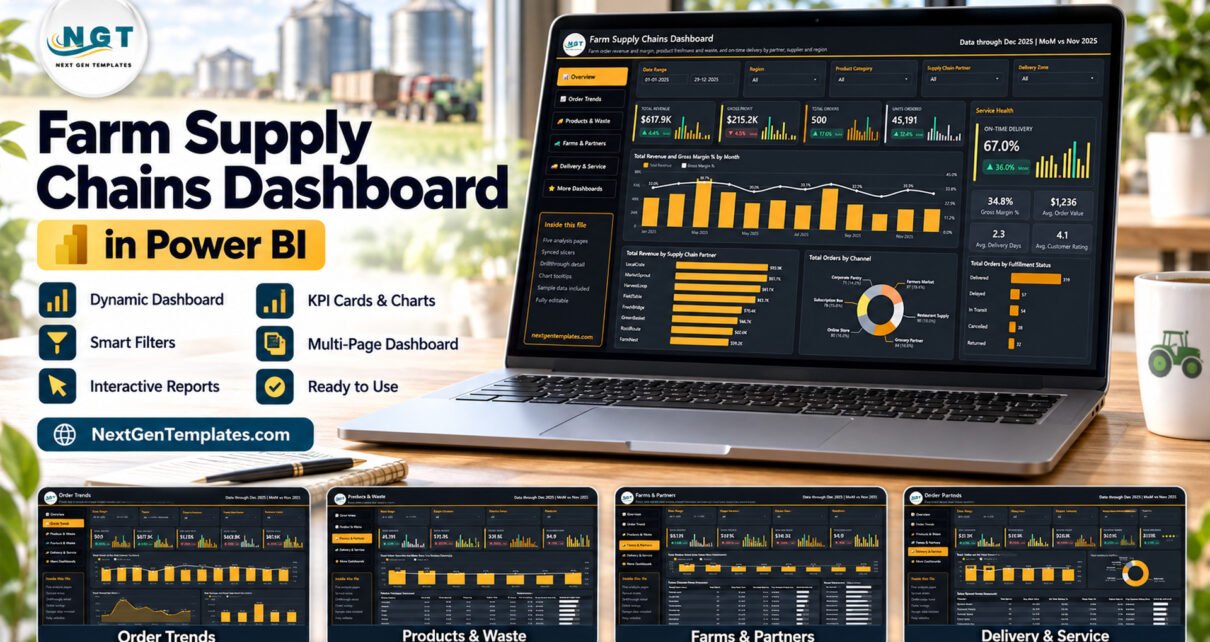
The Farm Supply Chains Dashboard in Power BI packs 500 sample farm orders into a 5-page Power BI Desktop report with 25 KPI cards, 15 visuals and 5 slicers on
PKComments Off on Farm Supply Chains Dashboard in Excel
Farm supply chain reporting often starts as a practical Excel problem: orders sit in one file, supplier notes in another, fulfillment updates somewhere else, and quality performance only gets discussed
PKComments Off on Remote Crop Monitoring Dashboard in Power BI
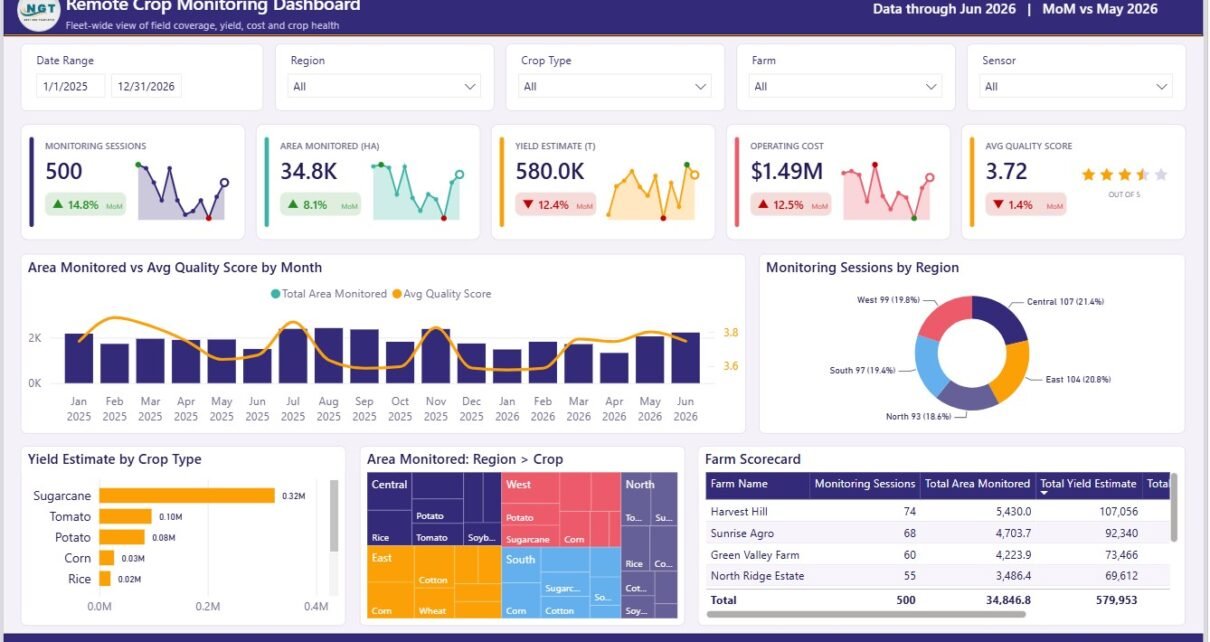
Global agriculture teams are using more remote sensing, drone visits, and field monitoring data than ever, but the reporting layer often remains scattered across spreadsheets, field logs, and one-off summaries.
PKComments Off on Farm-to-Table Startups Dashboard in Excel
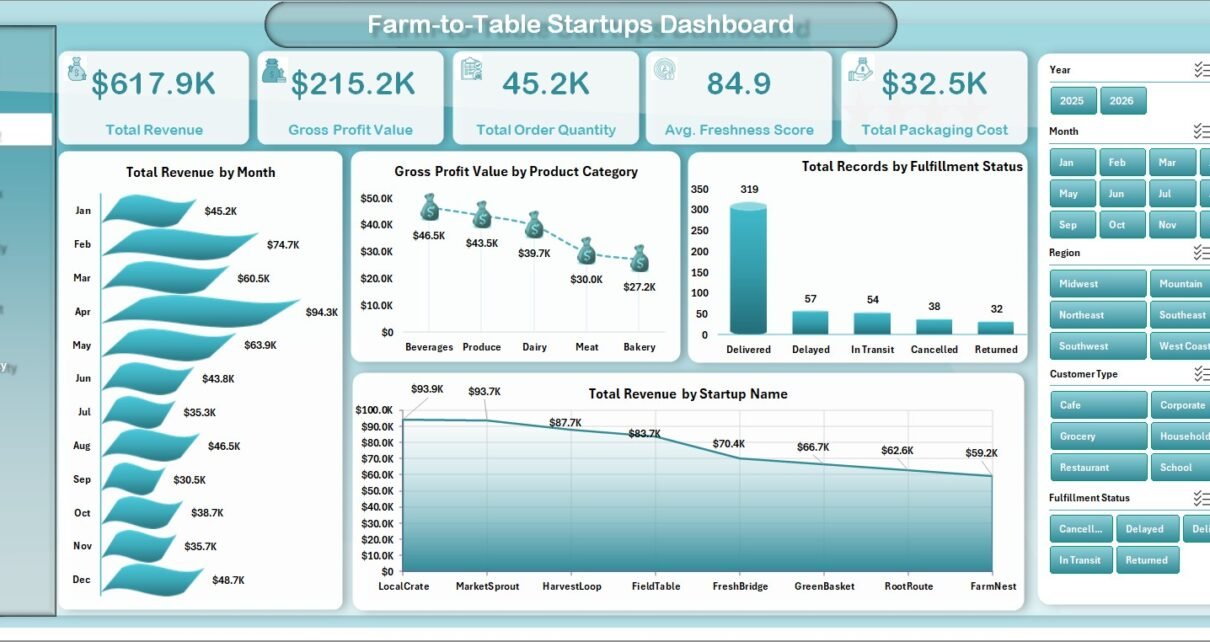
Farm-to-table startups often manage revenue, order quantity, sourcing cost, packaging cost, freshness score, delivery reliability, and customer ratings across separate exports. The Farm-to-Table Startups Dashboard in Excel gives founders and
PKComments Off on Agriculture and Farm Dashboard in Power BI
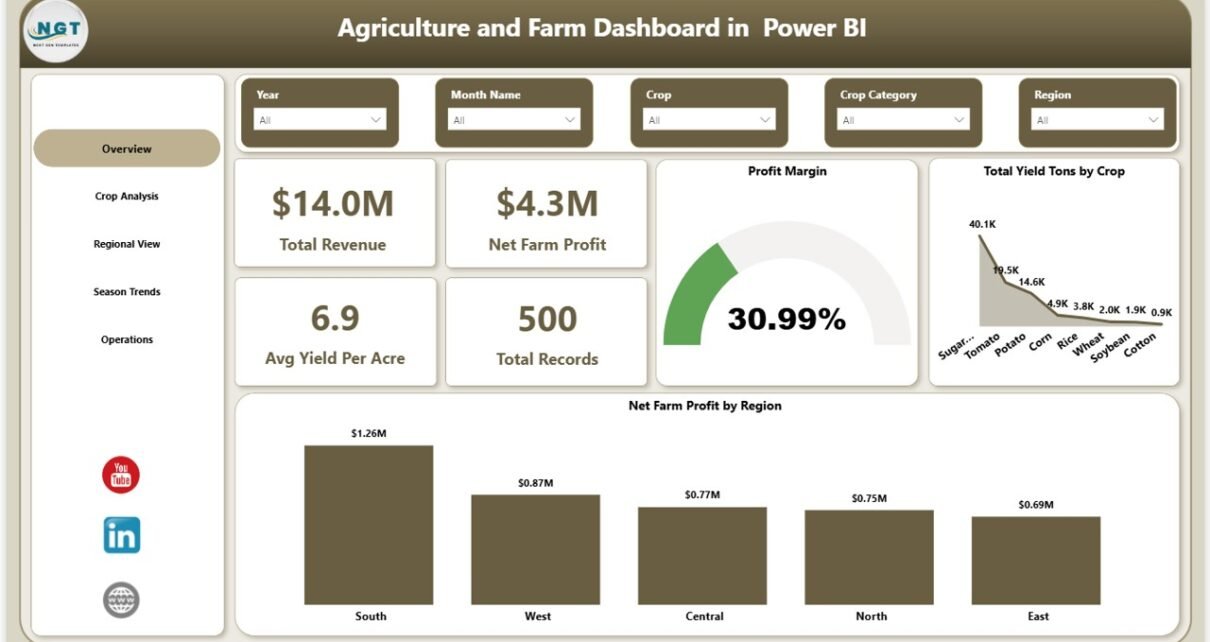
Agriculture and Farm Dashboard in Power BI Agriculture and Farm Dashboard in Power BI is a powerful, ready-to-use analytical solution designed for modern farming businesses that want to track revenue,
PKComments Off on Agriculture and Farm Dashboard in Excel
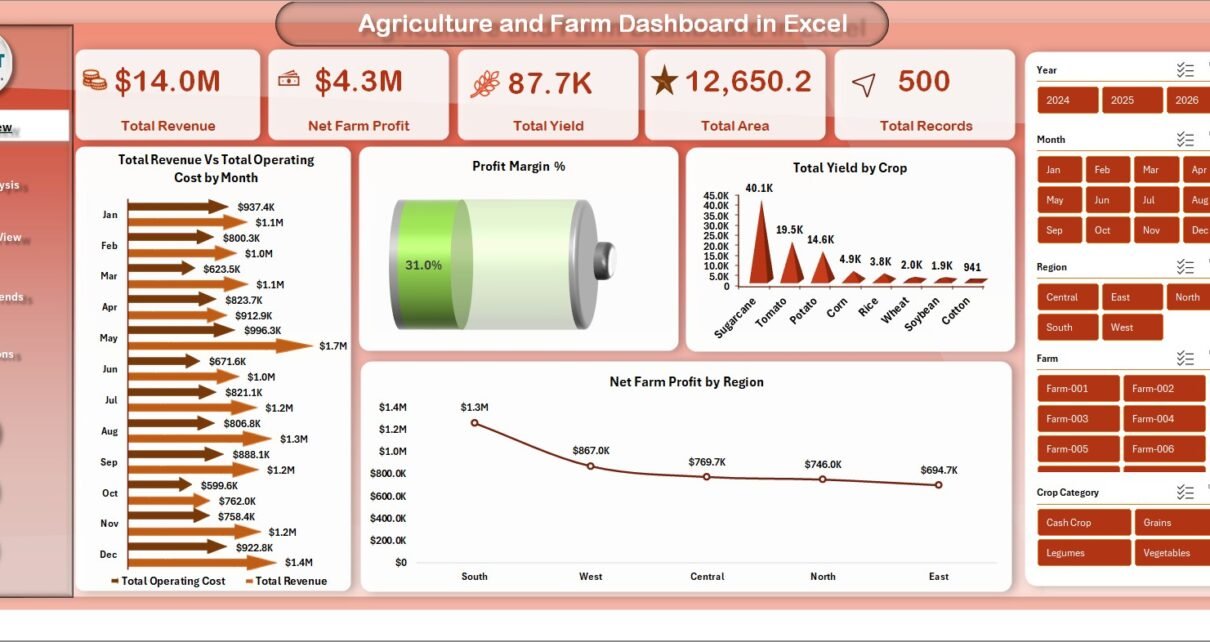
Agriculture and Farm Dashboard in Excel is a powerful, ready-to-use Excel template that helps farmers, agronomists, and agricultural business owners track farm revenue, crop yield, operating costs, and profitability across
PKComments Off on Poultry Farming Dashboard in Excel
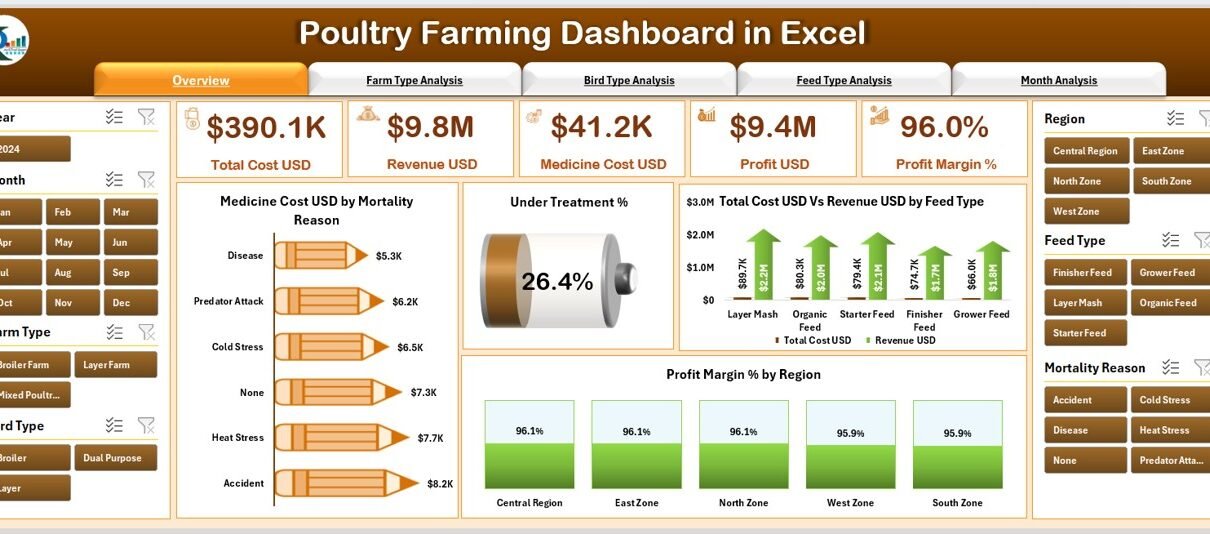
Poultry farming plays a major role in the agriculture industry. Farmers manage thousands of birds, handle multiple costs, track daily production, and monitor revenue trends. As poultry farms grow, decisions
PKComments Off on Agriculture KPI Scorecard in Excel
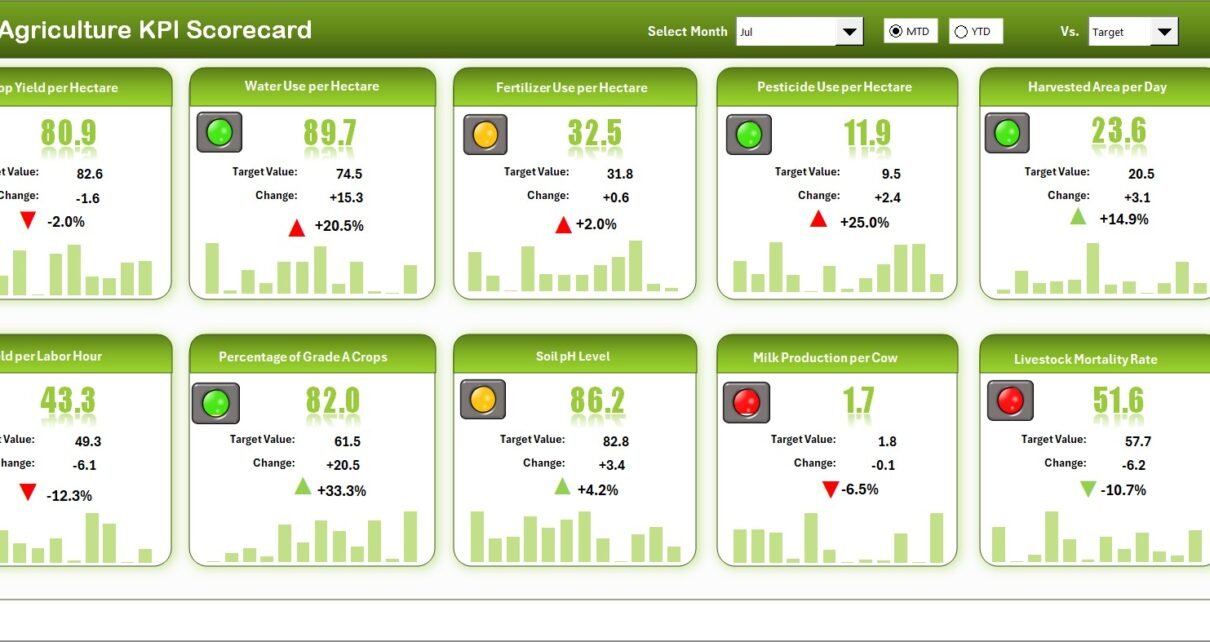
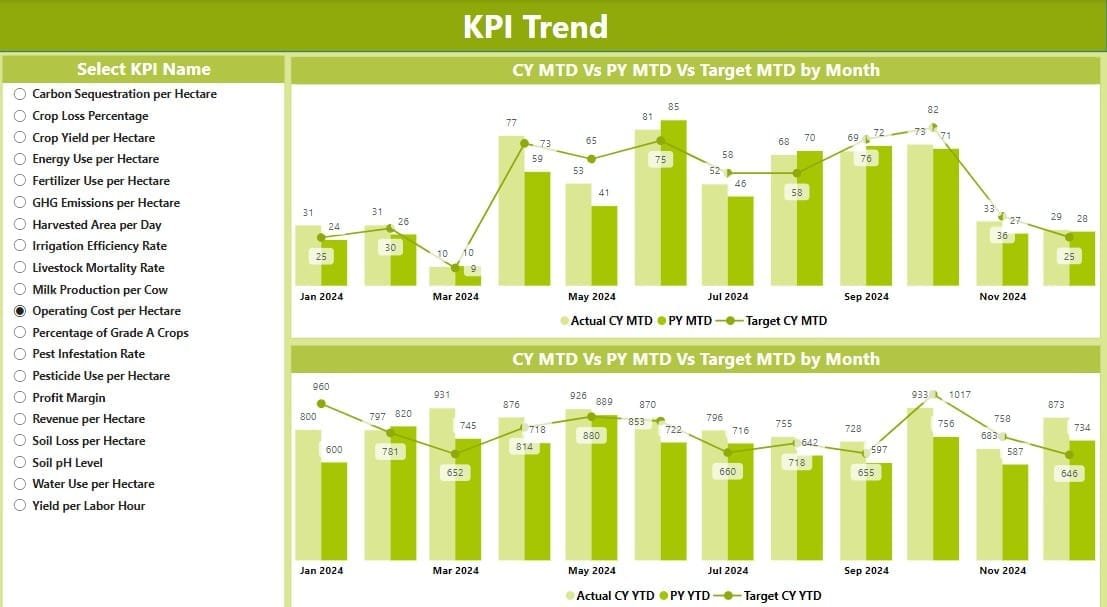
An Agriculture KPI Scorecard in Excel is a structured, visual reporting system that tracks key agricultural metrics. It helps users compare Actual vs Target performance for each KPI (Key Performance
PKComments Off on Farm Management KPI Dashboard in Excel
In the rapidly evolving world of agriculture, managing a farm efficiently is crucial for success. The Farm Management KPI Dashboard in Excel stands out as an indispensable tool for farmers
PKComments Off on Agriculture KPI Dashboard in Power BI
In the dynamic field of agriculture, tracking performance and operational metrics is vital for making informed decisions. The Agriculture KPI Dashboard in Power BI serves as an essential tool, providing