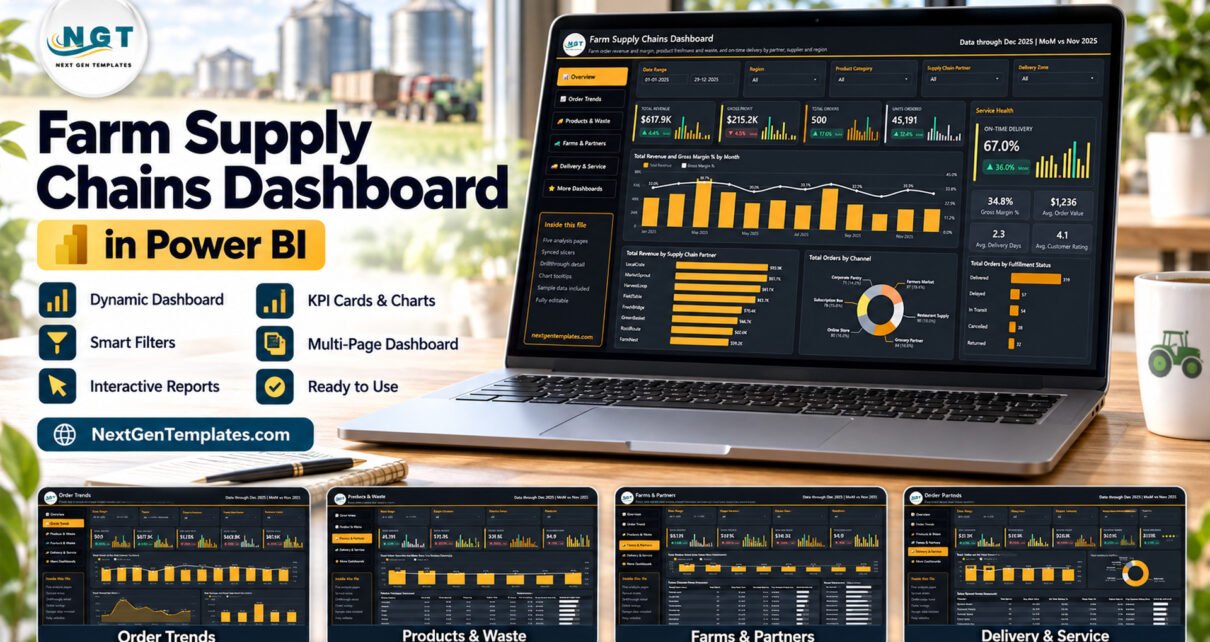
The Farm Supply Chains Dashboard in Power BI packs 500 sample farm orders into a 5-page Power BI Desktop report with 25 KPI cards, 15 visuals and 5 slicers on every page. It follows 8 supply chain partners, 8 farm suppliers, 8 product categories, 6 sales channels and 6 delivery zones across 2025, and every page opens already populated.
Farm supply businesses rarely lose money in one obvious place. Margin slips on a low-priced category, produce spoils before it ships, a partner misses delivery windows or one zone keeps running late. This Power BI template brings those signals together: order revenue and margin, product freshness and waste, and on-time delivery by partner, supplier and region, in one file you own.
If you already follow our agriculture reports, such as the Agriculture and Farm Dashboard in Power BI, this one moves further down the chain, from the farm gate to the customer’s door.
Key Features of the Farm Supply Chains Dashboard in Power BI
- Five analysis pages. Overview, Order Trends, Products & Waste, Farms & Partners and Delivery & Service sit behind a left-hand menu, with a sixth More Dashboards page for other templates and services.
- 25 KPI cards with month-on-month change. Every card compares December 2025 with November 2025 and shows a 12-month mini column trend, so a rising waste rate or falling margin stands out immediately.
- Consistent slicers. Date Range, Region, Product Category and Supply Chain Partner are on every page, and each page adds one filter: Delivery Zone, Fulfillment Status, Product, Channel or Customer Type.
- Waste and freshness beside revenue. The sample shows 1,705 units wasted out of 45,191 ordered, a 3.8% waste rate and an average freshness score of 84.9.
- Three scorecards. Product Category, Supply Chain Partner and Sales Channel Service scorecards rank the rows that matter on margin, waste, on-time delivery and star rating.
- Drillthrough and tooltips. A hidden Details page takes drillthrough from nine fields including partner, farm supplier, product and delivery zone, and two tooltip pages add trend and metric detail on hover.
- A 24-column data source. Data.xlsx holds Order ID, Date, Supply Chain Partner, Region, Farm Supplier, Product Category, Product, Channel, Customer Type, Delivery Zone, Fulfillment Status, Order Quantity, Unit Price, Revenue, Procurement Cost, Packaging Cost, Logistics Cost, Waste Quantity, Returned Quantity, Freshness Score, Customer Rating, Delivery Days, Target Delivery Days and Carbon Saved.
Dashboard Pages Explanation
The report opens on the Overview. Every analysis page shares the same header, the note “Data through Dec 2025 | MoM vs Nov 2025”, and an “Inside this file” panel in the menu.
Page 1: Overview
The top row shows Total Revenue ($617.9K, up 4.4% MoM), Gross Profit ($215.2K, down 4.5%), Total Orders (500) and Units Ordered (45,191). A Service Health panel adds On-Time Delivery at 67.0% plus Gross Margin % (34.8%), Avg. Order Value ($1,236), Avg. Delivery Days (2.3) and Avg. Customer Rating (4.1).
Charts include Total Revenue and Gross Margin % by Month, Total Revenue by Supply Chain Partner (LocalCrate leads at $93.9K, FarmNest trails at $59.2K), Total Orders by Channel (Farmers Market has the largest share at 97 orders) and Total Orders by Fulfillment Status, where 319 orders are Delivered, 57 Delayed, 54 In Transit, 38 Cancelled and 32 Returned.
Page 2: Order Trends
Cards cover Total Orders, Total Revenue, Avg Order Value, Supply Cost ($402.8K) and Logistics Cost ($61.0K). Total Orders and On Time Delivery % by Month pairs volume with service, and Total Revenue by Month shows March as the peak month at $87.0K. Total Revenue and Total Supply Cost by Quarter sets Q1 revenue of $197.0K against $124.5K of supply cost, with each later quarter alongside.
Page 3: Products & Waste
Cards show Units Ordered, Units Wasted (1,705), Waste Rate (3.8%), Avg Unit Price ($14.32) and Freshness Score (84.9). Total Order Quantity and Waste Rate % by Product Category compares Beverages, Produce, Dairy, Bakery, Meat, Meal Kits, Pantry and Flowers; Beverages carries the most volume and the highest waste rate at 4.3%.
The Product Category Scorecard lists Gross Profit, Gross Margin %, Waste Rate % and Avg. Freshness Score for each category, and Total Waste Quantity by Region puts Mountain highest at 331 units and Midwest lowest at 232.
Page 4: Farms & Partners
Cards track Procurement Cost ($309.2K), Gross Profit, Gross Margin (34.8%), Logistics / Order ($121.97) and Carbon Saved (43,029). Total Revenue and Gross Margin % by Farm Supplier ranks eight suppliers, from Cedar Field Collective at a 37.3% margin down to Green Valley Growers at 28.9%.
The Supply Chain Partner Scorecard compares Total Orders, Avg. Order Value, Gross Margin %, Total Logistics Cost, On Time Delivery % and a star rating per partner. MarketSprout handles the most orders (75), while FarmNest posts the best on-time rate at 71.4%.
Page 5: Delivery & Service
Cards show Avg Delivery Days (2.3), Delay Rate (11.4%), Return Rate (6.4%), Cancellation Rate (7.6%) and Customer Rating (4.1 out of 5). Total Orders and On Time Delivery % by Delivery Zone exposes the spread between Suburban at 54.9% and Urban Core at 72.7%.
Total Orders by Fulfillment Status shows Delivered at 63.8% of orders, and the Sales Channel Service Scorecard ranks Farmers Market, Restaurant Supply, Grocery Partner, Online Store, Subscription Box and Corporate Pantry on on-time delivery, delay rate, return rate and rating.
Page 6: More Dashboards
The last visible page lists other NextGenTemplates Power BI templates, what every file includes and our custom dashboard services. It does not change the analysis pages.
Farm Supply Chains Dashboard in Power BI vs. Tableau / Qlik vs. Paid Supply Chain Software – Feature Comparison
| Feature | This Power BI template | Tableau / Qlik build | Zoho Inventory / NetSuite ERP |
|---|---|---|---|
| Cost | ✅ $17.99 one-time | Per-user subscription licences | Recurring subscription, often per user |
| Platform | Power BI Desktop (free, Windows) | Tableau Desktop or Qlik Sense | Vendor web app |
| Setup time | ✅ Open the .pbix, sample data loaded | Design every page from scratch | Implementation and data migration project |
| Ready-made farm supply pages | ✅ 5 pages, 25 KPI cards, 15 visuals | Blank canvas | Generic inventory reports |
| Customizable fields and visuals | ✅ Every visual and measure editable | ✅ Yes | Limited to vendor options |
| Real-time team collaboration | Needs Power BI Service licences | Needs server or cloud licences | ✅ Built in |
| Mobile access | Power BI mobile app after publishing | Mobile apps with licences | ✅ Built in |
| Share with link | Through the Power BI Service | Through Tableau Cloud or Qlik Cloud | ✅ Yes |
| Orders, stock and traceability records | No – reporting only | Depends on your connectors | ✅ Transactions and stock |
For growers and distributors that want order, waste and delivery analysis without an ERP subscription, this Power BI template sits in the sweet spot.
Who Should Use This Template
Perfect for:
- Operations and finance leads at farm cooperatives, food hubs and farm-to-business distributors
- Supplier and partner managers comparing farms, logistics partners and sales channels
- Power BI analysts who want a finished order-level model to adapt
- Consultants reporting farm supply performance to owners and buyers
Not a fit if:
- You need an ERP, order-entry or inventory system – the file reports on data, it does not record transactions or stock
- You need lot traceability, food-safety (FSMA or HACCP) records or certification evidence – the data has no such fields
- You want live order feeds without setting up a data connection
- You only use a Mac and have no Windows machine for Power BI Desktop
Real-World Use Cases
Elena runs operations for a regional food hub. Every Monday she opens Delivery & Service, filters to the last month and compares zones. Seeing Suburban deliveries well behind Urban Core, she brings the zone chart and the channel scorecard to her routing meeting and tests a second suburban delivery slot.
Marcus manages supplier relations for a farm-to-restaurant distributor. Before renewing seasonal terms he filters Farms & Partners by Product Category, compares gross margin by farm supplier and checks the Products & Waste page to see which categories spoil most often.
Aisha is a freelance Power BI consultant. She loads a cooperative’s order export into Data.xlsx under the same headers, refreshes, swaps the colours to the client’s brand and delivers a five-page report in an afternoon instead of building a model from scratch.
Advantages of This Power BI Template
- Waste and delivery in the same view as money. Most sales reports stop at revenue; here Waste Rate, Freshness Score and On-Time Delivery sit on the same pages as margin.
- Comparable pages. Four shared slicers mean a filter set on one page tells the same story on the next.
- Month-on-month context on every card. Each card shows its change against the previous month and a 12-month trend, so nobody has to rebuild a comparison.
- One-time cost. The file costs less than a single month of most per-user analytics subscriptions.
- Room to grow. The model holds 85 DAX measures, and every visual, colour and measure can be edited in Power BI Desktop.
Opportunities for Improvement
- No live connection out of the box. The report reads Data.xlsx; linking an ERP or order system means repointing Power Query yourself.
- One year of sample data. The sample covers 2025 only, so year-over-year views need a second year of your own records.
- Carbon Saved has no defined unit. The column is a sample value; define how you measure it before quoting it.
- No stock or shelf-life dates. Waste is recorded per order, not per batch or expiry date, so it is not a traceability tool.
- Sharing needs licences. Publishing to the Power BI Service follows Microsoft’s licensing rules.
Best Practices
- Keep the 24 headers unchanged when you paste your own orders, so every measure keeps working.
- Fill in Delivery Days and Target Delivery Days for every order so the delivery cards and zone charts are built on complete rows.
- Record waste at order level consistently so category and region waste rates stay comparable.
- Use the drillthrough Details page to check the rows behind a surprising partner or category before acting on it.
- Refresh on a fixed schedule, such as the first working day of each month, so the MoM cards compare complete months.
Explore Relevant Templates
- Farm-to-Table Startups Dashboard in Power BI – read the Farm-to-Table Startups walkthrough.
- Cold Chain Logistics Dashboard in Power BI – see the Cold Chain Logistics guide.
- Organic Seeds Providers Dashboard in Power BI – explained in the Organic Seeds Providers post.
- Grocery Delivery Services Dashboard in Power BI – order and delivery reporting for grocery delivery.
- For a monthly KPI view in Excel, read about the Food Supply Chain KPI Scorecard in Excel.
An Excel workbook edition of this farm supply topic is in preparation.
Frequently Asked Questions
What does this farm supply chain Power BI template track?
It tracks 25 KPI cards across five pages, including Total Revenue, Gross Margin %, Supply Cost, Waste Rate, Freshness Score, Procurement Cost, Carbon Saved, On-Time Delivery and Delay Rate, with 15 visuals by month, quarter, partner, farm supplier, category, region, channel and delivery zone.
Do I need a paid Power BI licence?
No licence is needed to open and edit the .pbix. Power BI Desktop is free from Microsoft and runs on Windows. Publishing to the Power BI Service or sharing to the mobile app needs whatever licences Microsoft requires for your organisation.
How long does setup take?
The report opens with sample data straight away. To use your own data, paste your orders into Data.xlsx under the same 24 headers, update the file path in Power Query and click Refresh. Most of the effort goes into cleaning your own export.
Is this a traceability or food-safety system?
No. The template analyses order, cost, waste and delivery figures. It does not track lots, record FSMA or HACCP checks, manage certifications or replace an ERP. Keep those records in dedicated systems and use this report for performance analysis.
How does it compare to Zoho Inventory or NetSuite?
Those platforms record transactions and stock for a recurring fee. The Farm Supply Chains Dashboard in Power BI is a one-time purchase that gives you a finished analysis model and five pages; you supply the data and any Power BI sharing licences.
Is the sample data real?
No. The 500 orders, the partner and farm names and every figure are fictional demo data. Replace them with your own records before using the report for decisions.
About the Author
Built by PK – Microsoft Certified Professional with 15+ years of Excel, Google Sheets and Power BI experience and founder of NextGenTemplates, reaching 300K+ subscribers across YouTube channels. Every template is hand-built and tested before release.
Conclusion
If your farm supply business needs one place to see revenue, margin, waste, freshness and delivery performance by partner, supplier, category and zone, this five-page report gives you that view without an ERP subscription. Open it, explore the sample, then load your own orders.
👉 Click here to Purchase the Farm Supply Chains Dashboard in Power BI
✅ Instant download · One-time payment · No subscription
🎥 Watch more tutorials at Youtube.com/@PKAnExcelExpert
Last updated: September 2026