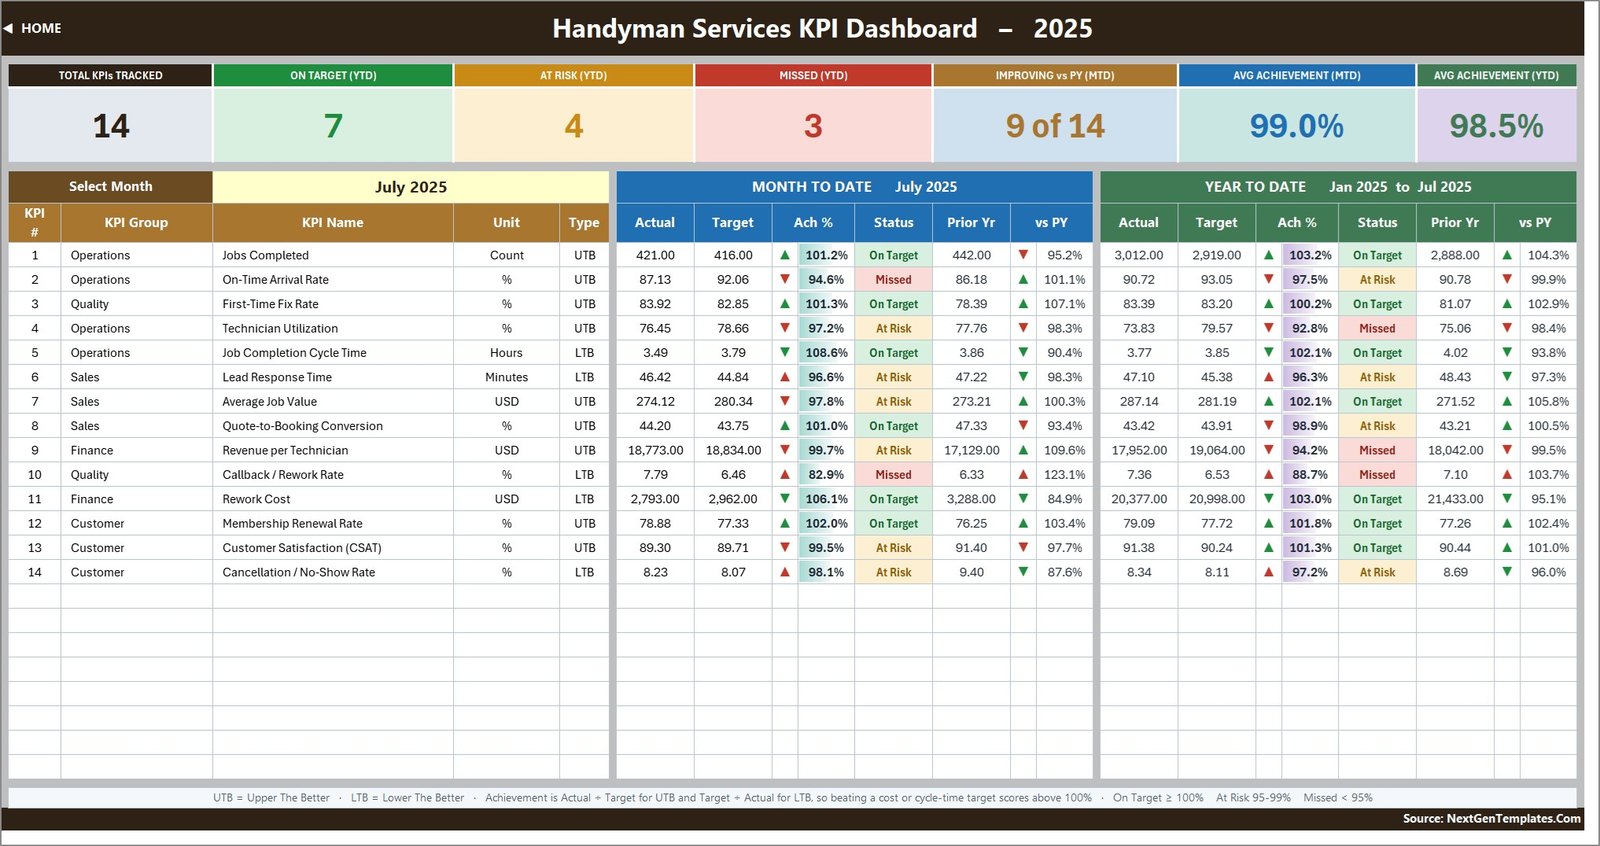
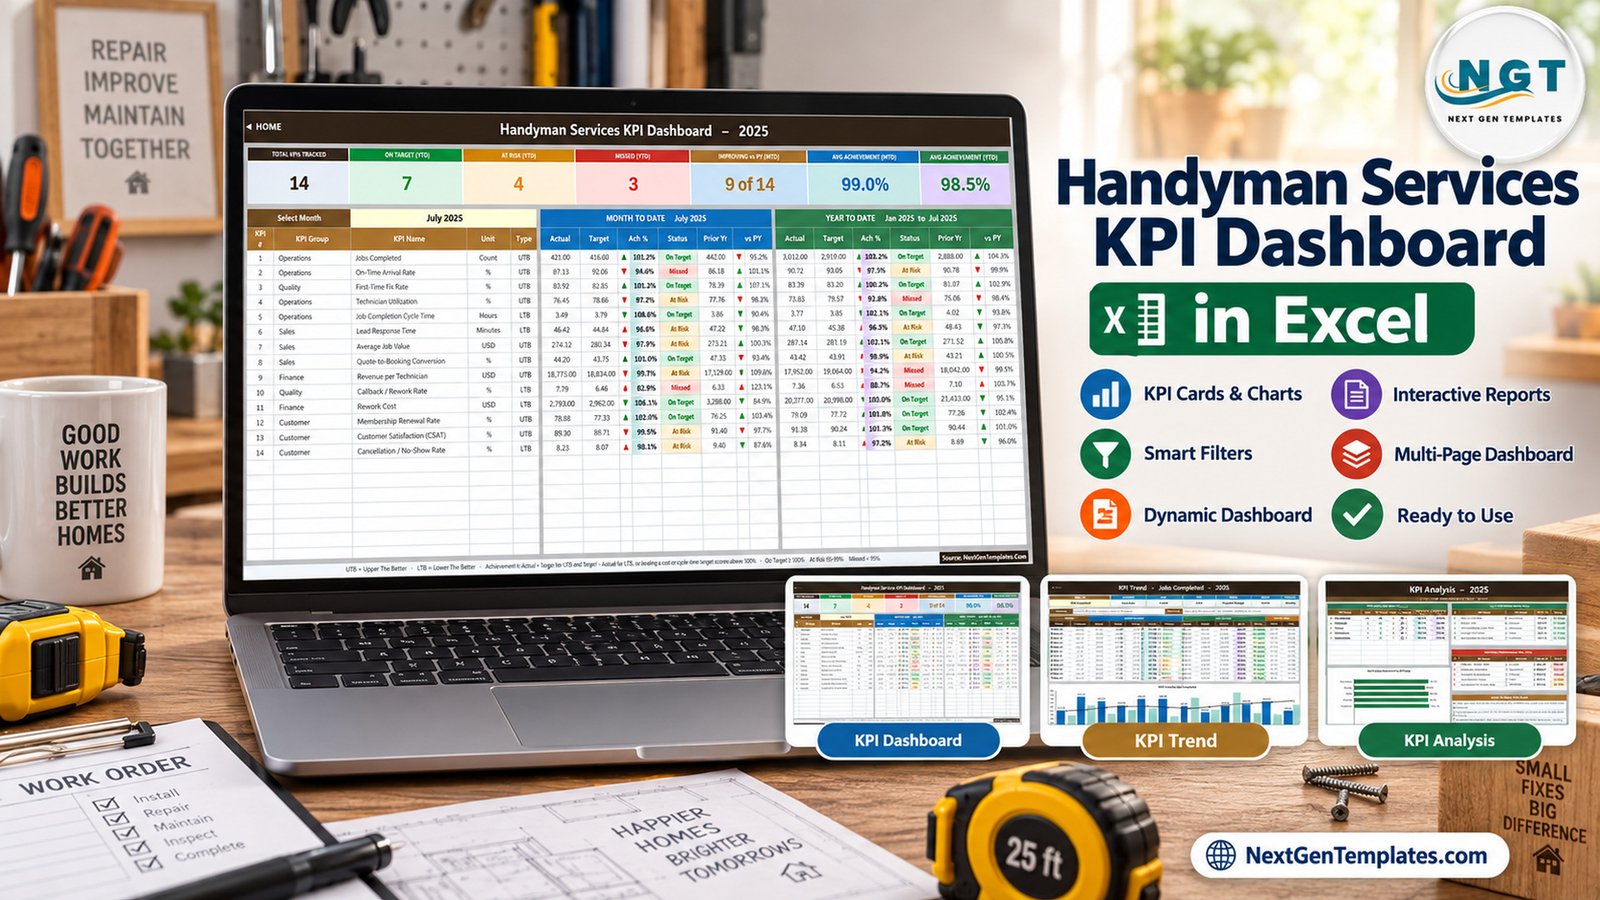
The Handyman Services KPI Dashboard in Excel puts 14 handyman services KPIs from 5 groups on one monthly scorecard. For each KPI it shows MTD and YTD actual, target, achievement percentage, a traffic-light status and a prior-year comparison. With the July 2025 sample month selected, the summary cards read 7 KPIs On Target, 4 At Risk and 3 Missed for the year to date, with average achievement of 99.0% MTD and 98.5% YTD.
Handyman businesses usually keep work orders in a booking app, quotes in email, callbacks in a notebook and revenue in the accounts, so a monthly review means stitching several sources together. This Excel KPI Dashboard template puts operations, quality, sales, finance and customer KPIs in one workbook, driven by a single month dropdown. It is the KPI Dashboard family from NextGenTemplates: a month picker, traffic lights, a KPI Trend page and a KPI Analysis page. It is not an analytical data dashboard and not the separate Handyman Services KPI Scorecard template.
Key Features of the Handyman Services KPI Dashboard in Excel
- 14 ready-made KPIs for handyman companies. Jobs Completed, On-Time Arrival Rate, First-Time Fix Rate, Technician Utilization, Job Completion Cycle Time, Lead Response Time, Average Job Value, Quote-to-Booking Conversion, Revenue per Technician, Callback / Rework Rate, Rework Cost, Membership Renewal Rate, Customer Satisfaction (CSAT) and Cancellation / No-Show Rate.
- One month picker. Cell D6 on the KPI Dashboard lists the twelve months of the reporting year. Changing it recalculates the scorecard, the seven summary cards and the KPI Analysis page.
- Direction-aware achievement. Achievement is Actual divided by Target for Upper The Better KPIs and Target divided by Actual for Lower The Better KPIs. The sample has 9 UTB and 5 LTB KPIs, so cutting cycle time, lead response time, callbacks, rework cost or no-shows below target scores above 100%.
- Consistent status rules. On Target from 100%, At Risk from 95% to 99%, Missed below 95%, used on every page.
- Built to grow. The sheets are wired for 22 KPIs. Adding a row on KPI Definition feeds all three input sheets, the scorecard, the trend page and the analysis page.
- Formula-only. No macros, Power Query, Power Pivot or add-ins. It runs in Excel 2013 and later, and in Excel for the web.
Dashboard Pages Explanation
The workbook has 11 sheets. Ten are shown below. The eleventh, Support, holds helper calculations and needs no editing.
Home
The landing page links to the three dashboard pages (KPI Dashboard, KPI Trend, KPI Analysis), the three input sheets, and the reference sheets (KPI Definition, Read Me, Get More Templates). It also summarises the five things the template does: pick a month to read the whole scorecard, direction-aware scoring, adding or renaming KPIs without touching a formula, charts that follow the KPI you choose, and nothing to install or refresh.

KPI Dashboard
Seven cards sit across the top: Total KPIs Tracked (14), On Target YTD (7), At Risk YTD (4), Missed YTD (3), Improving vs PY MTD (9 of 14), Avg Achievement MTD (99.0%) and Avg Achievement YTD (98.5%). Below them, one row per KPI shows group, name, unit and type, then a Month To Date block and a Year To Date block. Each block has actual, target, achievement %, status, prior year and vs PY, with arrows whose colour reflects whether the movement is good for that KPI. For example, Job Completion Cycle Time fell from 3.86 hours last July to 3.49 hours, so its arrow points down in green and it scores 108.6% against a 3.79-hour target. Callback / Rework Rate went the other way: 7.79% against a 6.46% target, which is Missed at 82.9%.
KPI Trend
Choose a KPI in cell B4 and the page shows its group, unit, type, owner, priority, frequency, formula and definition. A twelve-month table lists MTD and YTD actual, target, prior year, achievement and status. Two charts follow: MTD Trend by Month and YTD Trend by Month, each with actual and prior-year columns and a target line. The screenshot shows Jobs Completed, a Critical KPI owned by the Dispatch Manager and defined as total repair and maintenance jobs finished by dispatched technicians. August, September and October are At Risk, December is Missed at 94.2%, the other eight months are On Target, and the year closes at 5,105 jobs against a target of 5,054.

KPI Analysis
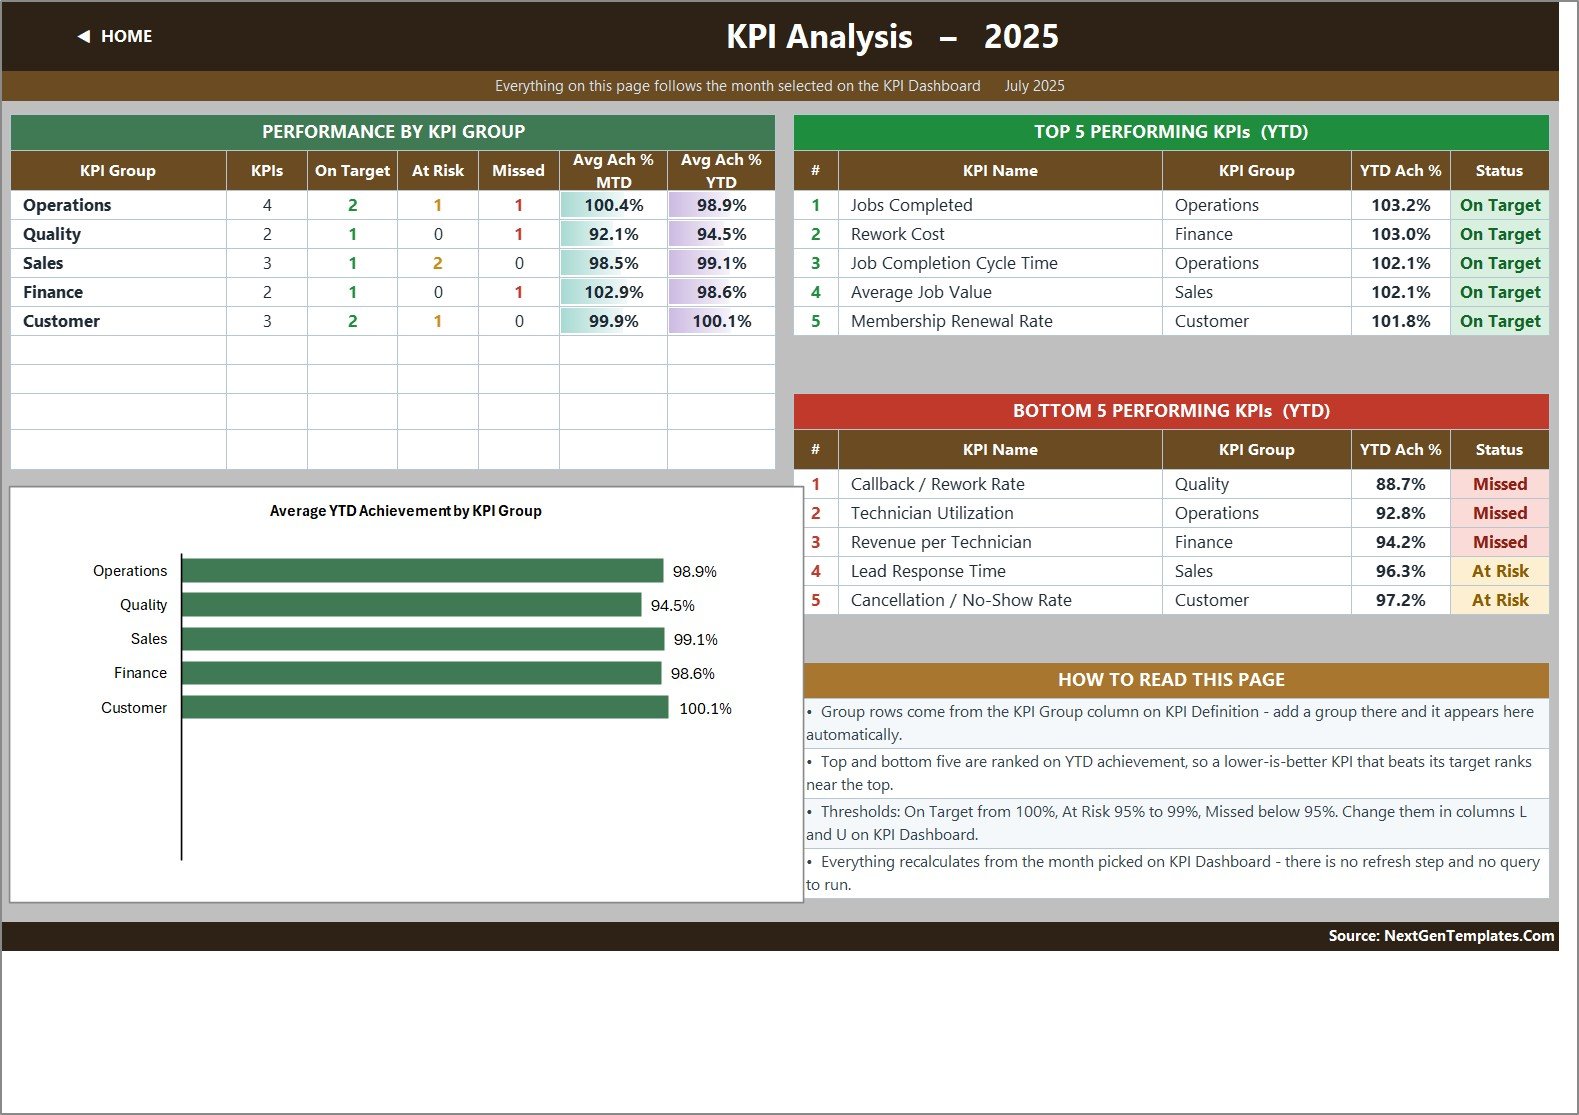
This page follows the month picked on the KPI Dashboard. Performance by KPI Group shows each group’s KPI count, On Target, At Risk and Missed counts, and average MTD and YTD achievement. In the sample, Customer leads at 100.1% YTD and Quality trails at 94.5%. The Average YTD Achievement by KPI Group chart shows the same comparison as bars. Top 5 and Bottom 5 Performing KPIs (YTD) rank the list: Jobs Completed tops it at 103.2%, followed by Rework Cost at 103.0%, while Callback / Rework Rate sits at the bottom at 88.7%, just below Technician Utilization at 92.8%.
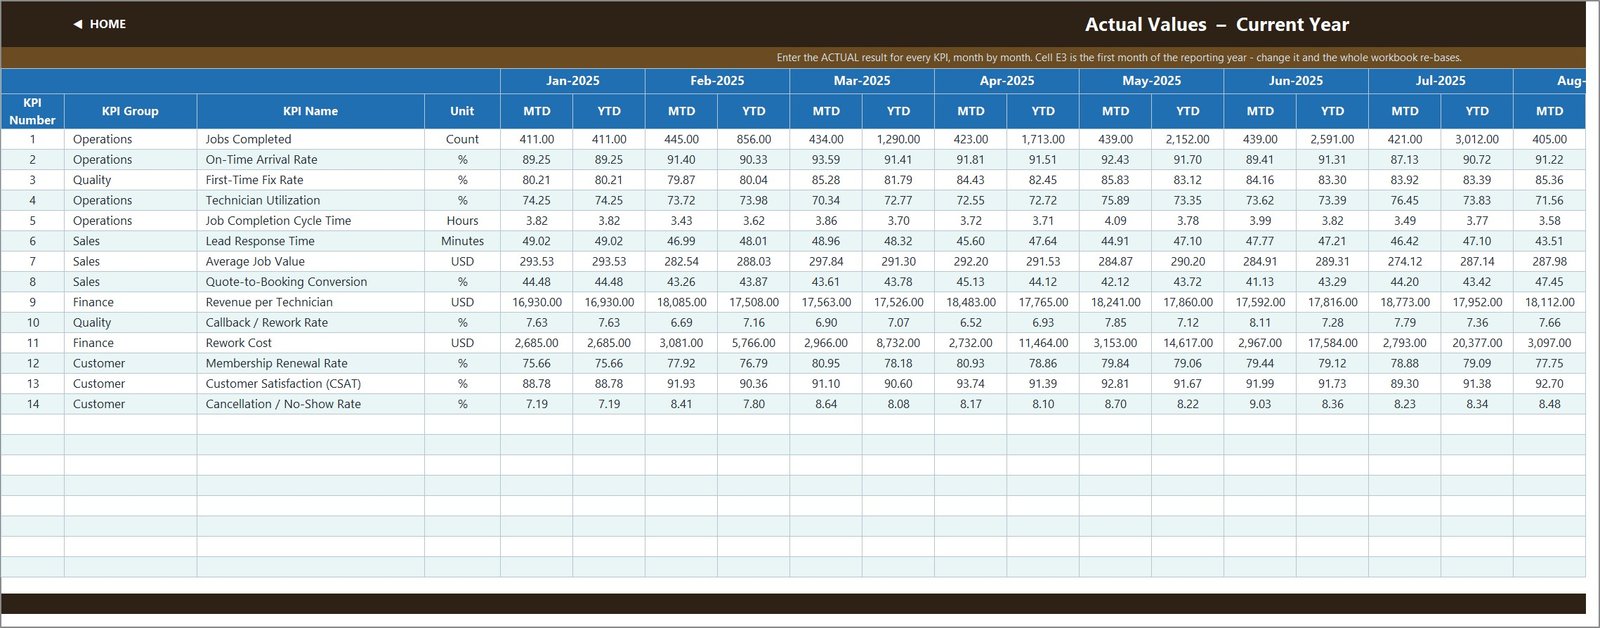
KPI Input – Actual
Enter the actual MTD and YTD result for every KPI, month by month. Cell E3 is the first month of the reporting year. Change it and the month headers, the dropdown and every sheet title re-base, which suits a business whose fiscal year does not start in January.
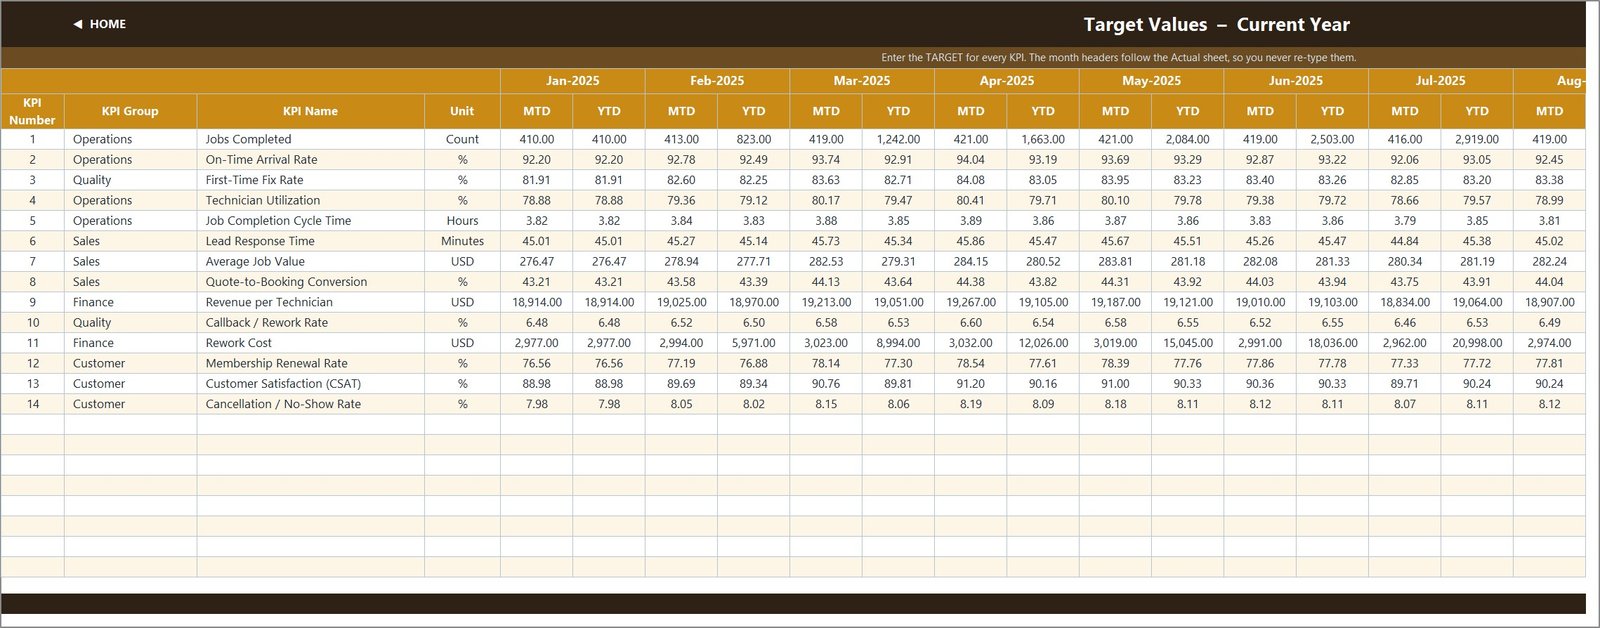
KPI Input – Target
The same grid for targets. Its month headers follow the Actual sheet, so you never retype them.
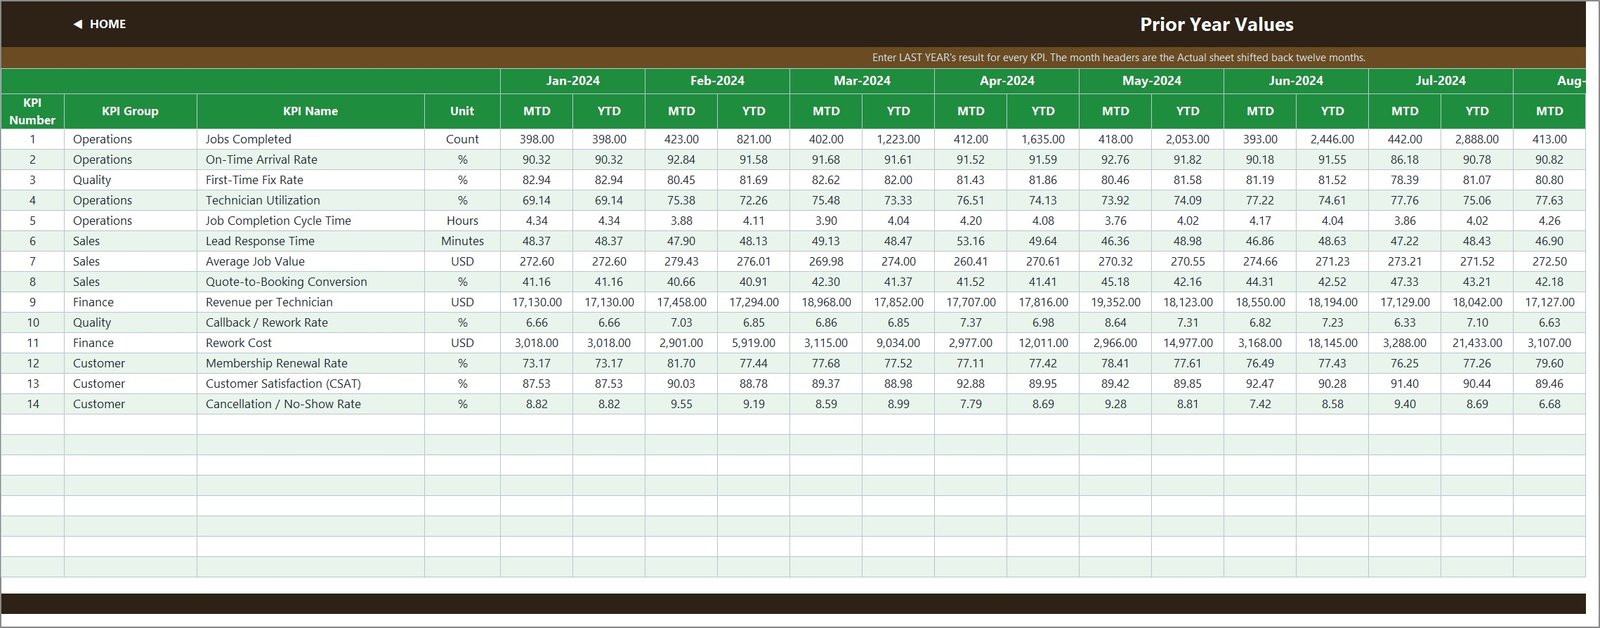
KPI Input – PY
Last year’s results. The headers are the Actual sheet’s months shifted back twelve months, which feeds the Prior Yr and vs PY columns.
KPI Definition
The master list with number, group, name, unit, formula, definition, UTB/LTB type, owner, priority and frequency. For example, First-Time Fix Rate is defined as jobs resolved on the first visit divided by total jobs, and Membership Renewal Rate as home-care members who renewed divided by members due to renew.

Read Me and Get More Templates
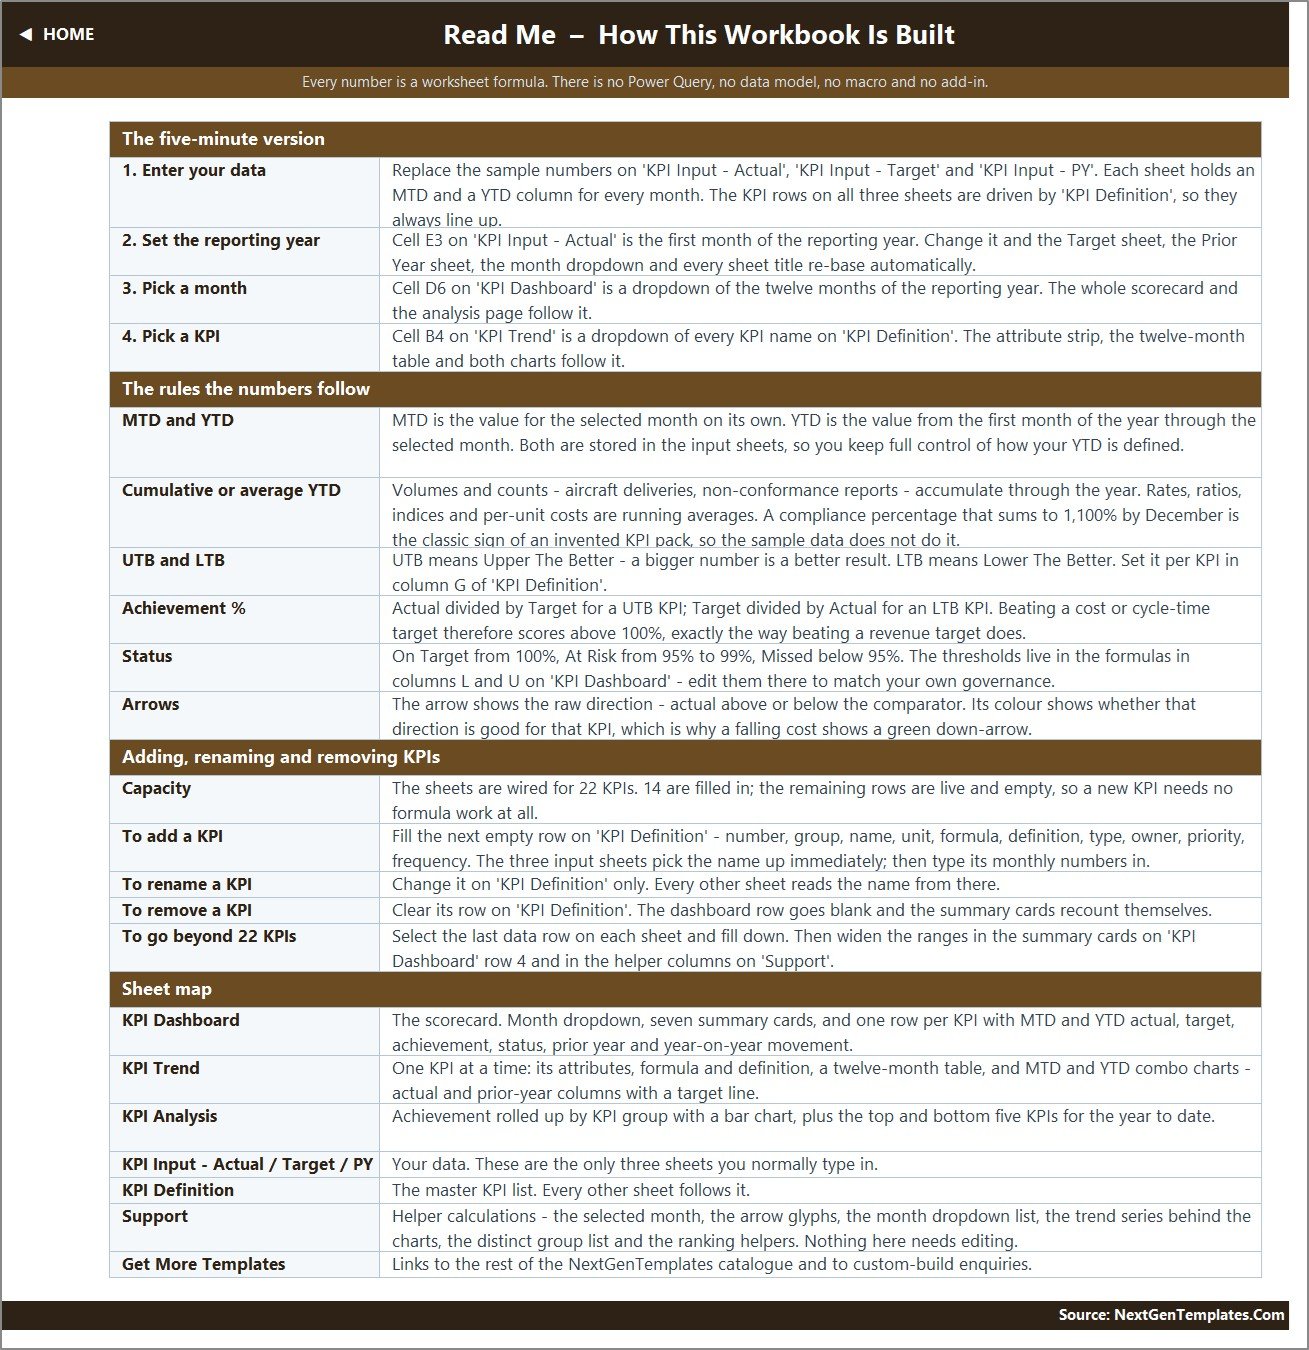
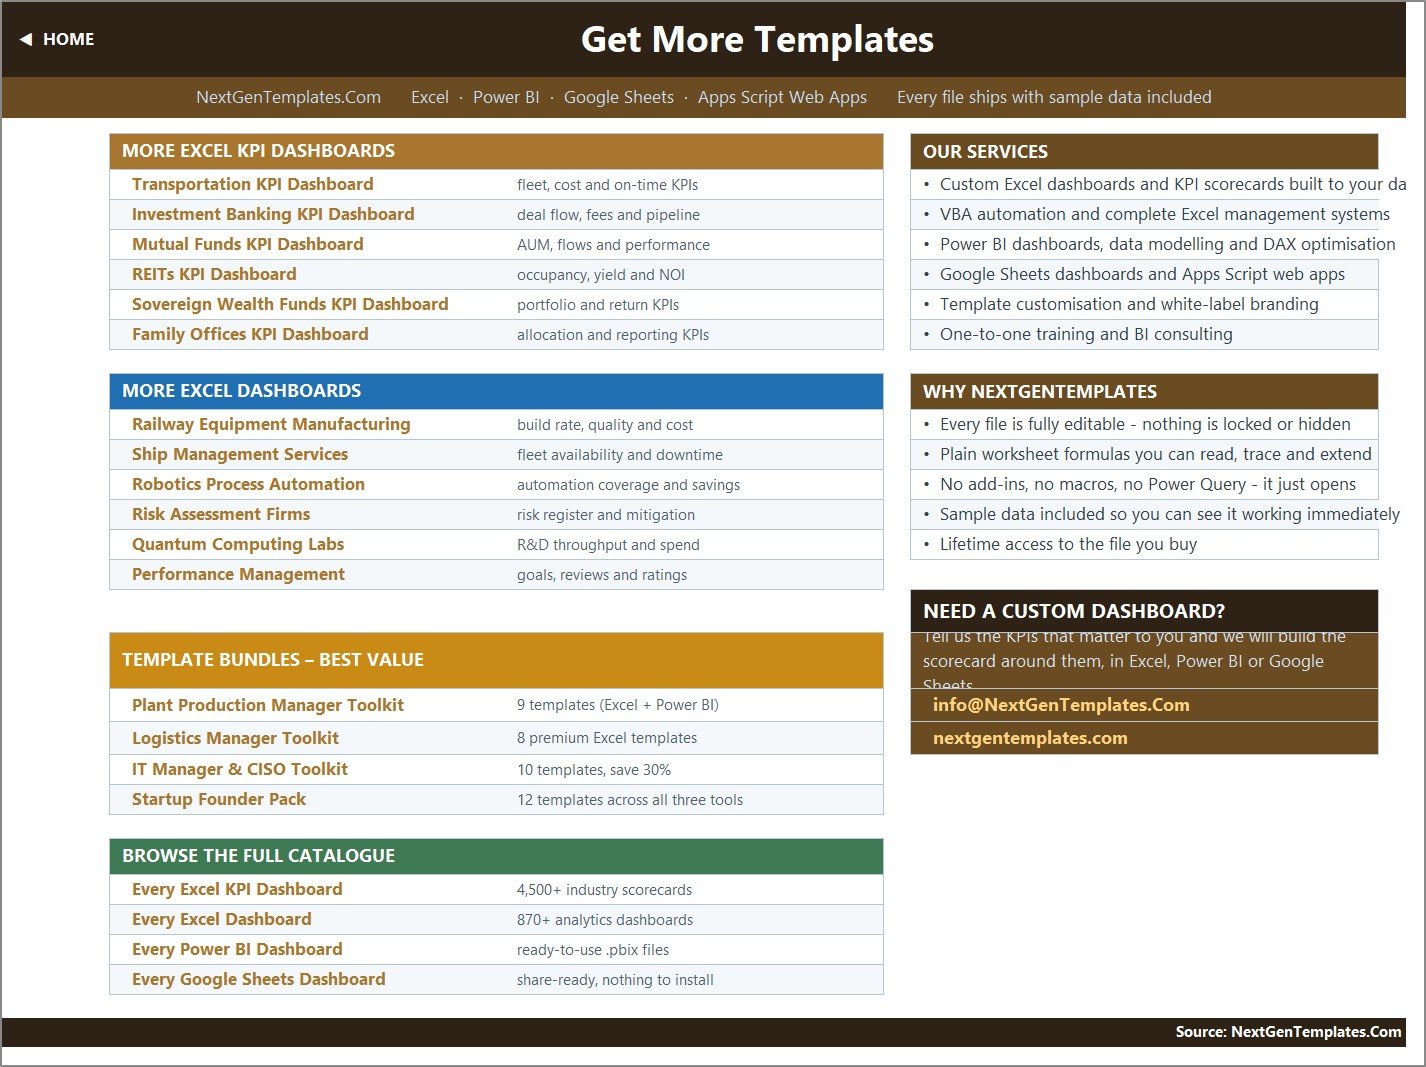
Read Me covers the five-minute setup, the MTD/YTD rules, UTB and LTB, achievement, status, arrows, and how to add, rename or remove KPIs. Get More Templates links to other NGT products.
Handyman KPI Template in Excel vs. Google Sheets Equivalent vs. Paid Field Service Software: Feature Comparison
| Feature | This Excel KPI Dashboard | Google Sheets KPI template | Paid handyman / field service software |
|---|---|---|---|
| Cost | One-time purchase | One-time template price | Recurring subscription, usually per user or per technician |
| Platform | Excel 2013+, Excel for the web | Google Sheets | Vendor web and mobile app |
| Setup time | Type monthly figures on three sheets | Similar | Onboarding, customer and job import |
| Real-time team collaboration | Co-authoring via OneDrive or SharePoint | Native | Native |
| Mobile access | Excel mobile app | Google Sheets app | Vendor app |
| Customisable KPIs | Up to 22, no formula edits | Depends on template | Limited to vendor reports |
| MTD / YTD traffic lights with UTB and LTB | Built in | Depends on template | Varies |
| Booking, dispatch, quoting, invoicing | No | No | Yes |
| Year-1 cost at 5 users | No per-user fee | No per-user fee | Five subscription seats |
For handyman companies that want a disciplined monthly KPI review without another subscription, this workbook sits in the sweet spot.
Who Should Use This Template
Perfect for:
- Owners and general managers of residential or light-commercial handyman and home repair companies
- Dispatch managers reporting jobs completed, on-time arrival, technician utilization and cancellations
- Field operations leads following first-time fix rate, callbacks and rework cost
- Sales coordinators and customer success leads tracking lead response time, quote-to-booking conversion, membership renewals and CSAT
Not a fit if:
- You need job booking, technician dispatch, quoting, parts inventory or invoicing
- You need a contractor licence, insurance, warranty or building-code compliance record
- You want numbers pulled from field service or accounting software automatically rather than typed monthly
Real-World Use Cases
An owner of a local handyman company fills in the three input sheets at month end. Lead Response Time, Quote-to-Booking Conversion and Average Job Value then show whether enquiries are answered quickly and converted into booked visits.
A dispatch manager selects On-Time Arrival Rate on the KPI Trend page to see the twelve-month MTD and YTD pattern against target, then checks Technician Utilization and Cancellation / No-Show Rate to judge whether a slow month was travel time, overbooking or customers missing appointments.
A field operations lead compares First-Time Fix Rate, Callback / Rework Rate and Rework Cost with the prior year, then takes the Bottom 5 table into the monthly technician review. In the sample those are Callback / Rework Rate, Technician Utilization, Revenue per Technician, Lead Response Time and Cancellation / No-Show Rate.
Advantages of the Handyman Services KPI Workbook
- One review, one file. Operations, quality, sales, finance and customer KPIs share the same month, the same thresholds and the same layout.
- Fair scoring for time, callback and cost KPIs. Lower-the-better KPIs are inverted automatically, so a month with faster jobs and fewer callbacks looks like a good month.
- Prior-year context everywhere. Every KPI carries last year’s value and a vs PY percentage, for both MTD and YTD.
- Easy to audit. Plain formulas you can trace, with no hidden model, query or macro.
- One-time cost. No subscription and no per-user fee.
Opportunities for Improvement
- Leftover example in the Read Me. The Cumulative or average YTD note uses “aircraft deliveries, non-conformance reports” as examples, carried over from another industry’s template. Edit that cell to handyman examples such as jobs completed.
- Manual data entry. MTD and YTD values are typed on the input sheets, and nothing connects to booking, quoting or accounting software.
- YTD is not derived. You store YTD yourself, which gives control over sums versus averages but means both columns need filling.
- Single-level view. KPIs are company-wide, with no per-technician, per-branch or per-job breakdown.
- Two dropdowns, not slicers. The feature graphic’s “Smart Filters” and “Interactive Reports” badges describe the month dropdown on the KPI Dashboard and the KPI dropdown on KPI Trend. There are no slicers or pivot filters.
Best Practices
- Agree each KPI’s formula and owner on KPI Definition before entering data, so the monthly numbers mean the same thing every time.
- Set cell E3 to the first month of your fiscal year so the dropdown and the YTD columns follow your year rather than the calendar year.
- Decide per KPI whether YTD is a running sum (Jobs Completed, Rework Cost) or a running average (rates, cycle times and revenue per technician), and keep it consistent.
- Set realistic targets. With a 95% At Risk floor, stretch targets turn much of the board amber.
- Enter prior-year data for all twelve months so the vs PY arrows stay meaningful.
- Learn how the month list is built with Microsoft’s guide to the EDATE function and to creating a drop-down list.
Explore Relevant Templates
- Home Renovation Contractor KPI Dashboard in Excel: the same KPI dashboard layout for renovation projects.
- Painting Contractor KPI Dashboard in Excel: crew, quality and sales KPIs for painters.
- Plumbing Business KPI Dashboard in Excel: call-out and fix-rate KPIs for a service trade.
- Job Work Order Data Entry System in Excel: log the work orders behind your monthly job counts.
More from this blog: the Home Renovation Contractor KPI Dashboard in Excel, the Painting Contractor KPI Dashboard in Excel, the HVAC Contractor KPI Dashboard in Excel, the Garage Door Service KPI Dashboard in Excel, and the Kitchen Remodeling KPI Dashboard in Excel.
Frequently Asked Questions
What KPIs are in the Handyman Services KPI Dashboard in Excel?
It ships with 14 KPIs in five groups: Operations (4), Sales (3), Customer (3), Quality (2) and Finance (2). They include First-Time Fix Rate, On-Time Arrival Rate, Quote-to-Booking Conversion, Revenue per Technician, Membership Renewal Rate and Cancellation / No-Show Rate. You can edit them or add more, up to 22.
How do I track handyman KPIs in Excel with this template?
Type monthly MTD and YTD actuals, targets and prior-year values on the three input sheets, then pick a month in cell D6 on the KPI Dashboard. The scorecard, traffic lights, summary cards and group analysis all recalculate from that one choice.
Does it need macros or Power Query?
No. It is a plain .xlsx built from worksheet formulas such as VLOOKUP, INDEX, MATCH and COUNTIF. There are no macros, Power Query, Power Pivot or add-ins, and it opens in Excel 2013 and later and in Excel for the web.
Can the reporting year start in a month other than January?
Yes. Cell E3 on KPI Input – Actual is the first month of the reporting year. Set it to your fiscal-year start and the Target sheet, the Prior Year sheet, the month dropdown and every sheet title re-base automatically.
Is this a booking, dispatch or compliance tool?
No. The workbook scores the monthly figures you enter. It does not book visits, dispatch technicians, raise quotes or invoices, and it is not a contractor licence, insurance, warranty or building-code record.
How does it compare with paid field service software?
Field service platforms run booking, dispatch, quoting and invoicing on a subscription. This Excel KPI Dashboard template does one job, the monthly KPI review with targets, prior year and traffic lights, for a one-time price with no per-user fees.
About the Author
Built by PK, a Microsoft Certified Professional with 15+ years of Excel, Google Sheets and Power BI experience and the founder of NextGenTemplates, whose YouTube channels reach 300K+ subscribers. Every template is hand-built and tested before release.
Conclusion
The Handyman Services KPI Dashboard in Excel gives a handyman company one monthly view of jobs completed, on-time arrival, first-time fix rate, technician utilization, cycle time, lead response, job value, quote conversion, revenue per technician, callbacks, rework cost, membership renewals, customer satisfaction and no-shows. MTD, YTD and prior-year comparisons, plus trend and group analysis, all run from a single month dropdown. It is honest about its limits: data is typed in, KPIs are company-wide, and it is not a booking system or a compliance record.
Click here to Purchase the Handyman Services KPI Dashboard in Excel
Instant download · One-time payment · No subscription
Last updated: September 2026
Watch step-by-step tutorials on Youtube.com/@PKAnExcelExpert