New: NextGenTemplates Academy - video courses on Excel formulas with AI and Pivot Tables & dashboards. Early-bird: 20% off with code EARLYBIRD20 - first 20 orders only. See the courses →
  • Learn Excel (Free Course)
    • 1. Shortcut Keys
    • 2. Fill & Flash Fill
    • 3. Find & Replace
    • 4. Sort & Filter
    • 5. Formulas & Functions
    • 6. Data Validation
    • 7. Conditional Formatting
    • 8. Basic Charts
    • 9. Advanced Charts
    • 10. Pivot Tables
    • 11. Excel Dashboards
    • 12. VBA Course
    • 13. Excel Formulas with AI
  • Templates
  • Tutorials
    • Charts and Visualization
    • VBA
    • Excel Tips and Tricks
    • Excel Dashboards
    • Power Pivot & DAX
  • Power BI
  • Template Store
    • Ready to Use Templates
  • Courses
  • Academy
    • Excel + AI Mastery: 100 Formulas
    • Excel Pivot Tables & Dashboards
  • About Us
  • Contact Us

PK: An Excel Expert

Transforming Data into Decisions

Tag: performance dashboard

Templates

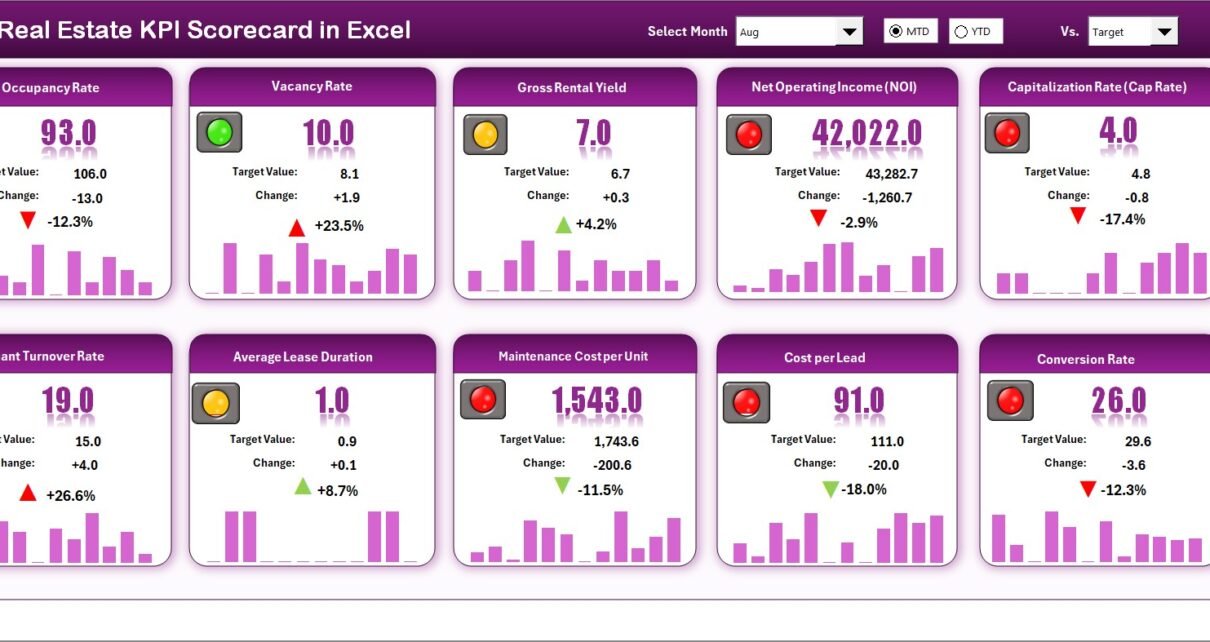
Real Estate KPI Scorecard in Excel

October 8, 2025October 8, 2025 PKComments Off on Real Estate KPI Scorecard in Excel
Managing a real estate business involves multiple dimensions — from sales and occupancy rates to rental yields and marketing performance. Without a clear performance tracking system, it becomes difficult to
Read More
Dashboard

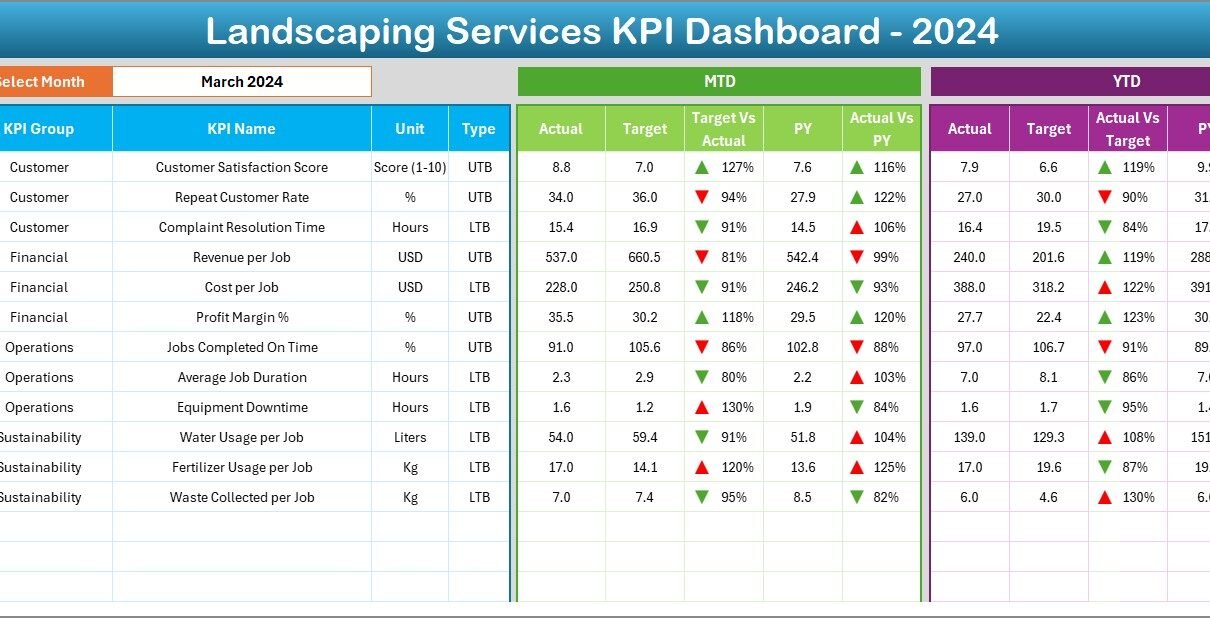
Landscaping Services KPI Dashboard in Excel

October 4, 2025October 4, 2025 PKComments Off on Landscaping Services KPI Dashboard in Excel
Managing landscaping services requires precision, organization, and data-driven decision-making. Whether you run a small local landscaping business or manage a large facility’s maintenance division, understanding how well your operations perform
Read More
Dashboard Power BI

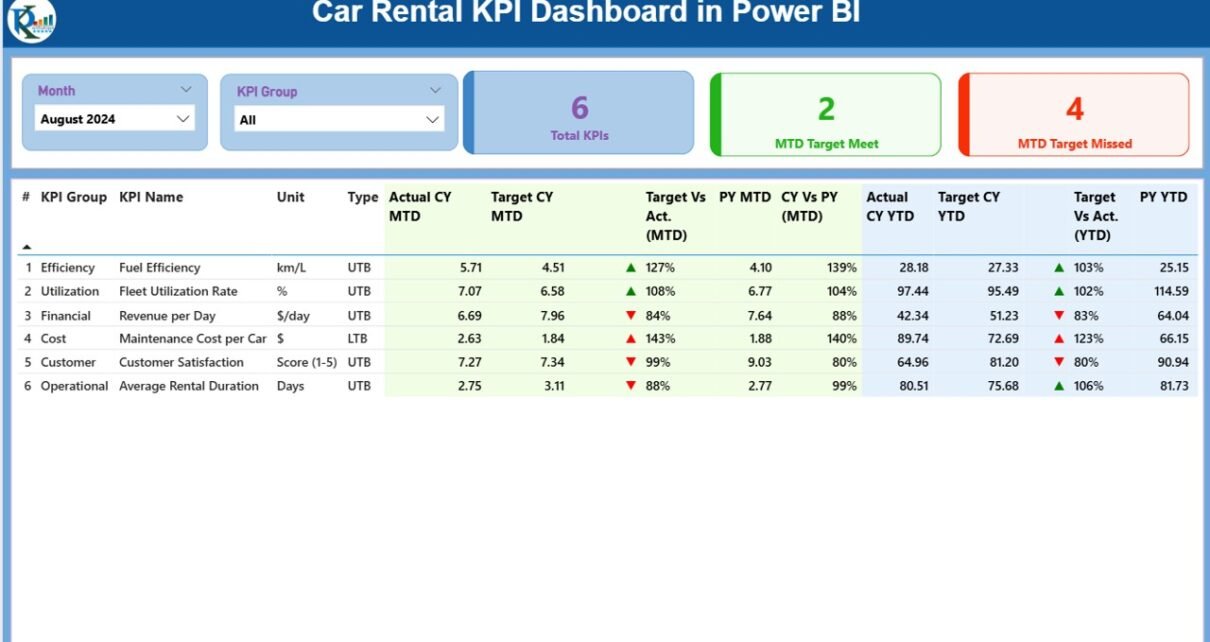
Car Rental KPI Dashboard in Power BI

October 2, 2025October 10, 2026 PKComments Off on Car Rental KPI Dashboard in Power BI
The car rental industry is becoming more competitive every year. With rising customer expectations, fluctuating fuel costs, and an increasing demand for digital experiences, companies need a reliable way to
Read More
Dashboard

Innovation & Transformation KPI Dashboard in Excel

September 27, 2025September 27, 2025 PKComments Off on Innovation & Transformation KPI Dashboard in Excel
Innovation and transformation drive modern business success. Innovation & Transformation KPI Dashboard in ExcelCompanies that monitor progress with the right metrics grow faster, adapt to change, and stay competitive. However,
Read More
Dashboard

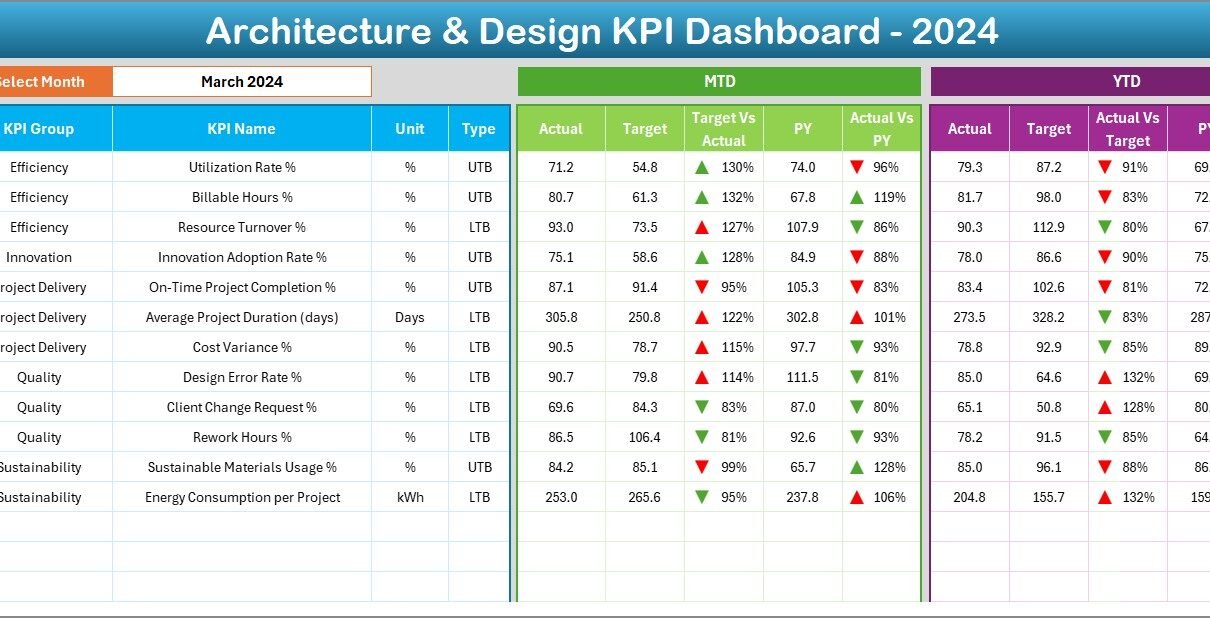
Architecture and Design KPI Dashboard in Excel

September 19, 2025September 19, 2025 PKComments Off on Architecture and Design KPI Dashboard in Excel
Architecture and design projects require a delicate balance of creativity, functionality, and efficiency. Whether you are managing a small architectural studio or a large design firm, tracking key performance indicators
Read More
Dashboard

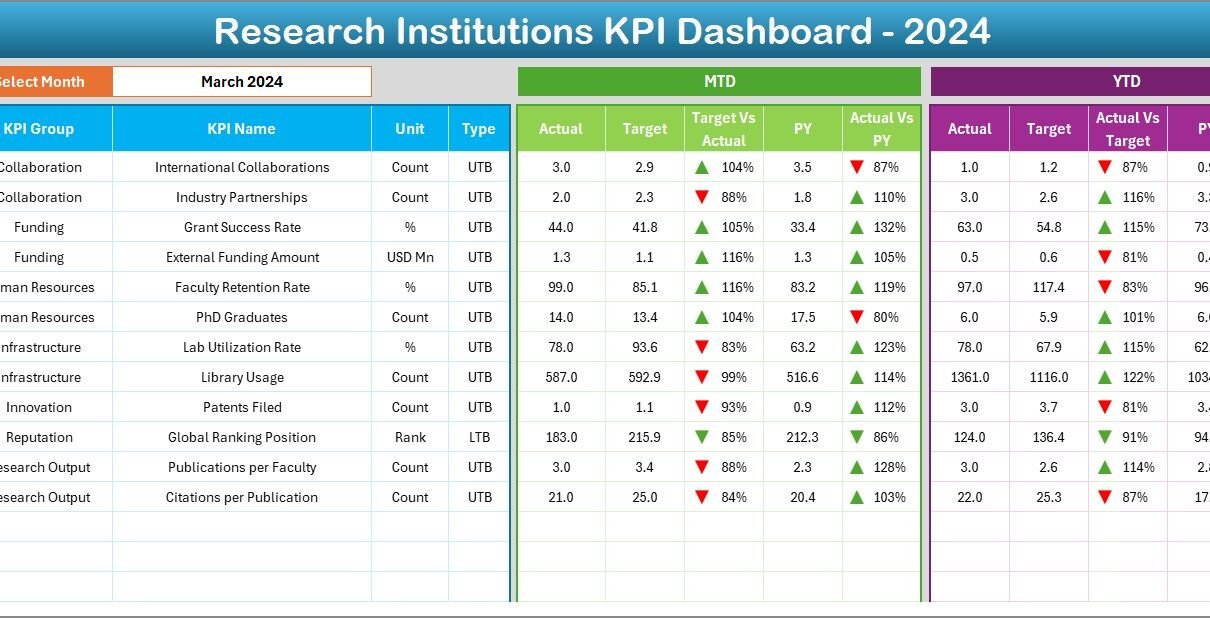
Research Institutions KPI Dashboard in Excel

September 18, 2025September 18, 2025 PKComments Off on Research Institutions KPI Dashboard in Excel
Research institutions thrive on innovation, discovery, and collaboration. Yet, without proper performance measurement, even the most promising projects can lose direction. Monitoring the right Key Performance Indicators (KPIs) ensures that
Read More
Dashboard Power BI

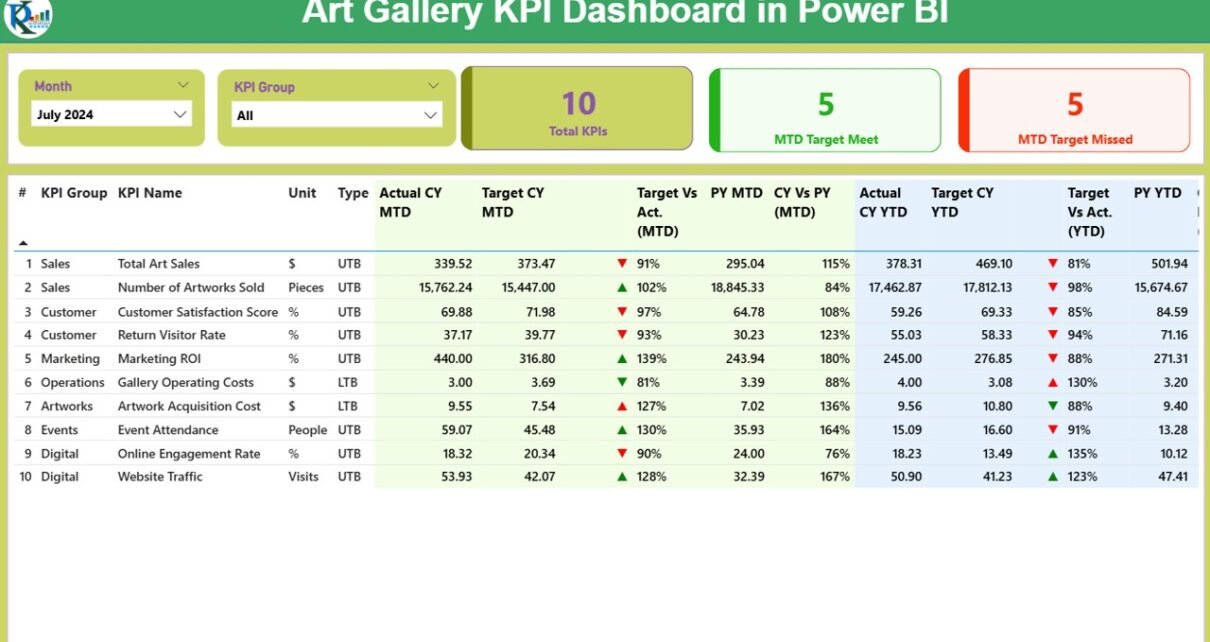
Art Gallery KPI Dashboard in Power BI

July 27, 2025July 27, 2025 PKComments Off on Art Gallery KPI Dashboard in Power BI
Running an art gallery is more than curating beautiful pieces—it’s about managing operations, improving visitor engagement, tracking financial performance, and ensuring sustainability. With growing pressure to balance creativity with data-driven
Read More
Dashboard

Corporate Event Planning Dashboard in Excel

June 18, 2025June 18, 2025 PKComments Off on Corporate Event Planning Dashboard in Excel
Corporate event planning is a complex process, requiring organization, communication, and attention to detail. Whether you're planning a small team-building event or a large conference, having a well-organized system to
Read More
Dashboard

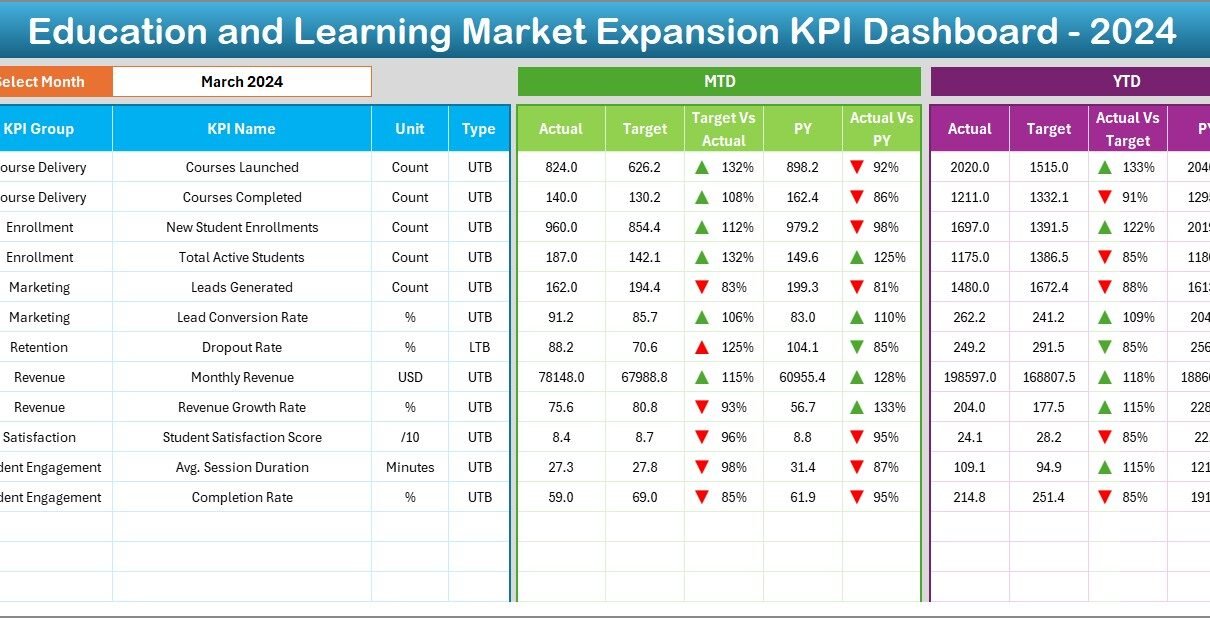
Education and Learning Market Expansion KPI Dashboard in Excel

June 7, 2025June 7, 2025 PKComments Off on Education and Learning Market Expansion KPI Dashboard in Excel
In the evolving world of education, institutions and training organizations must track performance, growth, and expansion metrics effectively. One powerful way to do this is through a KPI Dashboard built
Read More
Dashboard

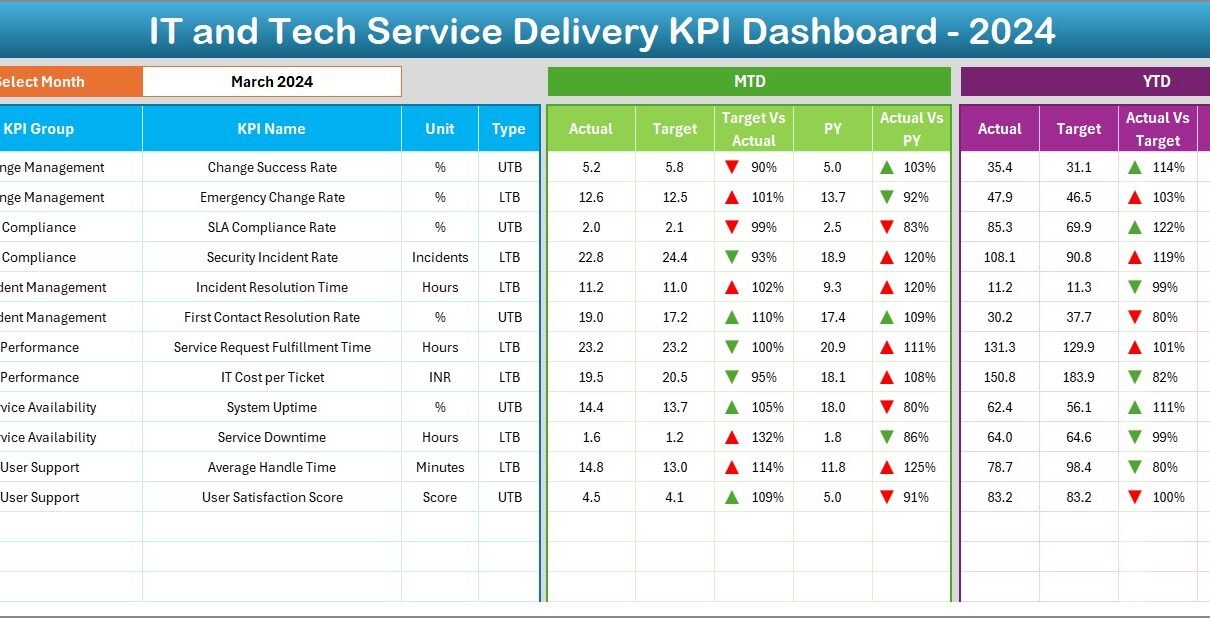
IT and Tech Service Delivery KPI Dashboard in Excel

May 23, 2025May 23, 2025 PKComments Off on IT and Tech Service Delivery KPI Dashboard in Excel
Managing service delivery in the IT and tech industry requires more than just good intentions; it demands data-driven decision-making. One of the best tools to achieve this is an IT
Read More

Posts pagination

Previous 1 … 6 7 8 9 Next
  • Learn Excel (Free Course)
    • 1. Shortcut Keys
    • 2. Fill & Flash Fill
    • 3. Find & Replace
    • 4. Sort & Filter
    • 5. Formulas & Functions
    • 6. Data Validation
    • 7. Conditional Formatting
    • 8. Basic Charts
    • 9. Advanced Charts
    • 10. Pivot Tables
    • 11. Excel Dashboards
    • 12. VBA Course
    • 13. Excel Formulas with AI
  • Templates
  • Tutorials
    • Charts and Visualization
    • VBA
    • Excel Tips and Tricks
    • Excel Dashboards
    • Power Pivot & DAX
  • Power BI
  • Template Store
    • Ready to Use Templates
  • Courses
  • Academy
    • Excel + AI Mastery: 100 Formulas
    • Excel Pivot Tables & Dashboards
  • About Us
  • Contact Us
Copyright © 2023 PK-AnExcelExpert.com - Privacy Policy