Managing landscaping services requires precision, organization, and data-driven decision-making. Whether you run a small local landscaping business or manage a large facility’s maintenance division, understanding how well your operations perform is critical. That’s where a Landscaping Services KPI Dashboard in Excel becomes a powerful ally.
This ready-to-use Excel dashboard helps managers, supervisors, and business owners visualize performance across multiple dimensions — from project efficiency and labor utilization to customer satisfaction and cost control. Instead of spending hours compiling data manually, you can now get instant insights in a clean, automated, and visual format.
In this article, we’ll explore everything you need to know about this Excel-based dashboard — from its structure and features to best practices, benefits, and real-world use cases.
Click to Purchases Landscaping Services KPI Dashboard in Excel
🌱 What Is a Landscaping Services KPI Dashboard in Excel?
A Landscaping Services KPI Dashboard in Excel is a performance-tracking tool designed to monitor and evaluate key performance indicators (KPIs) for landscaping operations. It consolidates multiple data points into one interactive dashboard, enabling better control over daily, monthly, and yearly performance.
The dashboard provides visibility into operational metrics such as:
-
Project completion rates
-
Maintenance costs
-
Equipment utilization
-
Labor productivity
-
Client satisfaction levels
-
Revenue vs. target performance
By using this Excel-based system, landscaping companies can move from reactive problem-solving to proactive performance management.
🧭 Structure of the Landscaping Services KPI Dashboard
This dashboard is built with seven well-organized worksheets, each serving a specific function to make tracking and analysis effortless.
1️⃣ Home Sheet – The Central Navigation Hub
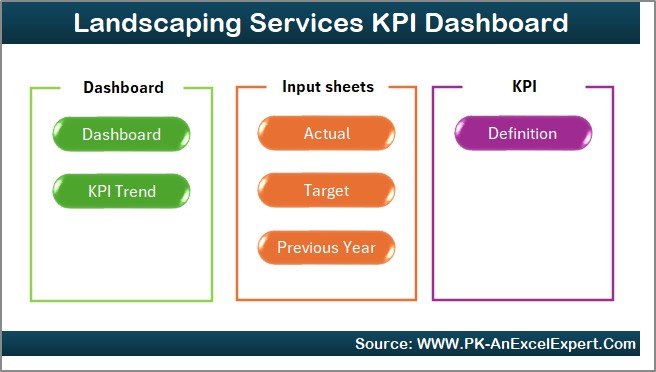
The Home sheet acts as the dashboard’s main index.
It includes six clickable buttons that instantly take you to the other key sheets like Dashboard, Trend, Target, or KPI Definition.
This sheet improves user experience by eliminating the need to search through tabs manually.
Key highlights:
-
Clear navigation buttons
-
Overview of dashboard purpose
-
Professional layout with quick-access links
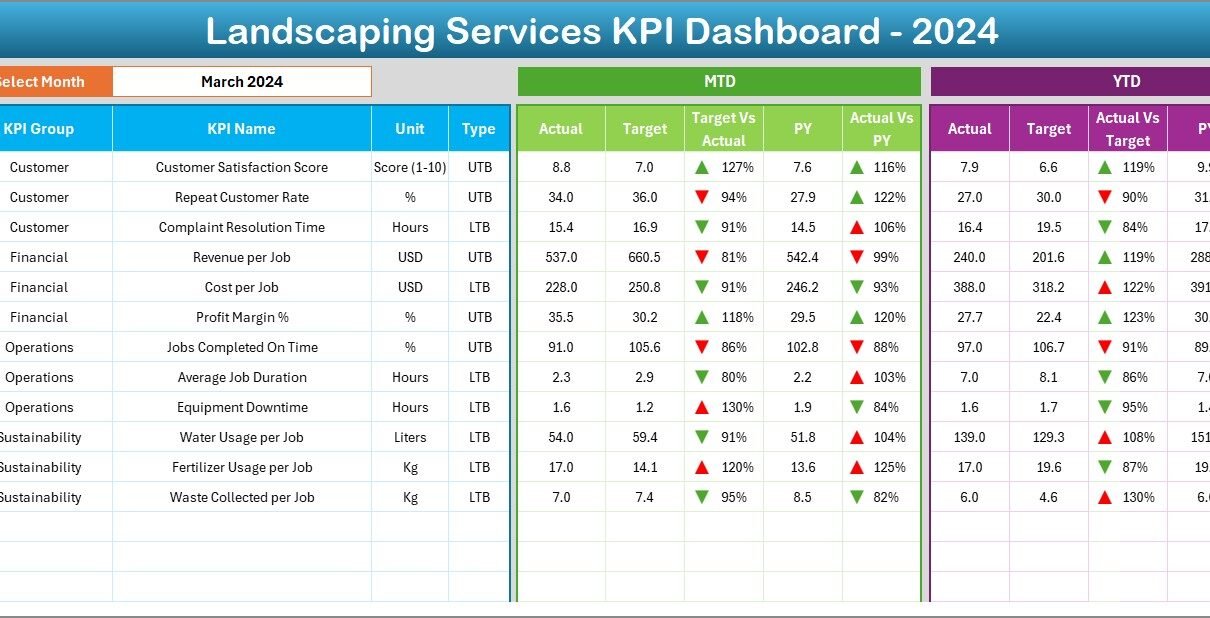
2️⃣ Dashboard Sheet – The Main Visualization Page
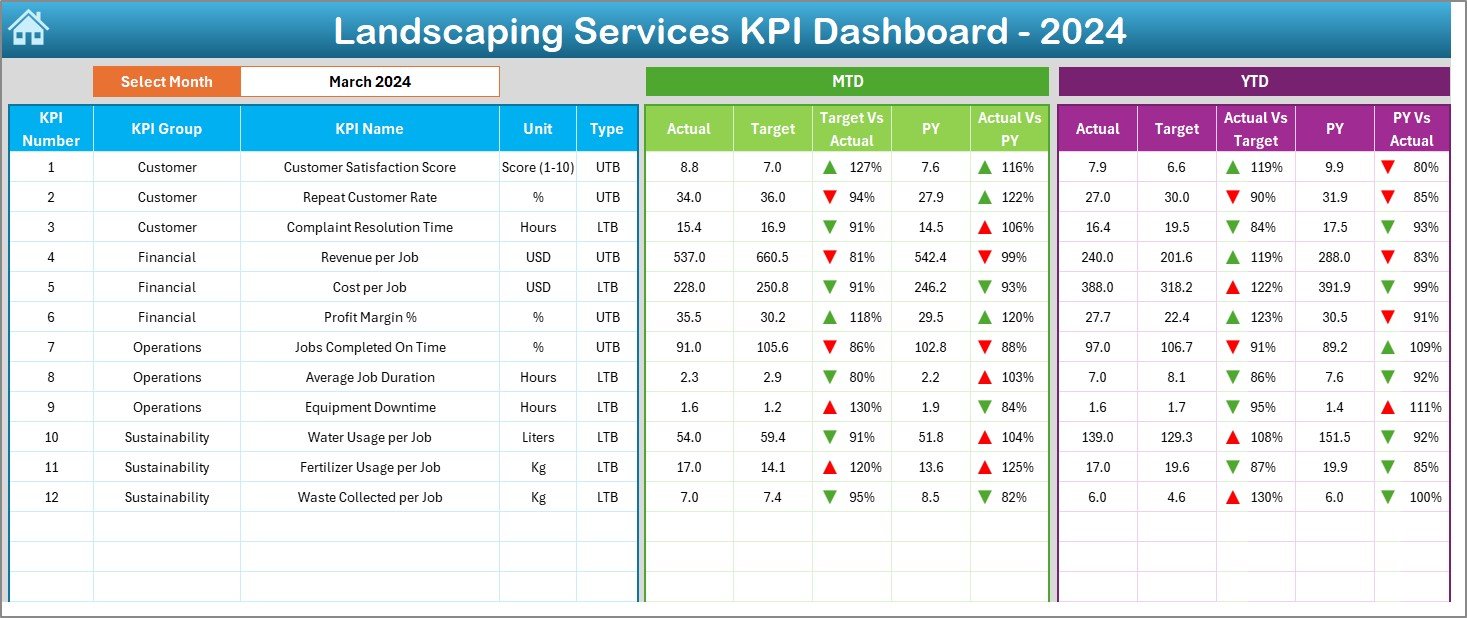
This is the heart of the KPI system.
It shows a consolidated view of performance across all metrics.
At the top, you can choose the desired month from a dropdown (located in cell D3), and the entire dashboard updates automatically.
Displayed information includes:
-
MTD (Month-to-Date) Actual, Target, and Previous Year performance
-
YTD (Year-to-Date) Actual, Target, and Previous Year data
-
Variance indicators (Target vs. Actual and PY vs. Actual)
-
Conditional formatting arrows (green for improvement, red for decline)
With a single click, managers can monitor trends and deviations without building complex pivot charts every month.
3️⃣ KPI Trend Sheet – Visualize Month-wise Progress
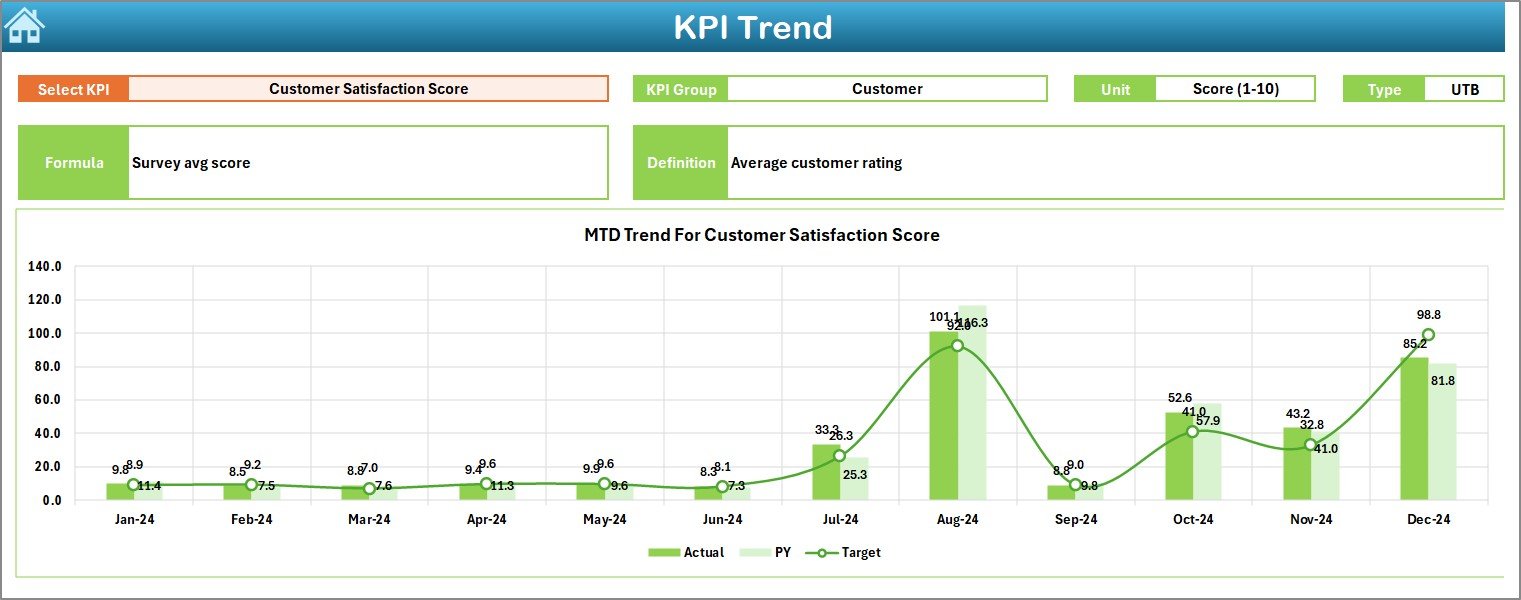
The KPI Trend sheet provides a detailed look at each KPI’s performance over time.
By selecting a KPI name from a dropdown (cell C3), the sheet dynamically displays:
-
KPI Group
-
Unit of Measurement
-
KPI Type (Lower the Better or Upper the Better)
-
Formula and Definition
-
Trend charts for MTD and YTD performance
This feature allows decision-makers to identify seasonal variations, recurring issues, or consistent growth patterns.
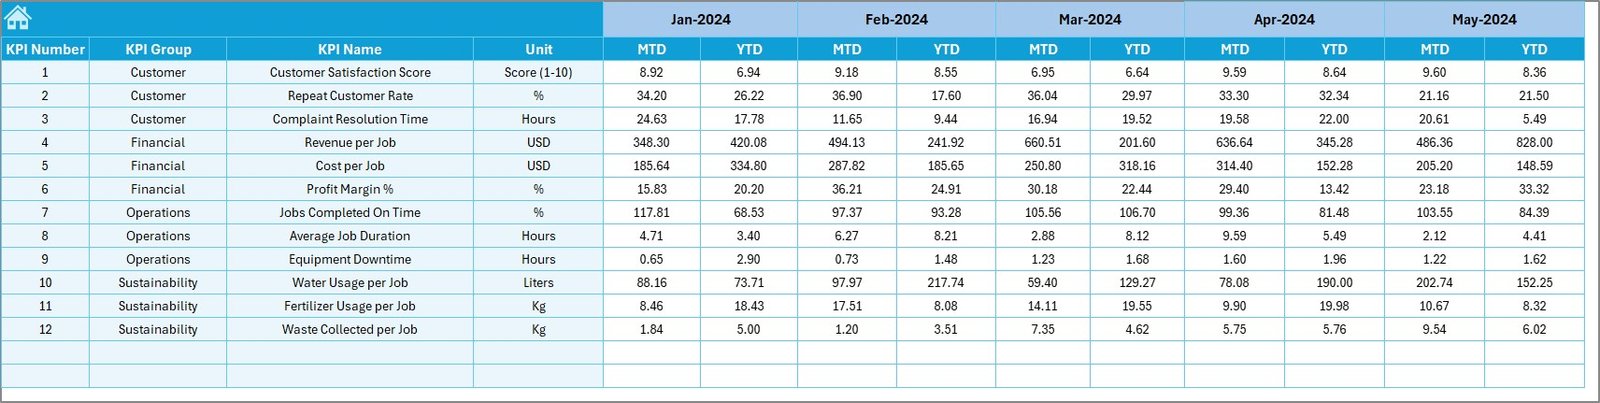
4️⃣ Actual Numbers Input Sheet – Real-Time Data Entry
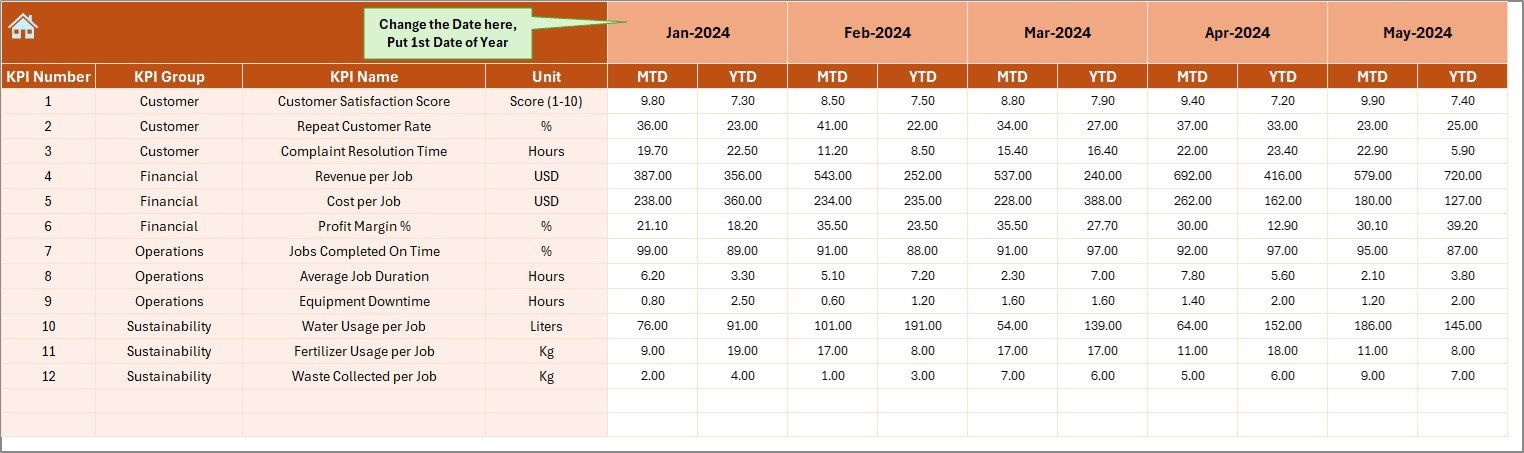
This sheet serves as the data input center for all actual performance values.
Users can enter MTD and YTD figures for each KPI.
The month can be changed from cell E1 (for example, entering “January” or “April”), and all calculations will adjust automatically.
Benefits:
-
Eliminates repetitive manual data updates
-
Maintains data accuracy
-
Enables easy monthly tracking
5️⃣ Target Sheet – Setting Performance Goals
Targets drive performance.
In this sheet, users define both MTD and YTD targets for each KPI.
Managers can align goals based on project plans, contracts, or past performance benchmarks.
Why this matters:
-
Ensures accountability across teams
-
Supports strategic planning
-
Helps compare actual vs. expected results quickly
6️⃣ Previous Year Numbers Sheet – Historical Comparison
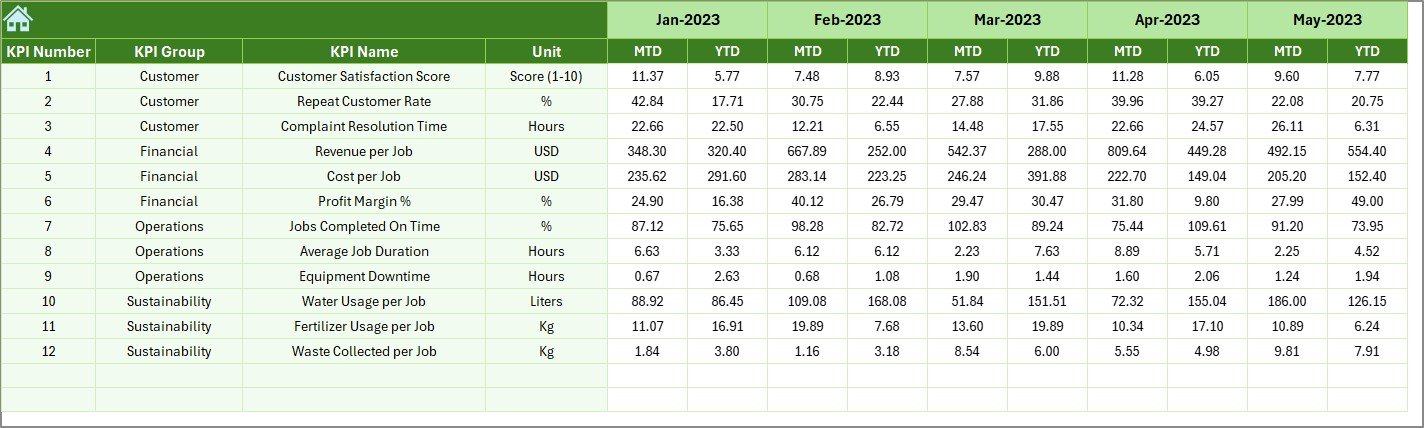
This sheet stores all previous year’s actual data, mirroring the format of current year input.
Having this data enables year-on-year (YoY) analysis, making it easier to evaluate growth and operational improvements.
Uses:
-
Understand long-term performance trends
-
Highlight achievements over multiple years
-
Identify underperforming areas early
7️⃣ KPI Definition Sheet – The Knowledge Base
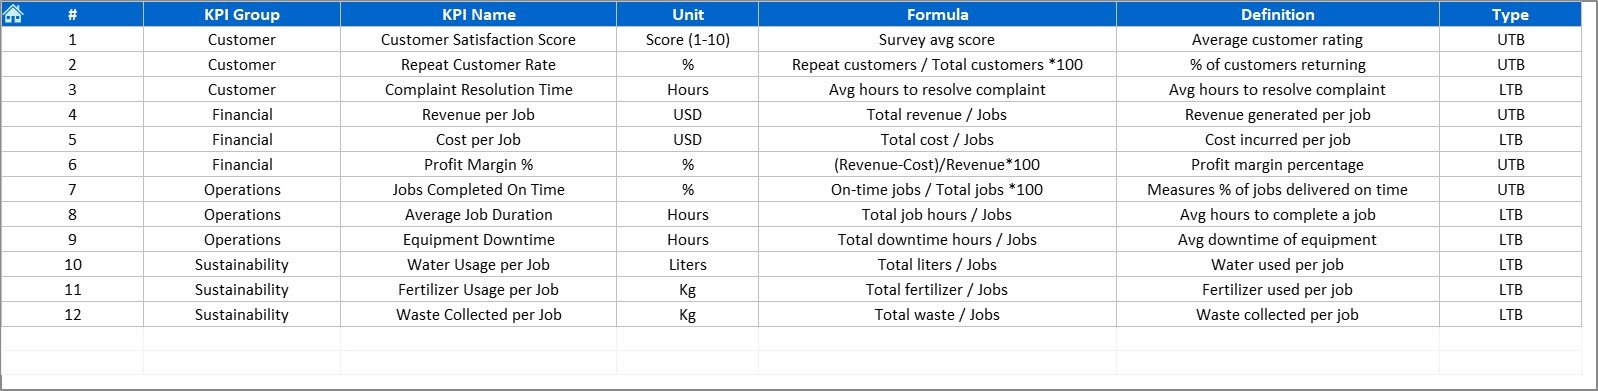
Every KPI in the system is clearly defined here.
Columns include:
-
KPI Name
-
KPI Group
-
Unit of Measurement
-
Formula
-
Definition
-
Type (LTB or UTB)
This ensures every stakeholder understands how KPIs are measured and why they matter, fostering consistency across departments.
🌾 Why Use a Landscaping Services KPI Dashboard?
Landscaping services involve multiple moving parts — equipment, people, locations, weather, and client demands. Without an integrated view, performance monitoring can quickly become chaotic.
Click to Purchases Landscaping Services KPI Dashboard in Excel
The Excel KPI Dashboard simplifies everything.
Here’s why it’s invaluable:
✅ 1. Brings All KPIs Together
No more scattered sheets or reports. All your key performance metrics appear in one unified view.
✅ 2. Improves Decision-Making
With real-time visual insights, managers can make informed decisions faster.
✅ 3. Saves Time and Effort
Automation in Excel formulas and conditional formatting reduces manual tracking time by over 50%.
✅ 4. Encourages Accountability
Departments or individuals can be tracked against defined targets, ensuring transparency and ownership.
✅ 5. Enhances Client Satisfaction
Consistent monitoring of quality, timeliness, and maintenance performance ensures clients always get the best service.
🌼 Key KPIs You Can Track in the Dashboard
Here are some sample KPIs that landscaping businesses often monitor using this Excel dashboard:
🌳 Project Completion Rate (%) – Tracks completed projects vs. total planned.
💧 Water Usage Efficiency (%) – Monitors irrigation system performance.
👨🌾 Labor Productivity (Hours/Project) – Evaluates workforce efficiency.
🌿 Maintenance Cost per Sq. Ft. – Measures cost-effectiveness.
🧰 Equipment Downtime (Hours) – Tracks machine reliability.
🕒 On-Time Service Delivery (%) – Checks scheduling and punctuality.
💬 Client Satisfaction (%) – Based on surveys or ratings.
🧾 Budget Variance (%) – Compares planned vs. actual expenses.
Each KPI can be customized to your unique business needs, making the dashboard flexible and scalable.
🌸 Advantages of Landscaping Services KPI Dashboard in Excel
Using this KPI dashboard offers numerous practical benefits for operational, financial, and customer-facing performance.
Click to Purchases Landscaping Services KPI Dashboard in Excel
🌟 1. Easy to Use and Maintain
No special software or coding knowledge required. Anyone familiar with Excel can use it.
🌟 2. Real-Time Data Insights
Instant updates when new data is entered — no waiting for reports.
🌟 3. Fully Customizable
You can add, modify, or remove KPIs as your business evolves.
🌟 4. Visual and Interactive
Charts, progress bars, and conditional arrows make interpretation effortless.
🌟 5. Cost-Effective
Unlike expensive BI tools, Excel provides powerful insights without subscription fees.
🌟 6. Improved Collaboration
Shareable through OneDrive, Google Drive, or internal networks — everyone stays aligned.
🌻 Opportunities for Improvement
Even though this dashboard is powerful, there are areas where you can enhance functionality further:
💡 Integrate Power Query for automatic data refresh from external files.
💡 Add VBA macros for automated report generation.
💡 Include forecast models using Excel’s trendline or exponential smoothing.
💡 Use slicers and filters for deeper interactive exploration.
💡 Combine with Power BI for cloud-based visualization and mobile access.
Continuous improvement keeps your analytics relevant and robust.
🌳 Best Practices for Using the Landscaping Services KPI Dashboard
To get the most from this Excel-based system, follow these best practices:
🧩 1. Standardize Data Entry
Ensure all data uses consistent formats (dates, units, and values) to prevent formula errors.
🧩 2. Review KPIs Regularly
Schedule monthly or quarterly performance reviews to analyze trends and take action.
🧩 3. Keep Definitions Clear
Update KPI definitions annually to ensure alignment with business goals.
🧩 4. Protect the Dashboard
Lock formulas and visuals to prevent accidental editing by other users.
🧩 5. Backup Data Frequently
Maintain backups of Actual, Target, and Historical sheets to avoid data loss.
🧩 6. Visualize Progress
Use conditional formatting to make key metrics stand out with color-coded cues.
🌿 How to Get Started
-
Download the Template: Use the pre-built Landscaping Services KPI Dashboard in Excel.
-
Customize the KPIs: Edit the KPI Definition sheet to include your business-specific metrics.
-
Enter Data: Input monthly actuals, targets, and previous year data.
-
Analyze Trends: Explore Dashboard and KPI Trend sheets to review progress.
-
Act on Insights: Adjust operational strategies based on what the data reveals.
Within minutes, you’ll have a fully functional system for managing landscaping performance efficiently.
🌺 Real-World Use Cases
Here are a few examples of how businesses apply this dashboard:
-
Facility Maintenance Firms: To track garden upkeep costs and service frequency.
-
Commercial Landscaping Companies: To compare profitability across contracts.
-
Municipal Departments: To monitor sustainability programs and green area maintenance.
-
Resort or Hotel Chains: To assess landscaping aesthetics and guest feedback metrics.
This versatility makes the dashboard a valuable asset for any organization involved in outdoor management.
🌼 Conclusion
The Landscaping Services KPI Dashboard in Excel is more than just a spreadsheet — it’s a strategic decision-making tool.
It brings together the essential performance indicators that drive landscaping success, combining accuracy, simplicity, and visual appeal.
By adopting this dashboard, landscaping managers and business owners can focus on what truly matters — delivering beautiful, efficient, and sustainable landscapes backed by measurable results.
Click to Purchases Landscaping Services KPI Dashboard in Excel
🌻 Frequently Asked Questions (FAQs)
1. Can beginners use the Landscaping Services KPI Dashboard easily?
Yes! The dashboard is designed with simplicity in mind. Anyone who knows basic Excel can use it without technical expertise.
2. Can I add my own KPIs?
Absolutely. You can easily edit the KPI Definition sheet and adjust formulas to fit your requirements.
3. How often should I update the data?
It’s best to update data monthly to keep MTD and YTD metrics current.
4. Can this dashboard work for multiple sites or locations?
Yes. You can add a “Location” column in your data sheets and create separate PivotTables for each site.
5. Is this dashboard compatible with Excel Online?
Yes, it works with both desktop and online versions of Excel, though some advanced VBA features may require desktop Excel.
6. What is the ideal number of KPIs to track?
Typically, 10–15 KPIs give a balanced view of landscaping operations without overwhelming users.
7. Can I connect this dashboard to Power BI later?
Yes. The structure is Power BI-ready, allowing seamless migration for advanced visualization.
Click to Purchases Landscaping Services KPI Dashboard in Excel
Visit our YouTube channel to learn step-by-step video tutorials