New: NextGenTemplates Academy - video courses on Excel formulas with AI and Pivot Tables & dashboards. Early-bird: 20% off with code EARLYBIRD20 - first 20 orders only. See the courses →
  • Learn Excel (Free Course)
    • 1. Shortcut Keys
    • 2. Fill & Flash Fill
    • 3. Find & Replace
    • 4. Sort & Filter
    • 5. Formulas & Functions
    • 6. Data Validation
    • 7. Conditional Formatting
    • 8. Basic Charts
    • 9. Advanced Charts
    • 10. Pivot Tables
    • 11. Excel Dashboards
    • 12. VBA Course
    • 13. Excel Formulas with AI
  • Templates
  • Tutorials
    • Charts and Visualization
    • VBA
    • Excel Tips and Tricks
    • Excel Dashboards
    • Power Pivot & DAX
  • Power BI
  • Template Store
    • Ready to Use Templates
  • Courses
  • Academy
    • Excel + AI Mastery: 100 Formulas
    • Excel Pivot Tables & Dashboards
  • About Us
  • Contact Us

PK: An Excel Expert

Transforming Data into Decisions

Tag: Restaurant Analytics

Dashboard Power BI Templates

Ghost Kitchens Dashboard in Power BI

October 16, 2026 PKComments Off on Ghost Kitchens Dashboard in Power BI
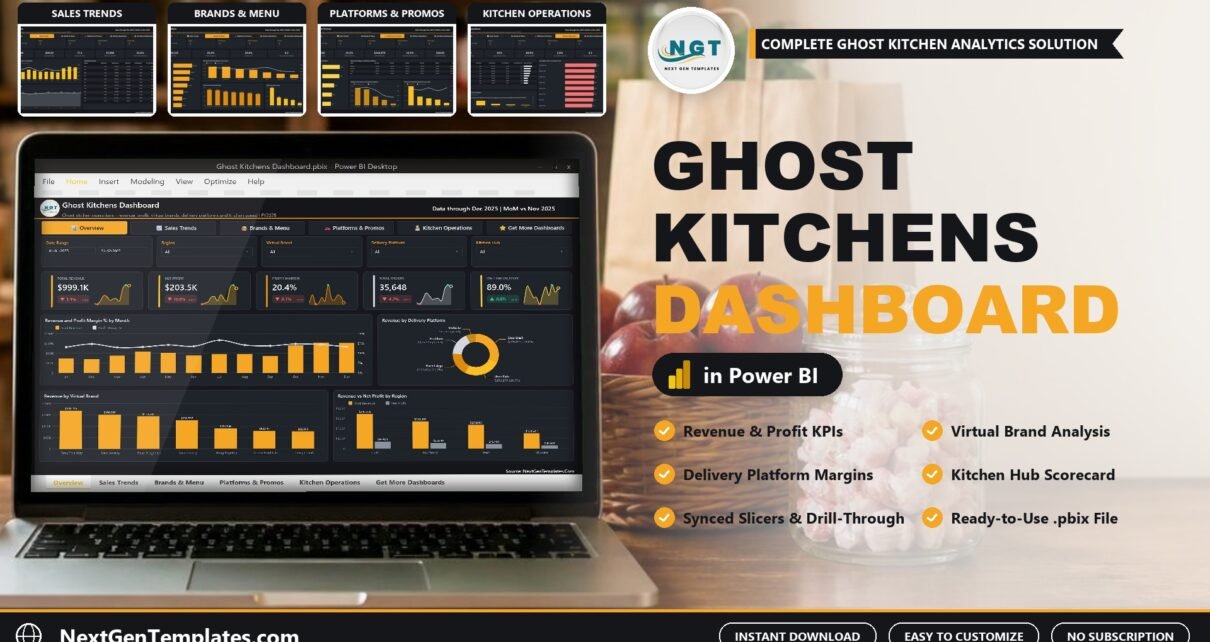
The Ghost Kitchens Dashboard in Power BI answers the question every delivery-only operator eventually asks: after the apps take their cut, which brands, platforms and kitchens actually make money? It
Read More
Power BI Templates

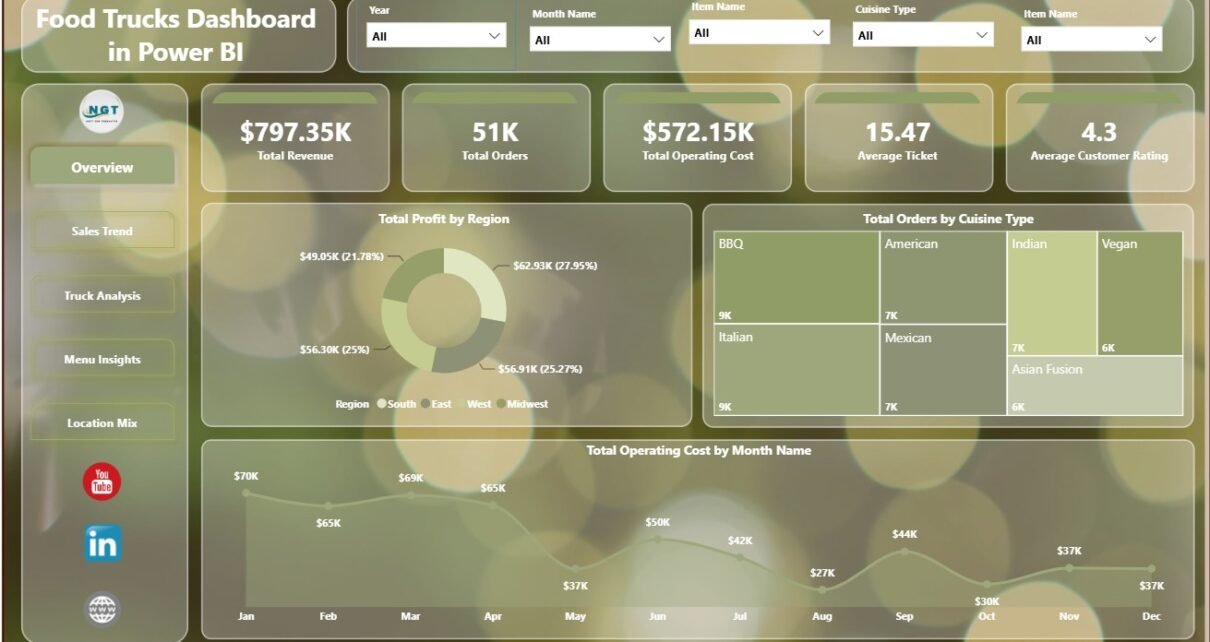
Food Trucks Dashboard in Power BI

June 14, 2026June 14, 2026 PKComments Off on Food Trucks Dashboard in Power BI
Food truck businesses often manage revenue, orders, operating cost, menu mix, event demand, service windows, cities, regions, payment methods, and customer ratings from separate files. When those records stay scattered,
Read More
Dashboard Power BI

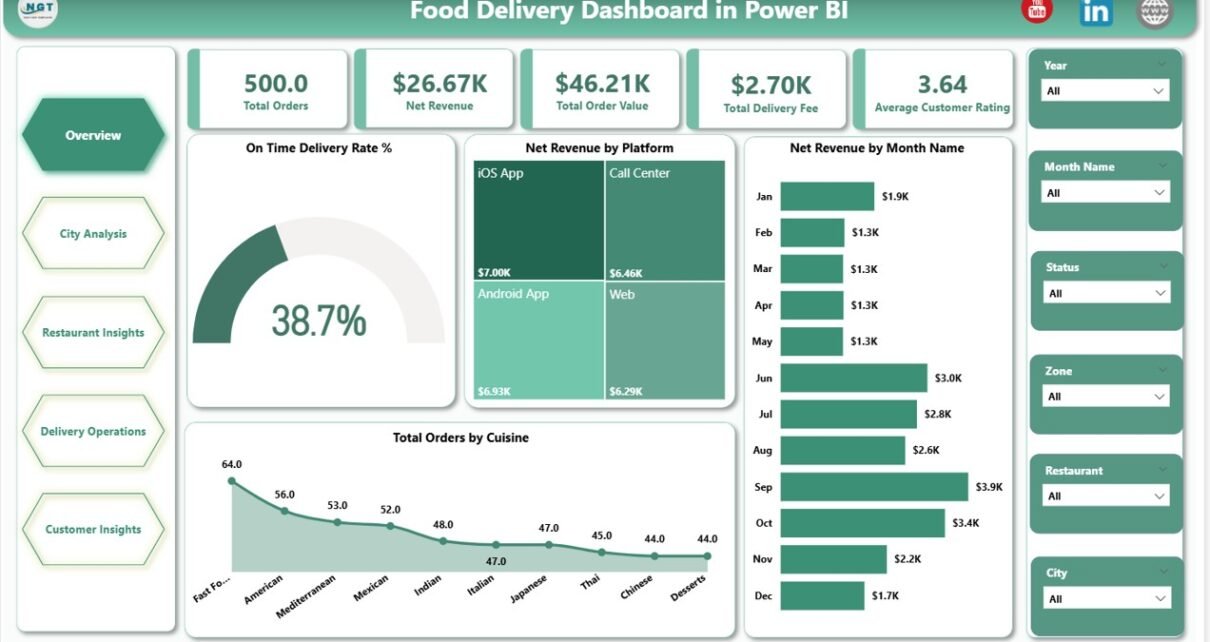
Food Delivery Dashboard in Power BI

May 16, 2026May 16, 2026 PKComments Off on Food Delivery Dashboard in Power BI
The global online food delivery market is projected to hit $1.65 trillion by 2027 (Statista, 2025), with operators running across 3-15 platforms on average and tracking 20+ KPIs per location.
Read More
Dashboard

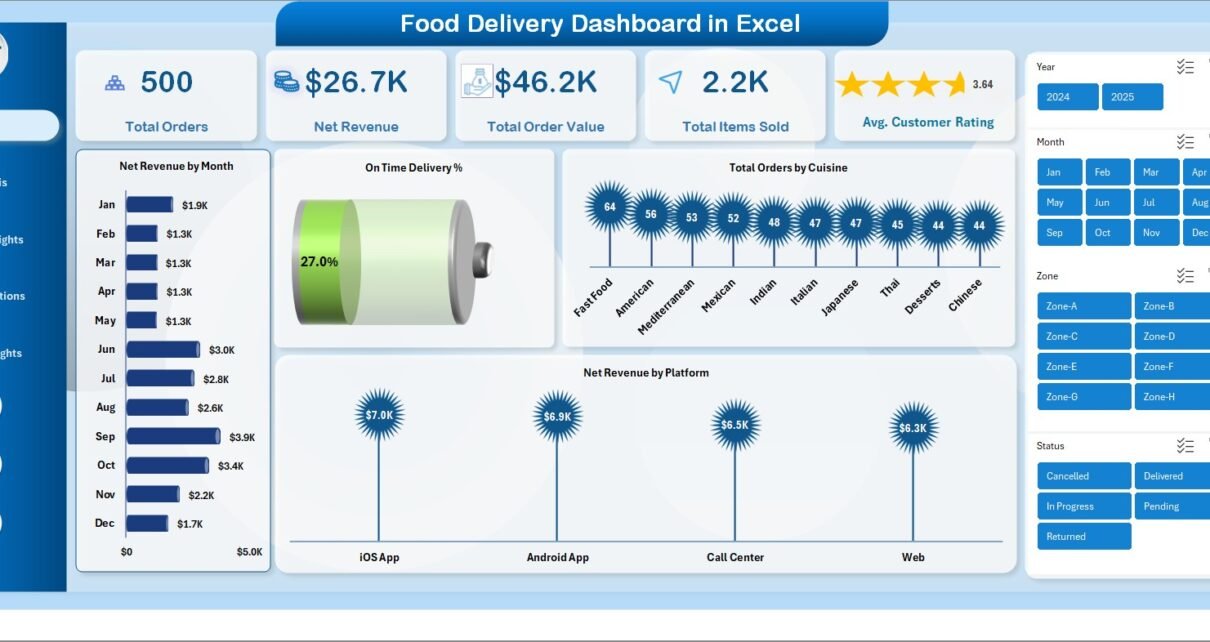
Food Delivery Dashboard in Excel

May 3, 2026May 14, 2026 PKComments Off on Food Delivery Dashboard in Excel
The Food Delivery Dashboard in Excel is a 5-page interactive analytics workbook tracking 18+ KPIs across orders, riders, restaurants, cities, and customer segments. Setup takes under 10 minutes — paste
Read More
Dashboard Power BI

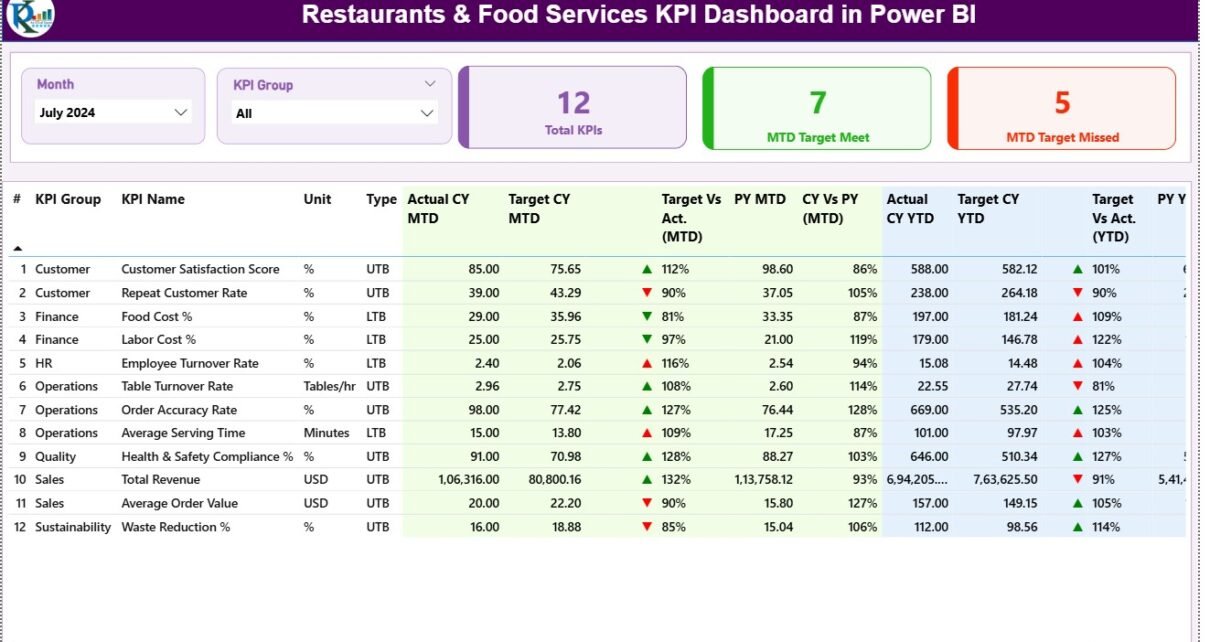
Restaurants & Food Services KPI Dashboard in Power BI

October 11, 2025October 11, 2025 PKComments Off on Restaurants & Food Services KPI Dashboard in Power BI
Restaurants & Food Services KPI Dashboard in Power BI Running a restaurant or food service business successfully requires much more than just great food and service. To thrive in today’s
Read More
  • Learn Excel (Free Course)
    • 1. Shortcut Keys
    • 2. Fill & Flash Fill
    • 3. Find & Replace
    • 4. Sort & Filter
    • 5. Formulas & Functions
    • 6. Data Validation
    • 7. Conditional Formatting
    • 8. Basic Charts
    • 9. Advanced Charts
    • 10. Pivot Tables
    • 11. Excel Dashboards
    • 12. VBA Course
    • 13. Excel Formulas with AI
  • Templates
  • Tutorials
    • Charts and Visualization
    • VBA
    • Excel Tips and Tricks
    • Excel Dashboards
    • Power Pivot & DAX
  • Power BI
  • Template Store
    • Ready to Use Templates
  • Courses
  • Academy
    • Excel + AI Mastery: 100 Formulas
    • Excel Pivot Tables & Dashboards
  • About Us
  • Contact Us
Copyright © 2023 PK-AnExcelExpert.com - Privacy Policy