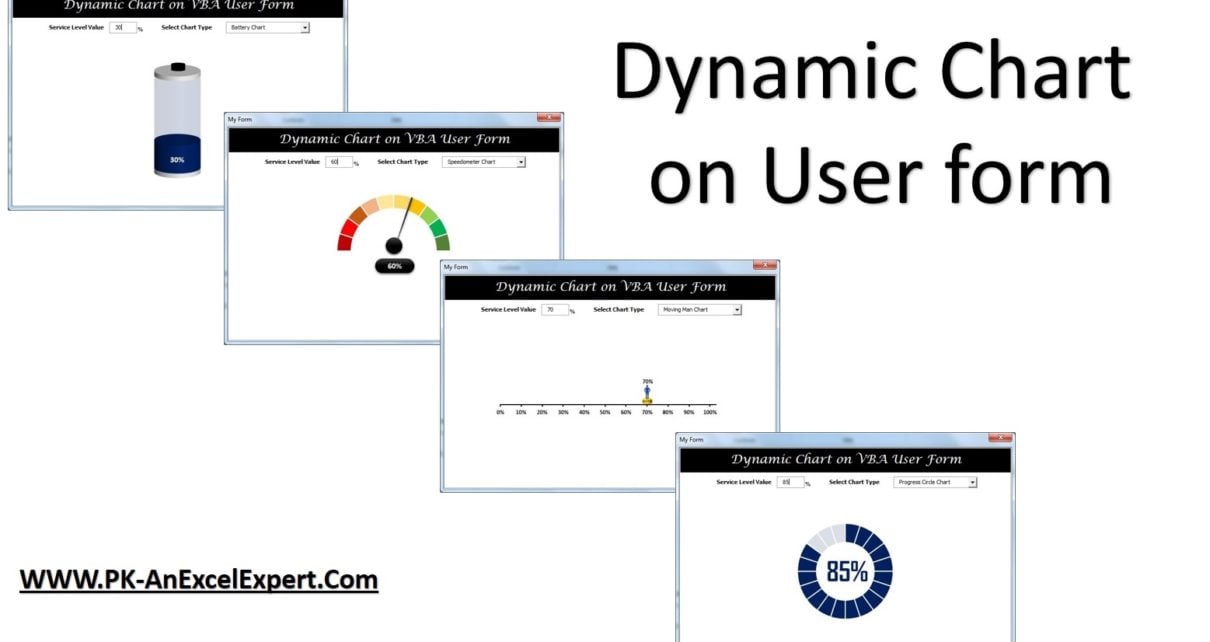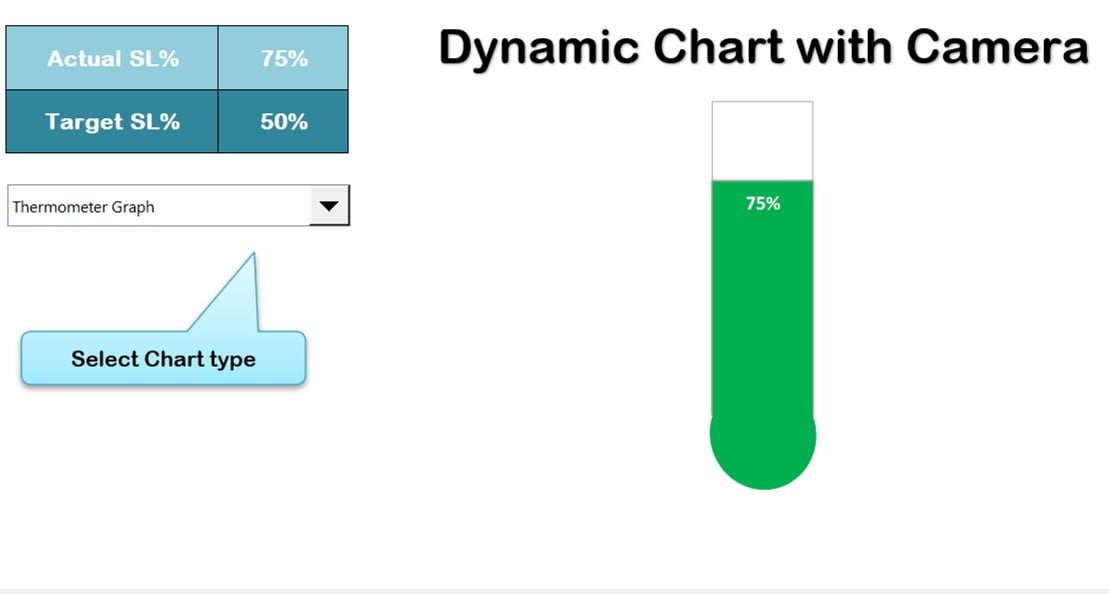
Dynamic Graph with Camera
In this article, we have created a dynamic graph with Camera functionality of Excel. We have used conditional formatting in Chart. You can change the chart type using Form Control
Transforming Data into Decisions