In today’s fast-moving digital world, customer service teams must resolve issues quickly and effectively. A delay in resolving customer tickets not only reduces satisfaction but also increases the chances of losing loyal customers.Ticket Resolution Time KPI Dashboard In Excel This is why ticket resolution time has become one of the most critical metrics in customer support operations. To track and optimize this, businesses now rely on Ticket Resolution Time KPI Dashboards in Excel.
This article will give you everything you need to know about this dashboard—its structure, key features, advantages, best practices, and real-world applications. We will also answer frequently asked questions at the end to provide complete clarity.Ticket Resolution Time KPI Dashboard In Excel
Click to buy Ticket Resolution Time KPI Dashboard In Excel
What Is a Ticket Resolution Time KPI Dashboard?
A Ticket Resolution Time KPI Dashboard is an Excel-based reporting tool that helps organizations measure, monitor, and improve how quickly customer service teams resolve support tickets. Ticket Resolution Time KPI Dashboard In Excel indicators (KPIs) in one centralized dashboard.
The dashboard not only highlights Month-to-Date (MTD) and Year-to-Date (YTD) performance but also compares current results with targets and previous year’s data. By combining interactive charts, dropdown filters, and conditional formatting, this tool makes decision-making fast and data-driven.
Click to buy Ticket Resolution Time KPI Dashboard In Excel
Structure of the Ticket Resolution Time KPI Dashboard in Excel
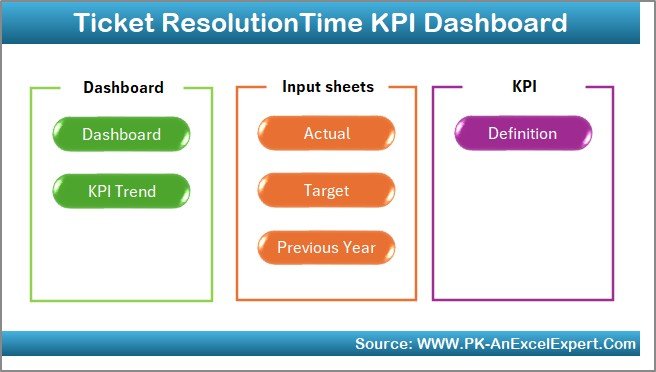
This dashboard is designed with seven powerful worksheets, each serving a unique purpose. Let’s walk through them in detail:
- Home Sheet
The Home sheet is the entry point of the dashboard. It acts as a navigation panel with clickable buttons that allow you to jump directly to different sheets. This makes the dashboard user-friendly, especially for beginners who are not very comfortable working with complex Excel models.
Click to buy Ticket Resolution Time KPI Dashboard In Excel
- Dashboard Sheet Tab
The Dashboard sheet is the heart of the entire model. It gives a bird’s-eye view of all KPIs related to ticket resolution.
- At cell D3, you can select the month from a dropdown list. Once selected, the entire dashboard updates instantly with the relevant data.
- It displays MTD Actual, Target, and Previous Year numbers along with comparison metrics.
- Conditional formatting with up and down arrows helps managers see whether the performance is improving or declining.
- The sheet also shows YTD Actual, Target, and Previous Year numbers, again with comparison insights.
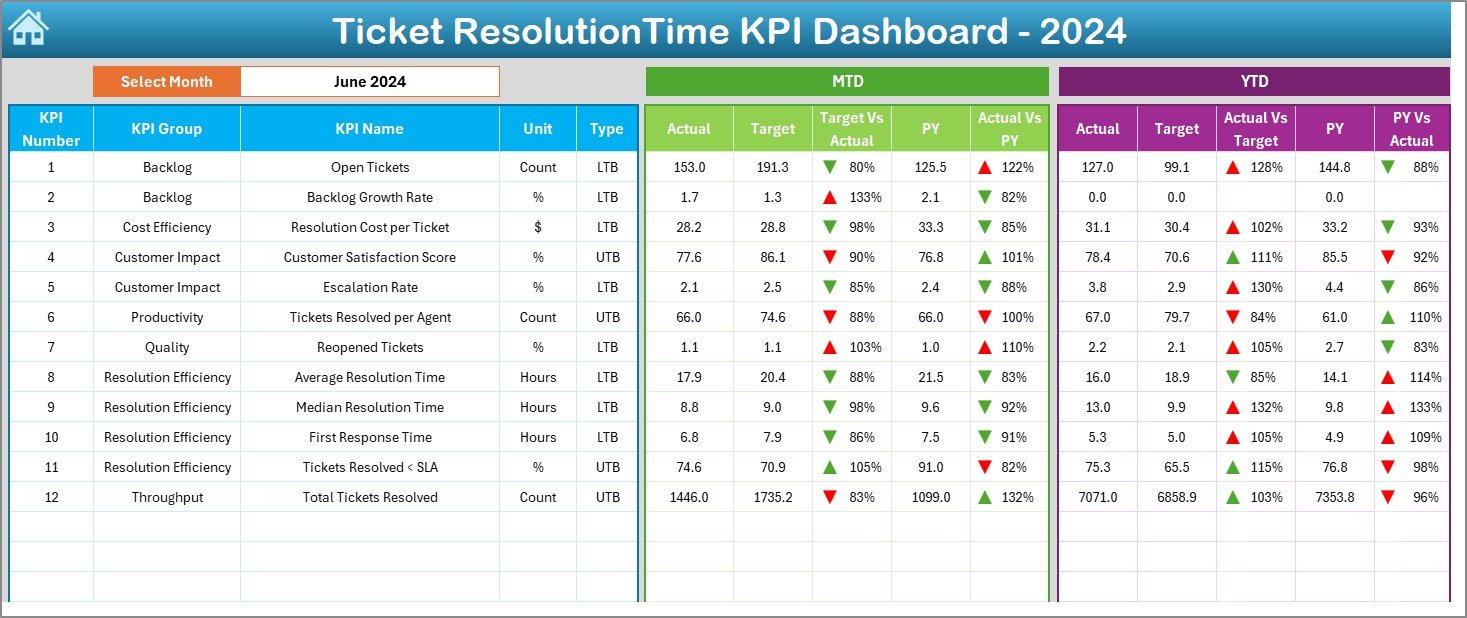
Click to buy Ticket Resolution Time KPI Dashboard In Excel
This sheet acts as a quick performance tracker for senior management.
- KPI Trend Sheet Tab
The KPI Trend sheet focuses on performance trends over time.
- At cell C3, you can select a KPI from the dropdown.
- Once selected, the dashboard shows the KPI Group, Unit, Formula, and Definition for clarity.
- Charts display MTD and YTD trends for Actual, Target, and Previous Year.
- This helps identify whether improvements are consistent or seasonal.

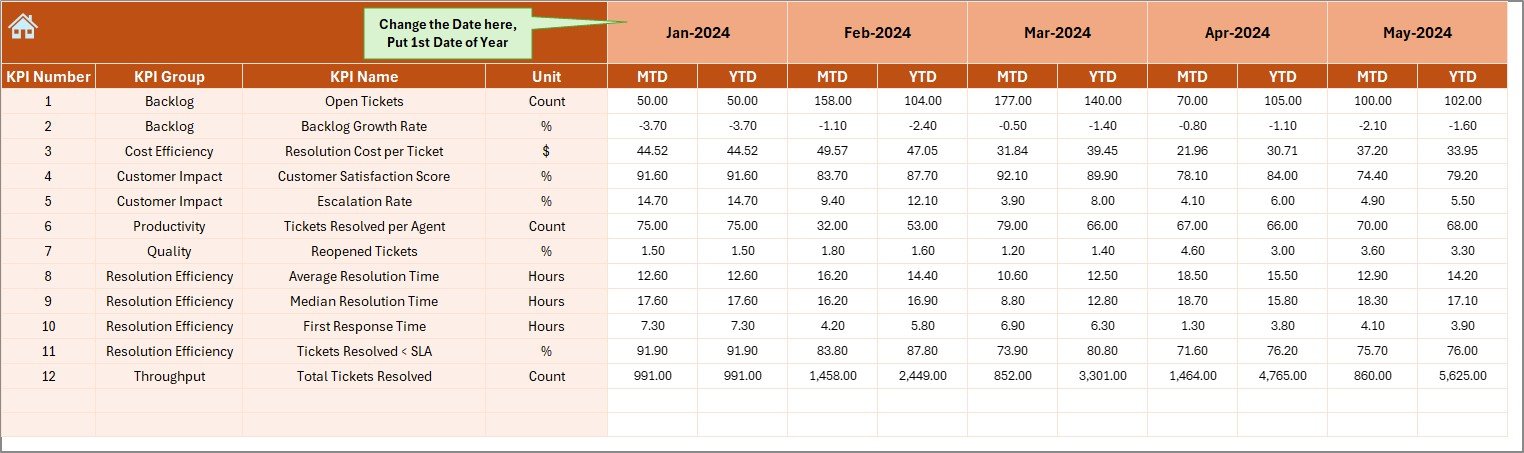
- Actual Numbers Input Sheet
This sheet is the data entry point for actual performance numbers.
- Users enter MTD and YTD values for each KPI.
- The month can be adjusted from cell E1 (first month of the year).
- Since this sheet drives the main dashboard, accurate data entry here ensures accurate reporting.
Click to buy Ticket Resolution Time KPI Dashboard In Excel
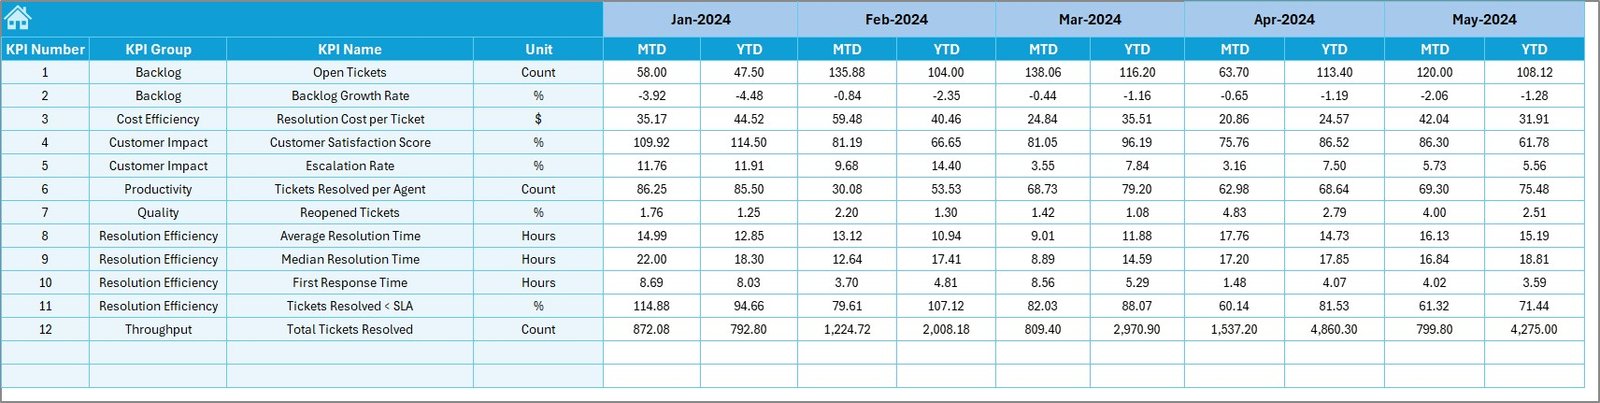
- Target Sheet Tab
The Target sheet allows managers to input monthly and yearly targets.
- Targets can be entered as MTD and YTD values.
- These targets form the benchmark for comparison with actual performance.
- By aligning actual results with targets, businesses can track whether service goals are on track.
Click to buy Ticket Resolution Time KPI Dashboard In Excel
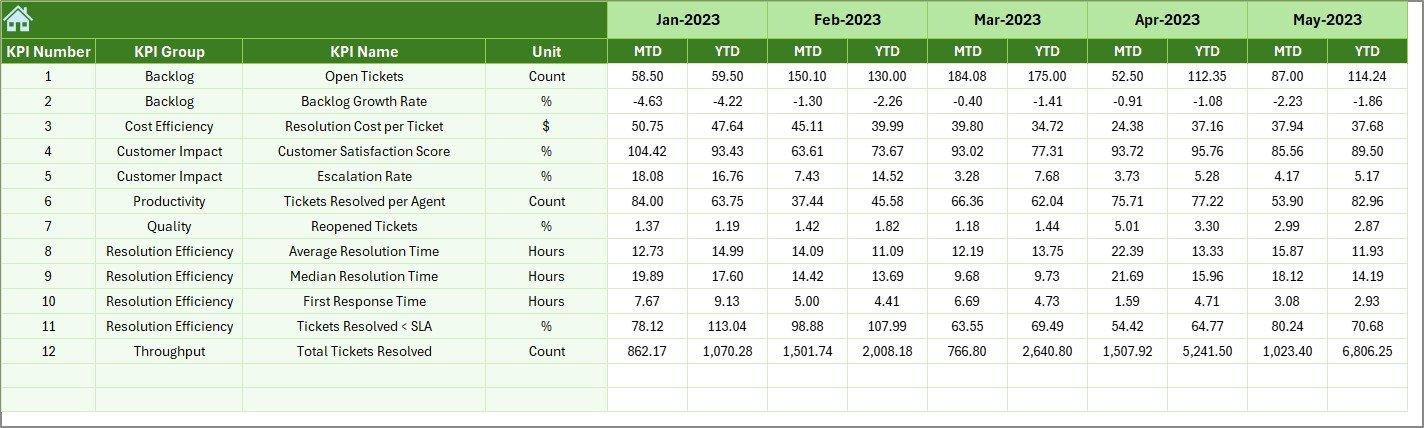
- Previous Year Number Sheet Tab
Historical performance plays a vital role in evaluating progress.
- This sheet stores previous year’s numbers for each KPI.
- It ensures that the dashboard can provide year-on-year comparisons.
- Businesses can see whether their strategies are leading to long-term improvements.
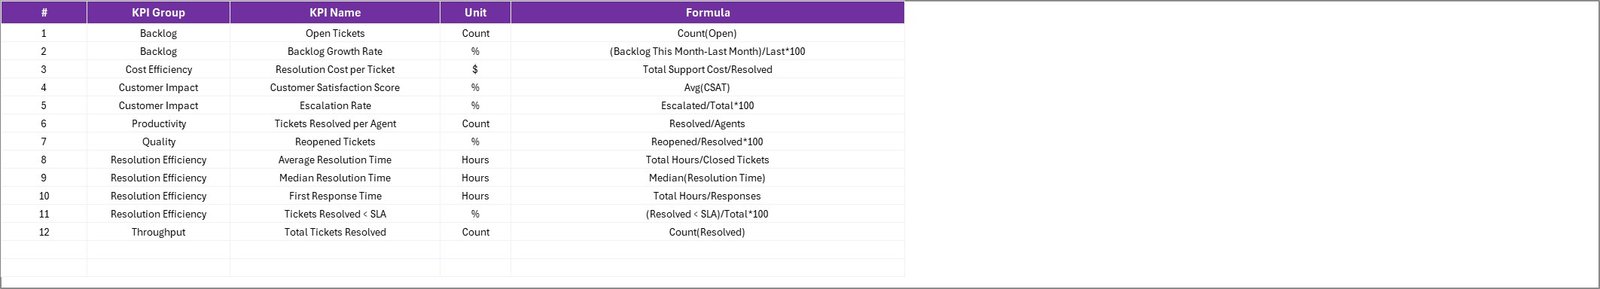
- KPI Definition Sheet Tab
This sheet is the reference library of all KPIs.
- It contains KPI Name, Group, Unit, Formula, and Definition.
- Each KPI is marked as UTB (Upper the Better) or LTB (Lower the Better).
- Having this tab ensures standardization and eliminates confusion among users.
Why Do Businesses Need a Ticket Resolution Time Dashboard?
Without structured tracking, businesses often fail to understand whether their customer service is truly effective. The Ticket Resolution Time Dashboard solves this problem by:
- Providing real-time insights into ticket resolution efficiency.
- Helping managers detect delays and bottlenecks.
- Offering visual comparisons with targets and past data.
- Allowing leaders to make data-driven decisions to improve service quality.
Advantages of the Ticket Resolution Time KPI Dashboard
Here are some of the key benefits:
- Centralized Reporting – All ticket-related KPIs are available in one dashboard.
- Time-Saving – No need to prepare manual reports. The dashboard auto-updates.
- Customizable – Works with any business size or industry by updating KPIs.
- Data Accuracy – Reduces manual calculation errors with built-in formulas.
- Better Decision-Making – Helps managers quickly spot areas needing attention.
- Improved Customer Experience – Faster resolution times mean happier customers.
Opportunities for Improvement in Ticket Resolution Time Dashboards
While the dashboard is powerful, there are still areas where businesses can improve:
- Automation – Integrating Excel with CRM tools (like Zendesk or Freshdesk) can reduce manual entry.
- Advanced Analytics – Adding Power BI or Tableau integration can give deeper insights.
- Real-Time Updates – Linking live ticketing data ensures immediate performance tracking.
- Predictive Analysis – Forecasting resolution times can help in staffing and resource planning.
- Mobile-Friendly Versions – Creating mobile dashboards can support on-the-go managers.
Best Practices for Using the Ticket Resolution Time Dashboard
To get maximum value from this dashboard, follow these best practices:
- Update Data Regularly – Enter actuals, targets, and previous year’s numbers consistently.
- Define Clear KPIs – Ensure all users understand KPI definitions to avoid confusion.
- Use Conditional Formatting – Highlight problem areas with color codes for quick attention.
- Review Trends Monthly – Focus not just on one month but also on YTD performance.
- Involve Stakeholders – Share insights with support agents, team leaders, and managers.
- Continuously Improve – Regularly refine KPIs based on customer needs and service goals.
Real-World Applications of Ticket Resolution Time Dashboards
This dashboard is not limited to IT service desks. It can be used across industries:
- E-commerce – Track resolution time for order delays, returns, and complaints.
- Healthcare – Monitor how quickly patient support teams resolve queries.
- Banking – Measure service desk efficiency for loan, credit, or account issues.
- Telecom – Track how fast agents resolve connectivity and billing complaints.
- Education – Monitor IT or administrative support ticket resolution for students and staff.
Conclusion
The Ticket Resolution Time KPI Dashboard in Excel is a powerful, practical, and customizable tool for businesses that care about customer satisfaction. By tracking ticket resolution times effectively, organizations can reduce customer frustration, improve service delivery, and achieve long-term loyalty.
With its structured sheets, interactive features, and performance insights, this dashboard enables managers to move away from guesswork and make data-backed decisions that drive efficiency.
Frequently Asked Questions (FAQs)
- What is Ticket Resolution Time?
Ticket resolution time is the average duration taken by a support team to resolve a customer query from the time it is raised until it is closed.
- Why is Ticket Resolution Time important?
It is important because longer resolution times lead to customer dissatisfaction, while faster resolutions improve loyalty and brand reputation.
- How does the Excel Dashboard calculate KPIs?
The dashboard uses formulas that compare MTD and YTD values against targets and previous year’s performance, with conditional formatting to highlight progress.
- Can small businesses use this dashboard?
Yes, the dashboard is fully customizable. Even small teams can adapt it by adding their specific KPIs.
- Can the dashboard be automated?
Yes, it can be automated by linking Excel with ticketing systems like Zendesk, Freshdesk, or ServiceNow using APIs or Excel connectors.
- What are some key KPIs included?
Common KPIs include Average Resolution Time, First Contact Resolution Rate, SLA Compliance Rate, Escalation Rate, and Customer Satisfaction Score.
- How often should data be updated?
It is best to update the dashboard monthly for MTD and YTD performance tracking. Weekly updates can be added for fast-paced industries.
Visit our YouTube channel to learn step-by-step video tutorials
Watch the step-by-step video tutorial:
Click to buy Ticket Resolution Time KPI Dashboard In Excel