The translation and localization industry grows quickly, and teams need clear performance insights to stay ahead. Projects move fast, clients expect accuracy, and teams must deliver consistent quality every month. Because of this rapid pace, managers struggle when they depend on multiple spreadsheets, emails, or scattered reports. These formats slow down the review process and hide the insights that help teams improve.
A Translation & Localization KPI Dashboard in Excel solves these problems. It brings all essential data into one simple, interactive, and easy-to-use dashboard. You track progress, compare performance, and make fast decisions without switching files. Moreover, the dashboard structure supports daily, weekly, monthly, and yearly reporting cycles. Anyone in translation, localization, linguistics, and content adaptation teams can use this dashboard for reliable KPI monitoring.
In this detailed guide, you will learn what this dashboard is, why it matters, how each worksheet works, and how you can use it to improve operational performance.
Click to buy Translation & Localization KPI Dashboard in Excel
What Is a Translation & Localization KPI Dashboard in Excel?
A Translation & Localization KPI Dashboard in Excel is a ready-made template that helps teams track performance indicators across translation, editing, proofreading, localization engineering, quality assurance, and workflow compliance. It organizes raw performance numbers into charts, tables, and scorecards that you can understand instantly.
You get monthly KPI results, year-to-date progress, quality ratings, delivery accuracy, project volumes, customer satisfaction, and many more insights in a single place. Because of this smart layout, you save time and make decisions with confidence.
You track KPIs such as:
- Translation Productivity
- Delivery Timeliness
- Quality Review Score
- Client Satisfaction
- Project Turnaround Time
- Rework Percentage
- Linguist Utilization
- Cost per Word or Project
Since everything updates automatically when you upload fresh data, your entire reporting workflow becomes smooth and fast.
Why Do Translation & Localization Teams Need a KPI Dashboard?
Translation and localization teams handle large volumes of content every month. These tasks involve linguists, editors, reviewers, project managers, and quality assurance teams. As a result, tracking performance becomes complicated without a central reporting tool.
A KPI dashboard helps because:
- You understand performance instantly.
- You identify issues before they affect deadlines.
- You compare your actual performance with targets and previous years.
- You monitor quality trends over time.
- You make data-driven decisions every day.
With an Excel-based dashboard, you avoid long manual reports and work with a powerful automated solution.
Key Features of the Translation & Localization KPI Dashboard in Excel
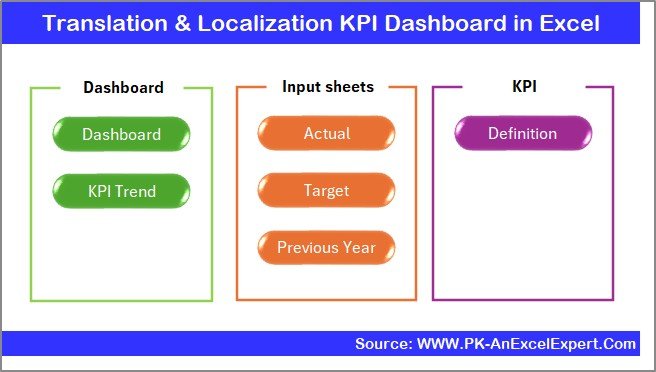
We have designed a structured dashboard with 7 powerful worksheets, each supporting clear performance monitoring. Below is the detailed explanation of each sheet.
Summary Page (Navigation Index)
The Summary Page works like an index. You get buttons that take you to different sheets instantly. This structure improves user experience and saves time because you skip the need to search through multiple sheets.
Your Summary Page includes:
- Buttons to navigate across 6 sheets
- A clean layout
- A user-friendly starting point for the entire dashboard
This small addition increases reporting speed and keeps everything organized.
Click to buy Translation & Localization KPI Dashboard in Excel
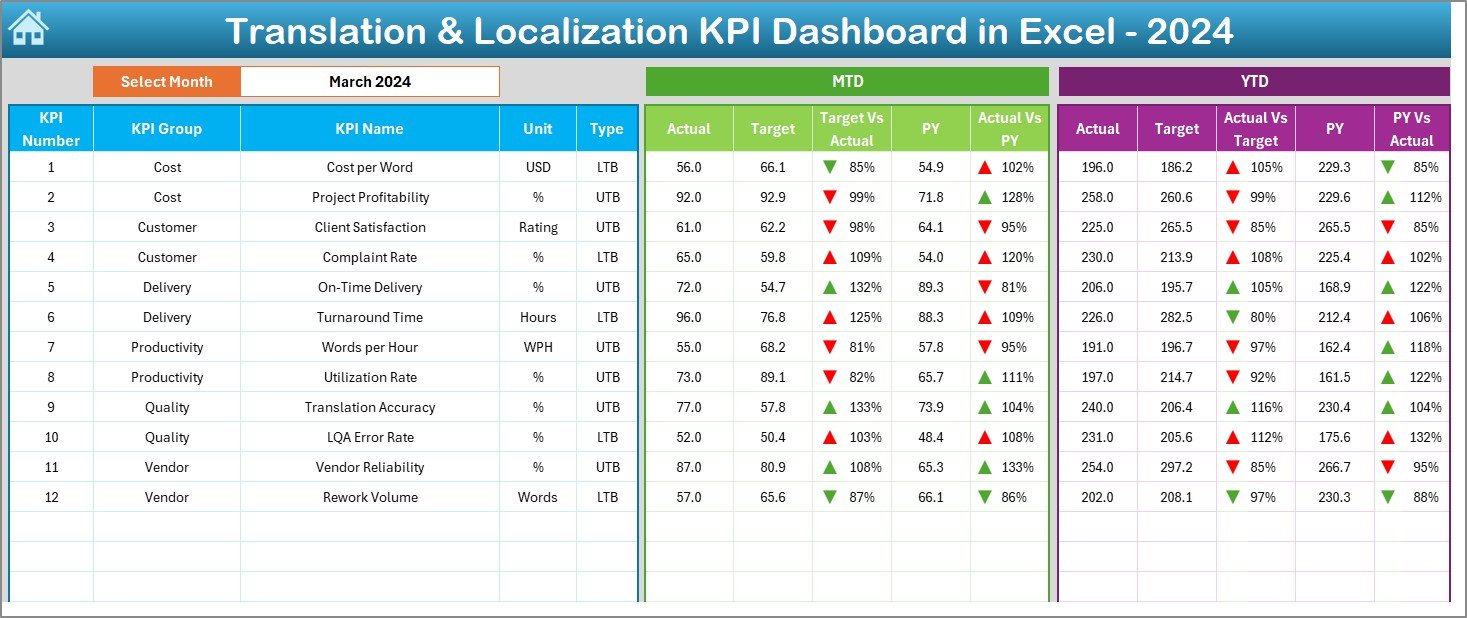
Dashboard Sheet Tab (Main Visualization Page)
The Dashboard Sheet is the heart of the template. You get a complete overview of monthly and yearly performance. When you select a month from the dropdown in cell D3, the entire dashboard updates automatically. As a result, you understand performance quickly without manual calculations.
This sheet shows:
- MTD (Month-to-Date) Actual vs Target vs Previous Year
- YTD (Year-to-Date) Actual vs Target vs Previous Year
- Conditional formatting arrows to show performance trends
- Clear comparisons between current results, goals, and past years
This sheet helps you identify strengths and weaknesses fast. It also gives you a real-time view of overall translation and localization performance.
Click to buy Translation & Localization KPI Dashboard in Excel
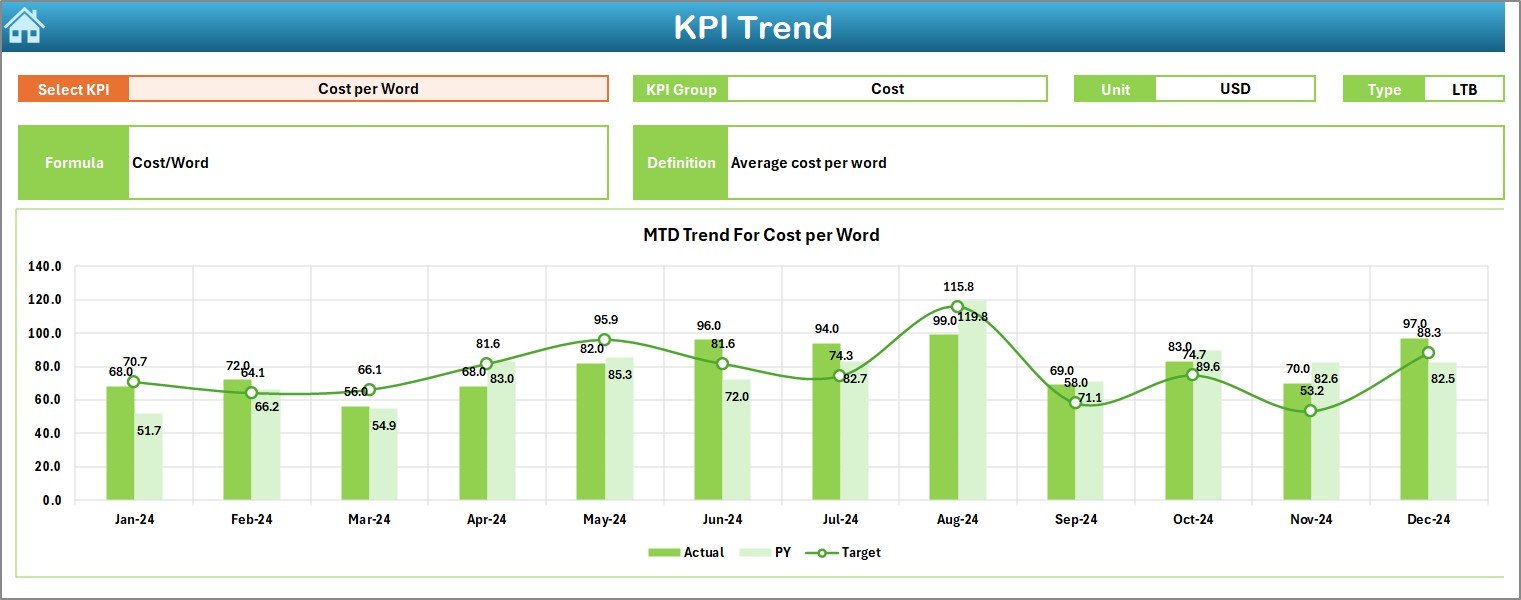
Trend Sheet Tab (Detailed KPI Trend Analysis)
The Trend Sheet gives you deeper insights into each KPI. When you select a KPI from the dropdown in cell C3, the sheet displays:
- KPI Group
- Unit
- KPI Type (Lower-the-Better or Upper-the-Better)
- KPI Formula
- KPI Definition
Additionally, you get trend charts for:
- Monthly MTD performance
- Monthly YTD performance
- Target Comparisons
- Previous Year Comparisons
This page helps project managers analyze performance patterns and identify long-term trends.
Click to buy Translation & Localization KPI Dashboard in Excel
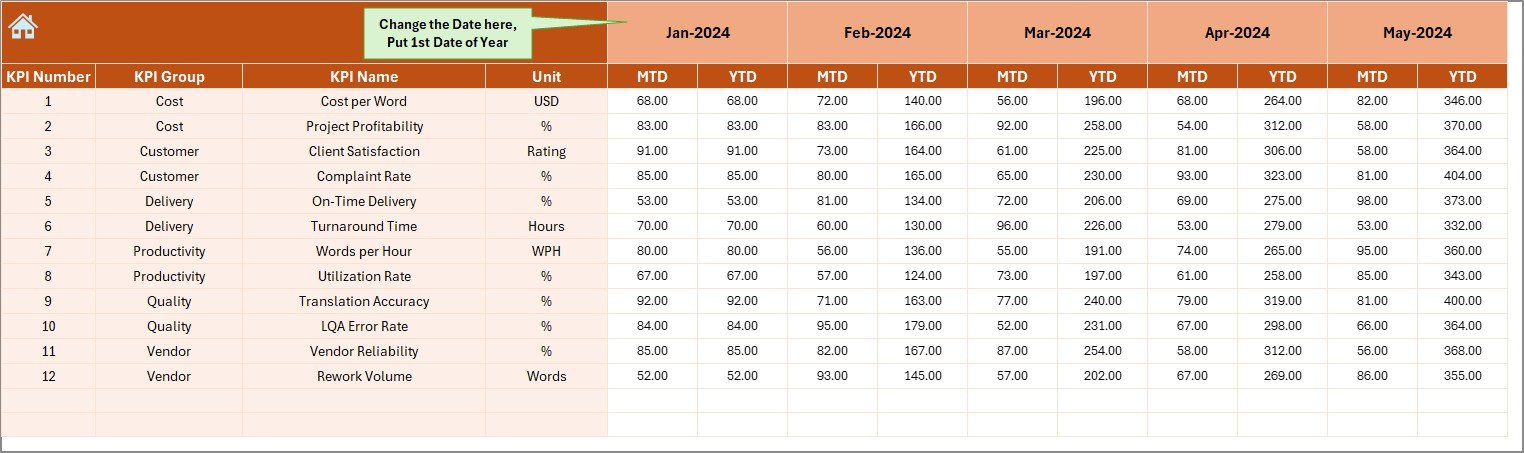
Actual Numbers Input Sheet
This sheet allows you to enter the monthly Actual MTD and YTD numbers. You can select the first month of the year from cell E1, and the sheet adjusts automatically.
You only need to enter:
- Actual MTD numbers
- Actual YTD numbers
This structure ensures accurate reporting and timeline consistency.
Click to buy Translation & Localization KPI Dashboard in Excel
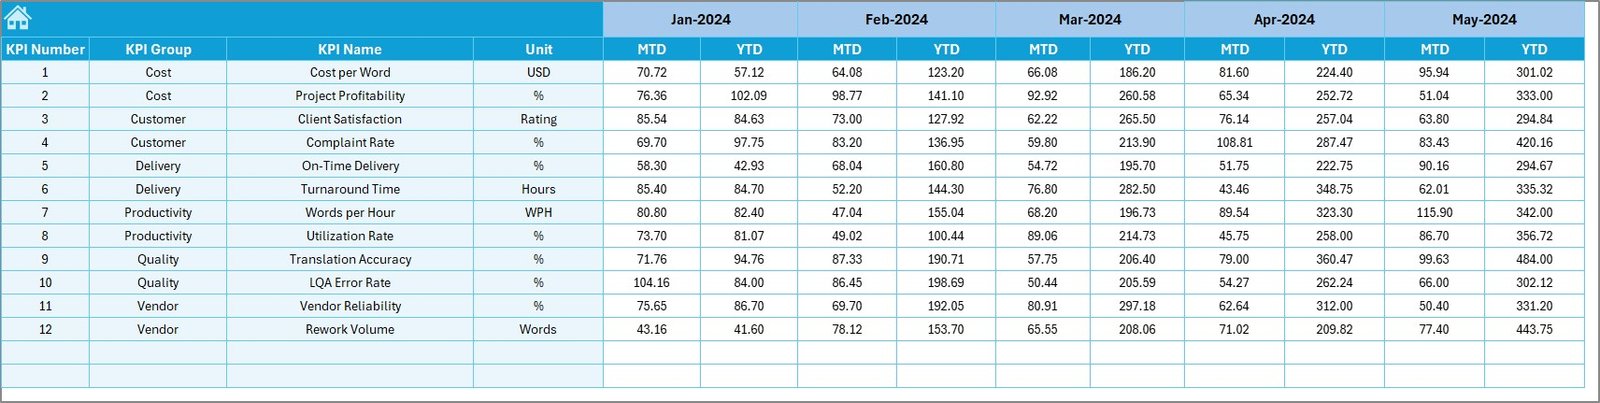
Target Sheet Tab
In this sheet, you enter target values for each KPI. You enter both:
- Monthly MTD Targets
- Monthly YTD Targets
These targets work as benchmarks on the dashboard. When you compare actual performance with targets, you understand how well your team performs.
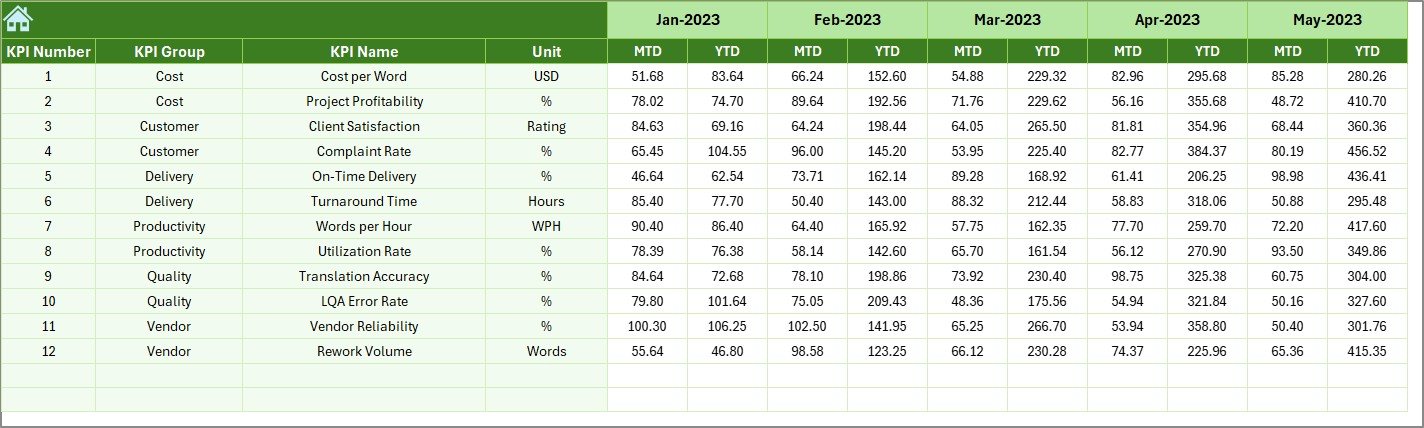
Previous Year Numbers Sheet Tab
This sheet collects the previous year’s numbers in the same structure as the current year. You get:
- Previous Year MTD
- Previous Year YTD
These values help you compare year-over-year performance, making the dashboard more meaningful.
Click to buy Translation & Localization KPI Dashboard in Excel
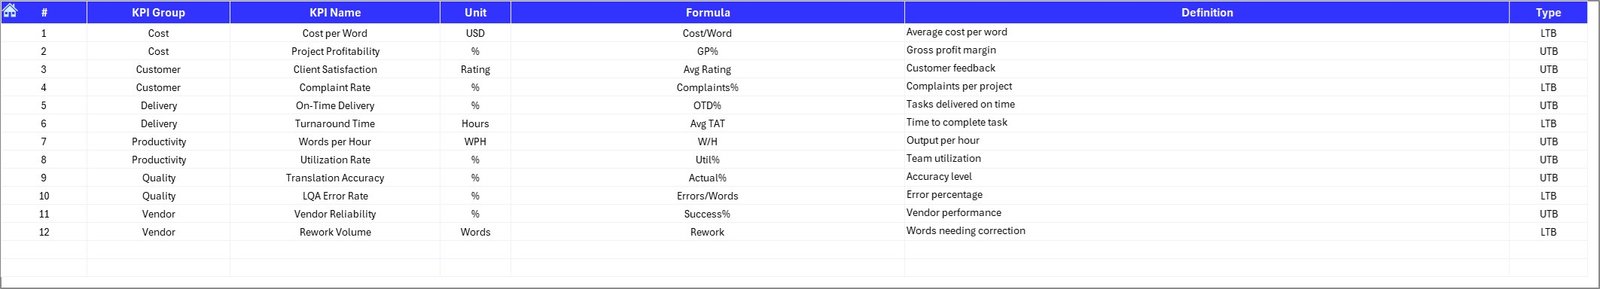
KPI Definition Sheet Tab
This sheet contains:
- KPI Name
- KPI Group
- Unit
- Formula
- KPI Definition
This sheet helps you standardize KPI understanding across teams. As a result, everyone follows the same definitions and measurements.
Click to buy Translation & Localization KPI Dashboard in Excel
What KPIs Should You Track in a Translation & Localization Dashboard?
Your dashboard can track many KPIs depending on your process. Here are important categories:
Productivity KPIs
- Words Translated per Hour
- Project Completion Rate
- Linguist Utilization
Quality KPIs
- Error Density
- Quality Score
- Rework Percentage
Cost KPIs
- Cost per Word
- Project Budget Variance
- Vendor Cost Efficiency
Delivery KPIs
- On-Time Delivery Rate
- Turnaround Time
- Delay Frequency
Customer KPIs
- Client Satisfaction Score
- Repeat Client Rate
- Complaint Count
Tracking these metrics helps you understand performance deeply and make fast improvements.
How Does This Dashboard Help Improve Translation & Localization Performance?
This dashboard improves your workflow because:
You analyze performance faster
All results appear instantly with charts and tables.
You compare current results with targets
You see gaps and take timely action.
You monitor year-over-year progress
You understand if your team improves continuously.
You manage quality more effectively
You identify common errors and improve training.
You reduce delays
You track turnaround time and plan resources better.
You take data-driven decisions
You use numbers, not assumptions, for every improvement.
Advantages of a Translation & Localization KPI Dashboard in Excel
- Saves Time
The dashboard automates calculations and updates, so teams avoid manual reporting.
- Improves Accuracy
You use structured sheets that reduce human errors.
- Enhances Visibility
Managers understand performance at a single glance.
- Supports Better Planning
You predict future performance based on trends.
- Helps in Quality Management
You find quality gaps and take action sooner.
- Easy to Use
Anyone with basic Excel knowledge can use this dashboard.
- Works for Any Scale
Freelancers, small agencies, and enterprise localization teams can all use it.
Best Practices for Using a Translation & Localization KPI Dashboard in Excel
Follow these best practices to get the most benefits:
Update Actual Numbers Regularly
Enter monthly MTD and YTD data on time.
Review Targets Every Quarter
Make sure your targets stay realistic and aligned with business goals.
Use Standard KPI Definitions
Keep your KPI definitions consistent using the KPI Definition sheet.
Analyze Trends Frequently
Use the Trend sheet to identify problems early.
Track Year-over-Year Progress
Compare results with previous years to see improvements.
Use Conditional Formatting Wisely
Use arrows, icons, and colors for clearer interpretation.
Involve Your Team
Share insights so everyone understands performance.
Conclusion
A Translation & Localization KPI Dashboard in Excel helps you monitor performance in a simple, effective, and structured way. It brings your KPIs into easy-to-read charts and tables so you can make faster, more confident decisions. With seven useful worksheets, automated calculations, and clear monthly comparisons, you improve productivity, quality, timeliness, and overall performance. When you follow best practices and update your numbers regularly, your workflow becomes more transparent and predictable.
This dashboard is perfect for translation agencies, localization teams, LSPs, project managers, and freelancers who want to manage performance professionally.
Frequently Asked Questions (FAQs)
- What is a Translation & Localization KPI Dashboard?
It is an Excel-based tool that tracks key performance indicators related to translation, editing, localization, and quality management.
- Who can use this dashboard?
Translation agencies, localization teams, freelance linguists, reviewers, project coordinators, and QA specialists can use it.
- What KPIs are included in the dashboard?
You track productivity, quality, cost, delivery, and customer-related KPIs.
- Does the dashboard update automatically?
Yes. When you enter new data or change the selected month, the dashboard updates instantly.
- How often should I update the numbers?
You should update the data every month for accurate reporting.
- Can beginners use this dashboard?
Yes. It is simple, structured, and easy to use with basic Excel knowledge.
- Can I add more KPIs?
Absolutely. You can add more KPIs in the KPI Definition sheet and update the data sheets accordingly.
Visit our YouTube channel to learn step-by-step video tutorials
Watch the step-by-step video tutorial:
Click to buy Translation & Localization KPI Dashboard in Excel