Transportation safety plays a major role in keeping passengers, drivers, cargo, and vehicles safe. Companies monitor accidents, vehicle conditions, driver performance, fuel behavior, and compliance to reduce risks. However, many teams struggle because their safety data sits in several files or scattered sheets. As a result, they cannot find insights quickly, and decision-making becomes slow.
A Transportation Safety KPI Scorecard in Excel solves this problem. It brings all safety indicators into one simple, organized, and visual platform. You track performance, compare targets, monitor monthly trends, and take decisions faster. This guide explains everything about the Transportation Safety KPI Scorecard, including its structure, features, advantages, best practices, and FAQs.
Clicl to buy Transportation Safety KPI Scorecard in Excel
What Is a Transportation Safety KPI Scorecard in Excel?
A Transportation Safety KPI Scorecard in Excel is a ready-to-use reporting tool that measures transportation-related safety performance. It organizes KPIs such as accident rate, driver behavior score, vehicle inspection compliance, on-time maintenance, breakdown incidents, and road safety violations in a clean and interactive format.
Since the scorecard runs in Excel, safety managers and operations teams do not need advanced tools. You enter the values in a simple Input Data sheet. The scorecard automatically updates the visuals, KPI comparisons, and trend charts. This helps everyone track safety progress month-by-month and stay aligned with the organization’s safety goals.
Key Features of the Transportation Safety KPI Scorecard in Excel
The Transportation Safety Scorecard includes four powerful worksheets, each designed to simplify reporting and analysis.
Scorecard Sheet (Main Dashboard)
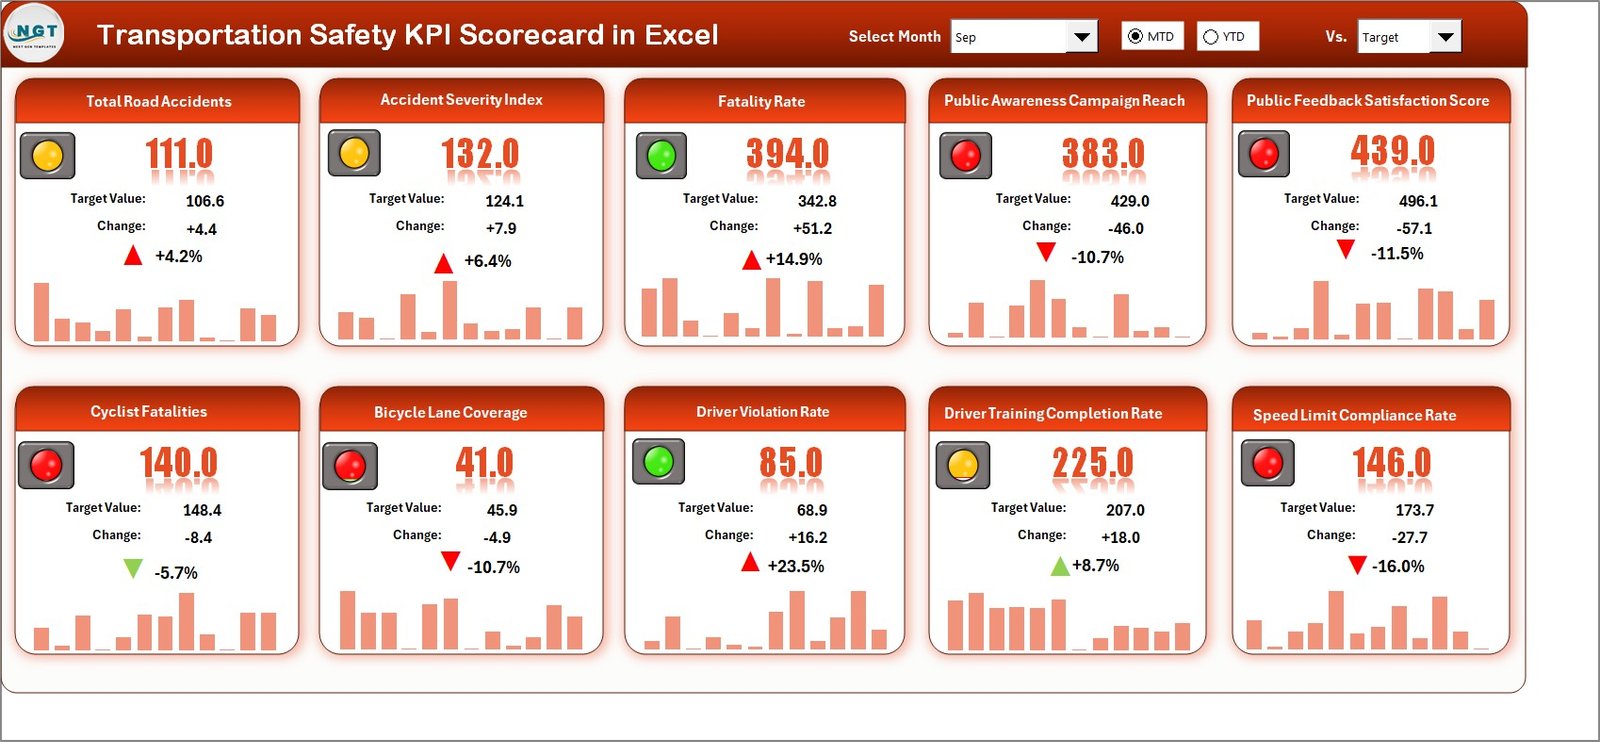
The Scorecard Sheet works as the heart of the entire scorecard. It shows the overall performance of all KPIs in one clean interface.
Key Features of the Scorecard Sheet
- Dropdown Menus:
You select the Month, MTD (Month-to-Date), or YTD (Year-to-Date) to see performance instantly. - Actual vs Target Values:
You compare actual performance against planned targets for each KPI. - Visual Indicators:
The scorecard uses color-coded indicators or conditional formatting to highlight good or poor performance. - One-View Scorecard:
The sheet shows 10 KPIs at once, offering a complete overview of transportation safety. - Complete Monthly View:
You see the actual, target, and gap values for both MTD and YTD.
Because of this design, teams track performance quickly and make decisions without confusion.
Clicl to buy Transportation Safety KPI Scorecard in Excel
KPI Trend Sheet
The KPI Trend Sheet shows the month-wise trend for each KPI. You select a KPI name from the dropdown menu in cell C3, and the sheet instantly updates.
What You See in the KPI Trend Sheet
- KPI Group (Example: Driver Safety, Vehicle Safety, Road Compliance)
- Unit of KPI (e.g., %, Count, Score)
- Type of KPI (UTB – Upper the Better, LTB – Lower the Better)
- KPI Formula (short and clear)
- KPI Definition
A short explanation of what the KPI measures.

Clicl to buy Transportation Safety KPI Scorecard in Excel
Trend Visuals
- MTD Trend Chart
Shows MTD Actual, Target, and Previous Year values. - YTD Trend Chart
Shows the full-year cumulative trend for performance comparison.
This sheet helps teams understand whether performance is improving, declining, or staying flat.
Input Data Sheet
The Input Data Sheet is the foundation of the scorecard. You enter all monthly values here.
How It Works
- You record monthly KPI values such as Actual, Target, and Previous Year.
- You update data for every KPI across every month.
- The scorecard automatically refreshes all visuals.
The sheet gives you full flexibility to update numbers anytime. As a result, your scorecard always stays accurate and up to date.

Clicl to buy Transportation Safety KPI Scorecard in Excel
KPI Definition Sheet
The KPI Definition Sheet stores the basic structure of every KPI.
What You Enter Here
- KPI Name
- KPI Group
- Unit of Measurement
- KPI Formula
- KPI Definition
- KPI Type (LTB / UTB)
This sheet ensures consistency. Anyone who views the scorecard understands every KPI clearly.

Why Transportation Safety KPIs Matter
Transportation teams handle long routes, heavy loads, high-risk driving conditions, and strict safety regulations. When safety KPIs stay unclear, accidents increase, and operating costs shoot up.
A KPI scorecard helps managers track:
- Accident frequency
- Driver behavior
- Vehicle maintenance
- Road safety compliance
- Breakdown incidents
- Training effectiveness
Because all KPIs stay visible, companies reduce risks and improve safety culture.
How the Scorecard Improves Transportation Safety
The Transportation Safety Scorecard delivers several improvements:
Brings Data Together
Instead of searching different files, users get all KPIs in one dashboard.
Speeds Up Decision-Making
The dropdown filters help teams see performance faster.
Supports Predictive Safety
MTD and YTD numbers highlight early risks before they become major issues.
Improves Communication
Drivers, supervisors, and safety managers view the same numbers.
Builds Accountability
Targets and comparisons make every team responsible for performance.
Because of these advantages, organizations manage transport safety with confidence.
Top KPIs to Track in a Transportation Safety Scorecard
While every company chooses KPIs based on their needs, common Transportation Safety KPIs include:
- Accident Frequency Rate
- Road Safety Violations
- On-Time Vehicle Inspection %
- Preventive Maintenance Completion %
- Driver Behavior Score
- Fuel Safety Efficiency
- Breakdown Incidents
- Driver Training Completion %
- Delivery Safety Compliance %
- Near-Miss Reporting Rate
These indicators show how safe the fleet, drivers, and operations truly are.
How to Use the Transportation Safety KPI Scorecard
The scorecard is designed for ease of use. Anyone with basic Excel knowledge can work with it.
- Step 1: Enter KPI values in the Input Data Sheet
- Fill Actual, Target, and Previous Year numbers.
- Step 2: Update the KPI Definition Sheet
- Add or modify KPI names, units, formulas, and definitions.
- Step 3: View Results in the Scorecard Sheet
- Use the dropdown to select Month, MTD, or YTD.
- Step 4: Analyze Trends
- Visit the KPI Trend Sheet and check the performance direction.
- Step 5: Take Action
Use the insights to improve driver behavior, reduce violations, or schedule maintenance.
Advantages of Transportation Safety KPI Scorecard in Excel
A scorecard offers many advantages for safety management. Below are the major ones:
- Easy to Use
Excel is simple, familiar, and widely available. Teams do not need technical training.
- Real-Time Reporting
As soon as you update data, dashboards refresh instantly.
- Clear Visuals
Conditional formatting, arrows, and color codes show performance clearly.
- Centralized Information
All KPIs, definitions, trends, and data stay in one file.
- Better Safety Culture
When performance stays visible, teams work with responsibility.
- Tracking Becomes Faster
The scorecard saves time by eliminating manual calculations.
- Full Customization
You add KPIs, change formulas, or update targets anytime.
- Trend Visibility
MTD and YTD charts help you view long-term progress.
- Improved Compliance
Managers track violations and inspection delays before they cause issues.
- Supports Data-Driven Decisions
Leadership plans better when they trust the numbers.
These advantages make the scorecard a powerful solution for every transport-based organization.
Best Practices for the Transportation Safety KPI Scorecard in Excel
Following best practices ensures accurate reporting and better safety decisions.
Update Data Regularly
Enter fresh data every week or month so the scorecard stays relevant.
Keep KPIs Short and Clear
Use simple KPI names and avoid complicated formulas.
Use Balanced Metrics
Include KPIs related to drivers, vehicles, compliance, and operations.
Track Both MTD and YTD
This helps you analyze short-term performance and long-term impact.
Align KPIs with Goals
Choose KPIs that support your organization’s safety goals.
Use Conditional Formatting Effectively
Highlight high-risk KPIs in red and top-performing ones in green.
Analyze Trends, Not Just Current Data
Check the KPI Trend Sheet to understand performance direction.
Involve Drivers and Supervisors
Share scorecard insights with teams who manage daily operations.
Review KPI Definitions Often
Ensure accuracy and clarity in every KPI.
Automate Refresh
Whenever possible, use Pivot Tables with automatic refresh options.
These best practices improve the scorecard’s accuracy and usefulness.
Who Should Use the Transportation Safety KPI Scorecard?
The scorecard benefits several users:
- Transportation Managers
- Fleet Supervisors
- Safety Officers
- Driver Management Teams
- Logistics Coordinators
- Compliance Departments
- Company Owners
Anyone handling transportation operations gains value from this scorecard.
Conclusion
Transportation safety becomes stronger when organizations track the right KPIs. A Transportation Safety KPI Scorecard in Excel makes this easier by bringing all data into one interactive dashboard. With dropdown filters, trend charts, definitions, and target comparisons, the scorecard delivers complete safety insights in seconds. It helps teams reduce risks, avoid accidents, improve compliance, and build a culture of safe driving.
When you use this scorecard consistently and follow best practices, transportation safety improves across every level of the organization.
Frequently Asked Questions (FAQs)
What is a Transportation Safety KPI Scorecard in Excel?
It is a ready-to-use Excel tool that tracks key safety indicators such as accident rate, driver behavior, maintenance compliance, and safety violations.
Who can use this scorecard?
Safety managers, transportation supervisors, fleet teams, and logistics departments can use it to track safety performance.
Do I need advanced Excel knowledge to use it?
No. The scorecard uses dropdowns and simple data entry. Anyone with basic Excel skills can work with it.
How often should I update the data?
You should update data every month or whenever new performance values are available.
Can I add more KPIs to the scorecard?
Yes. You can modify the KPI Definition Sheet and add new KPIs as per your requirements.
Does the scorecard show trends?
Yes. The KPI Trend Sheet displays both MTD and YTD trend charts.
What makes the Excel scorecard better than manual reporting?
It automates calculations, reduces errors, highlights risks, and improves decision-making.
Visit our YouTube channel to learn step-by-step video tutorials
Watch the step-by-step video tutorial:
Clicl to buy Transportation Safety KPI Scorecard in Excel
