The travel and tourism industry thrives on experiences, but behind every great experience lies data, analysis, and performance tracking. Whether you run a hotel chain, travel agency, airline, or destination management company, you need clear visibility into your key performance indicators (KPIs). Without a structured way to monitor your results, decision-making becomes guesswork.
That’s where the Travel & Tourism KPI Scorecard in Excel comes in.
This ready-to-use Excel template simplifies performance tracking by converting raw tourism data into meaningful insights. From occupancy rate to revenue per available room and customer satisfaction, this scorecard empowers business owners and managers to measure success accurately and make smarter decisions.
In this detailed article, you’ll discover how this scorecard works, its features, advantages, and best practices. You’ll also learn why using an Excel-based KPI scorecard remains one of the most cost-effective and flexible ways to manage performance in the travel and tourism industry.
Click to buy Travel & Tourism KPI Scorecard in Excel
What Is a Travel & Tourism KPI Scorecard in Excel?
A Travel & Tourism KPI Scorecard in Excel is a structured dashboard designed to track, measure, and visualize the performance of tourism operations. It helps you organize key metrics—such as bookings, occupancy, profit margins, and guest satisfaction—into one centralized report.
Built entirely in Microsoft Excel, it provides an intuitive layout where you can input monthly data, set targets, and instantly view performance results. The scorecard automatically compares Actual vs Target and Month-to-Date (MTD) or Year-to-Date (YTD) trends using color-coded visuals and conditional formatting.
Unlike complex business intelligence tools, this Excel template requires no coding, external software, or database connection. You can download it, enter your KPIs, and start analyzing your tourism performance right away.
Why Do Travel Businesses Need a KPI Scorecard?
In today’s competitive environment, travel businesses must operate efficiently while maintaining customer satisfaction. A KPI scorecard provides a clear picture of operational health. Here’s why it’s essential:
- Data-Driven Decisions: Understand what’s working and what isn’t.
- Performance Visibility: Track departmental achievements in real time.
- Goal Alignment: Compare actual results against strategic targets.
- Efficiency Improvement: Identify gaps, reduce costs, and enhance productivity.
- Profitability Insights: Analyze the revenue generated by each service area—flights, accommodations, packages, and tours.
Without a KPI scorecard, travel businesses may rely on assumptions or fragmented data. This Excel-based tool transforms scattered information into organized performance dashboards.
Key Features of the Travel & Tourism KPI Scorecard in Excel
The Travel & Tourism KPI Scorecard in Excel consists of four powerful worksheet tabs designed for easy navigation and comprehensive analysis.
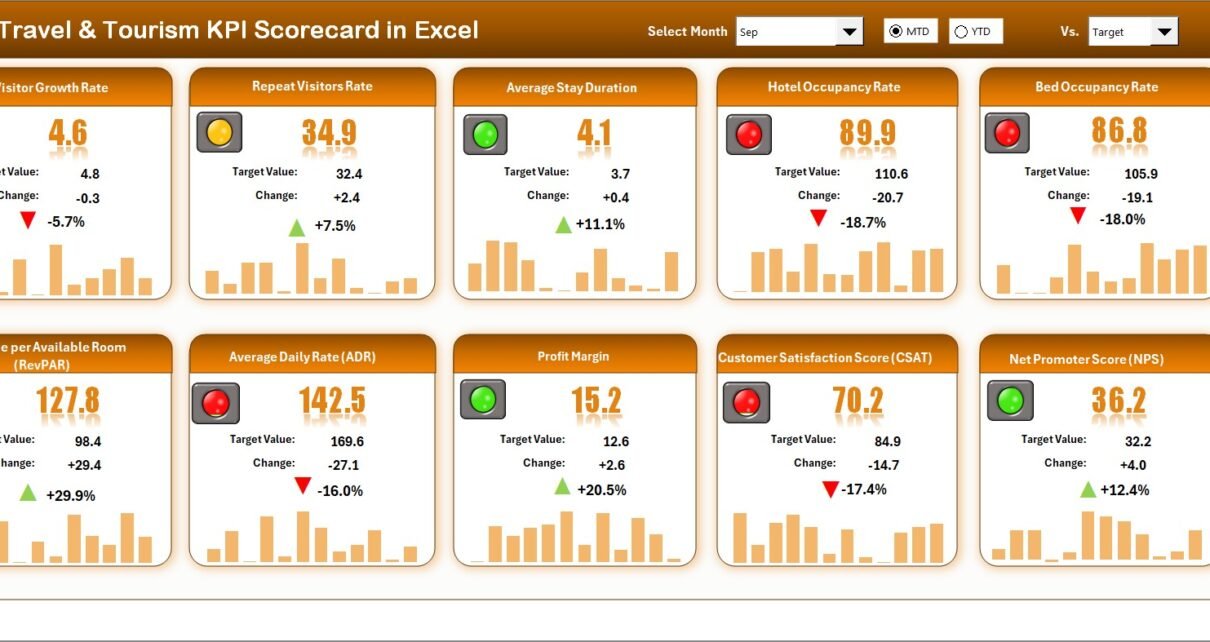
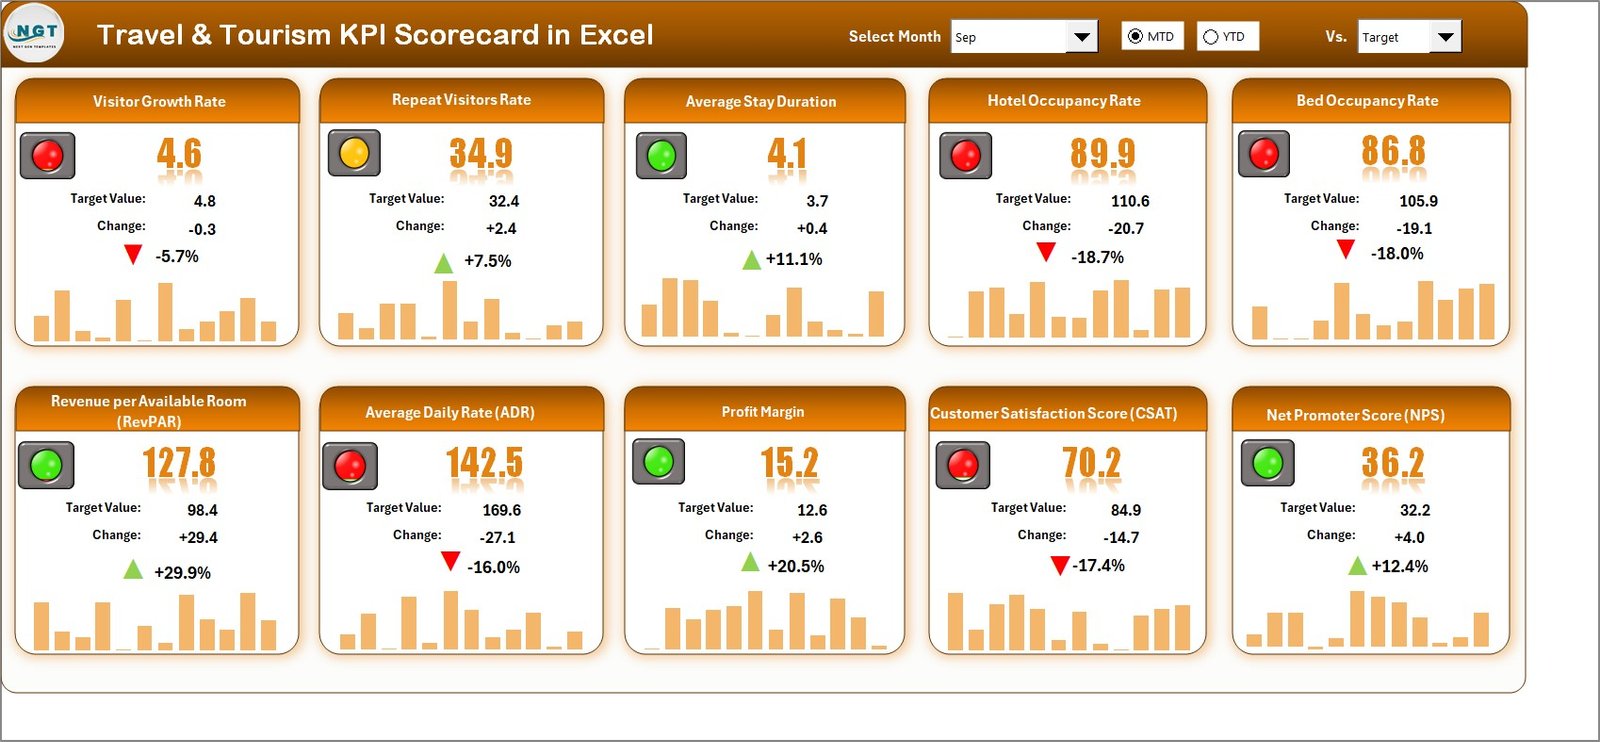
Scorecard Sheet (Main Dashboard)
The Scorecard Sheet is the heart of the dashboard. It provides a complete performance overview at a glance.
Key Highlights:
- Dropdown Menus: Select a month, MTD, or YTD for flexible analysis.
- Actual vs Target Comparison: Instantly view where your KPIs stand.
- Visual Indicators: Color-coded icons (green, yellow, red) show progress levels.
- Comprehensive KPI Display: View all 10 KPIs in a single, easy-to-read layout.
- Interactive and Real-Time: Data automatically updates when new inputs are entered.
This sheet acts as the control panel for performance monitoring. Decision-makers can quickly evaluate how each department—like bookings, hotel stays, customer service, or tours—is performing.
Click to buy Travel & Tourism KPI Scorecard in Excel
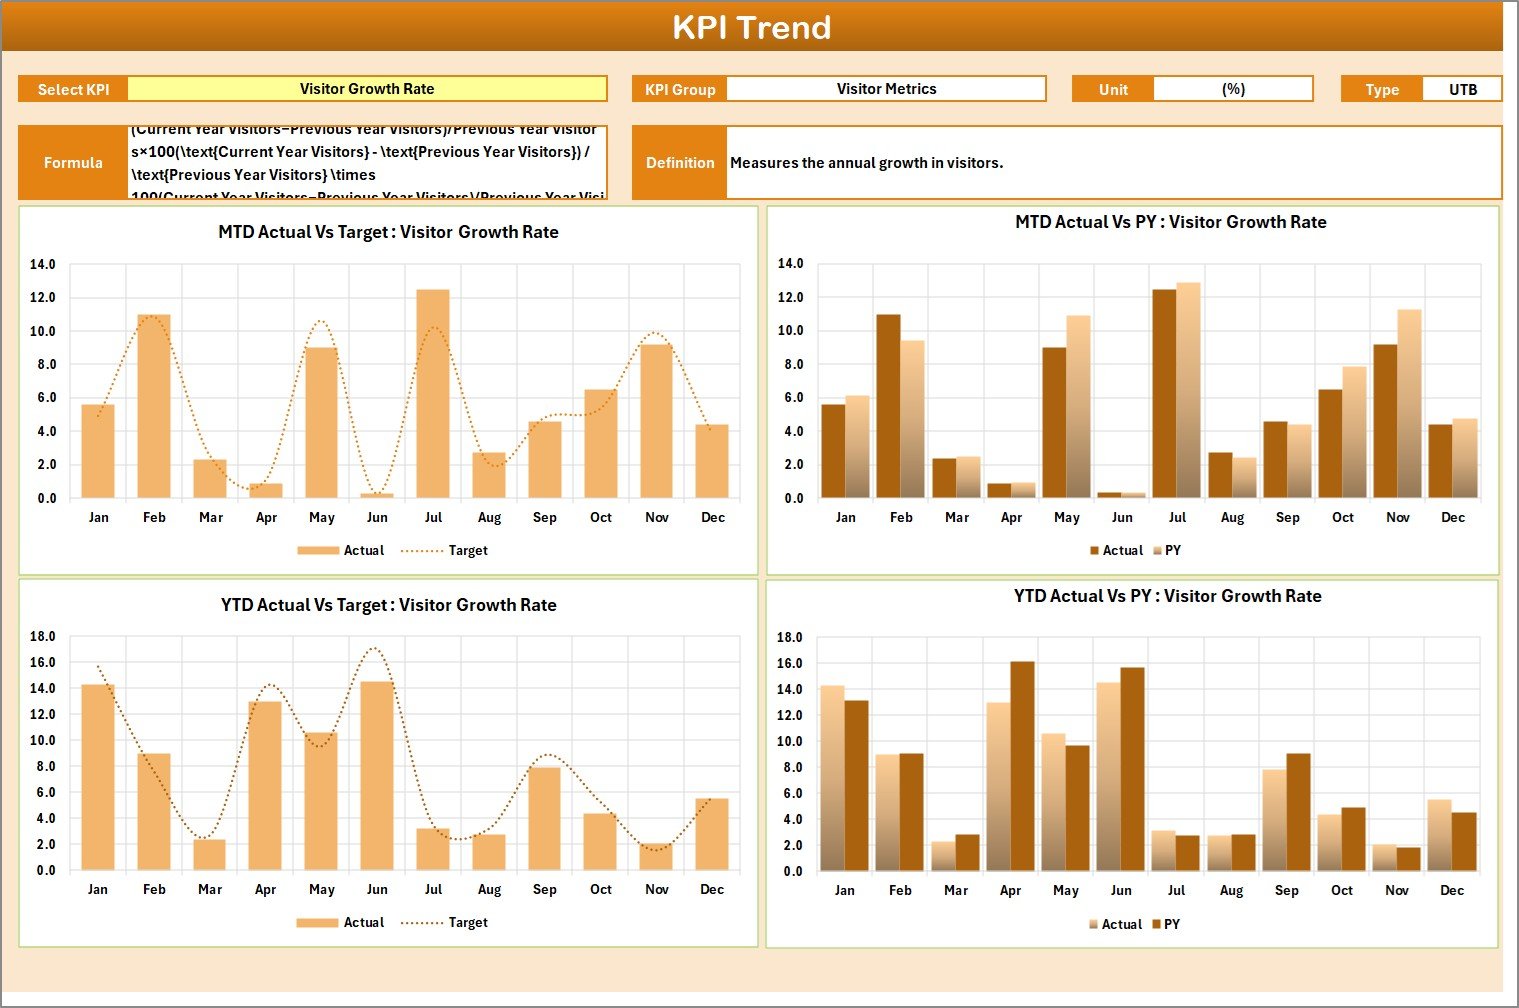
KPI Trend Sheet
The KPI Trend Sheet allows deeper analysis over time.
Features:
- Drop-down selection (cell C3) to choose any KPI.
- Displays KPI details such as Group, Unit, Formula, and Type (Lower-the-Better or Upper-the-Better).
- Trend charts for MTD and YTD—covering Actual, Target, and Previous Year.
- Visual comparison of how each KPI evolves month after month.
This helps tourism professionals spot seasonal patterns—for example, identifying months with high occupancy or low conversion rates—and adjust marketing or pricing strategies accordingly.
Click to buy Travel & Tourism KPI Scorecard in Excel
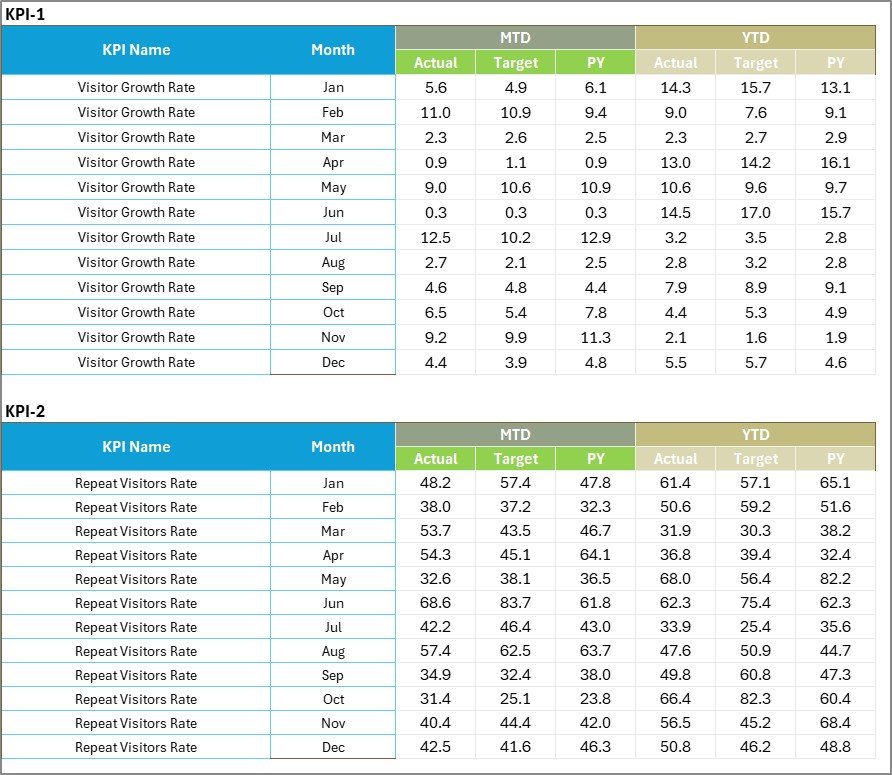
Input Data Sheet
This sheet is where you record all your KPI data. It forms the backbone of the scorecard.
How It Works:
- Enter monthly Actuals, Targets, and Previous Year values.
- Update the data regularly as new results become available.
- The sheet automatically feeds data into the dashboard and charts.
Benefits:
- Simple and editable structure.
- Easy to customize for your organization’s specific metrics.
- Reduces manual effort by linking directly to other sheets.
By keeping the input sheet organized, you ensure that all performance visuals stay accurate and up to date.
Click to buy Travel & Tourism KPI Scorecard in Excel
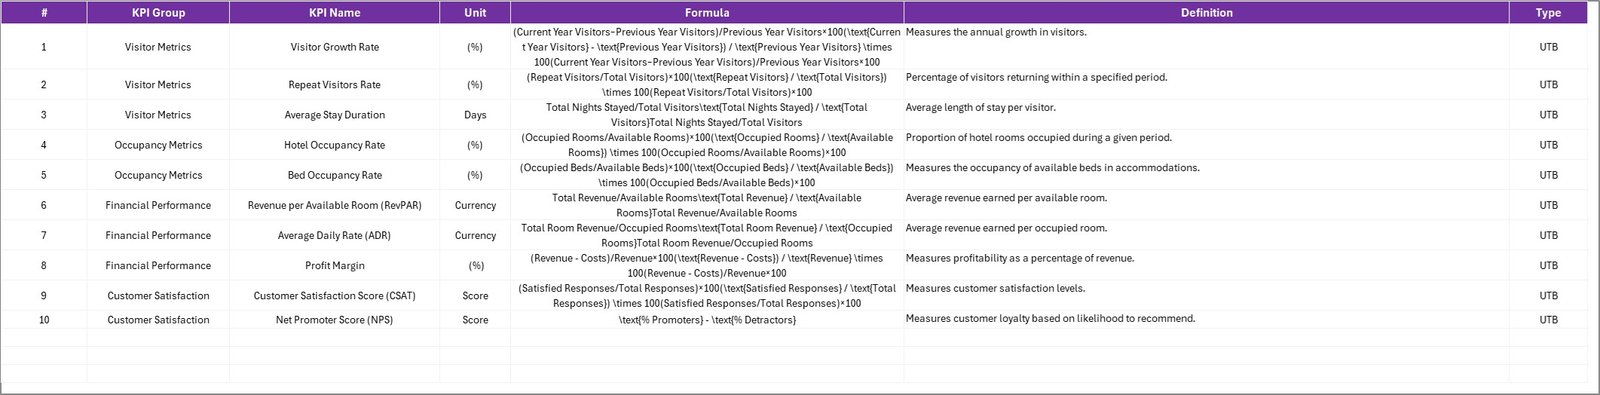
KPI Definition Sheet
The KPI Definition Sheet serves as your reference library.
It includes:
- KPI Name
- KPI Group (e.g., Sales, Operations, Customer Service)
- Unit (e.g., %, USD, Number)
- Formula used for calculation
- Definition of each KPI
This sheet ensures every team member understands what each KPI represents, minimizing confusion and ensuring consistent reporting standards across departments.
Click to buy Travel & Tourism KPI Scorecard in Excel
Important KPIs for Travel & Tourism Businesses
A well-structured KPI scorecard includes performance metrics across multiple areas. Below are examples of key indicators typically tracked using this Excel tool:
Sales and Revenue KPIs
- Total Bookings: Tracks total confirmed travel bookings per month.
- Revenue per Available Room (RevPAR): Measures income generated per available hotel room.
- Average Daily Rate (ADR): Reflects the average price paid per room.
- Gross Margin %: Monitors profitability levels.
Customer Experience KPIs
- Customer Satisfaction Score (CSAT): Evaluates guest feedback and service quality.
- Repeat Booking Rate: Tracks customer loyalty and retention.
- Complaint Resolution Rate: Measures responsiveness to customer issues.
Operational KPIs
- Occupancy Rate %: Shows room utilization efficiency.
- Tour Completion Rate: Monitors execution success of scheduled tours.
- Cost per Booking: Indicates operational cost effectiveness.
Digital and Marketing KPIs
- Online Conversion Rate: Tracks how many website visitors convert into bookings.
- Marketing ROI: Measures the return on investment from advertising campaigns.
- Social Media Engagement: Reflects brand awareness and digital reach.
Advantages of Using a Travel & Tourism KPI Scorecard in Excel
Implementing this Excel template brings multiple benefits across different functional areas:
- Centralized Performance View
The scorecard consolidates data from all departments into one view, saving time spent switching between reports.
- Improved Accuracy and Consistency
Automated formulas and linked sheets minimize manual errors while ensuring consistent reporting.
- Visual Insights for Faster Decisions
Charts, color codes, and indicators make complex data easy to understand at a glance.
- Real-Time Monitoring
Instant updates allow you to track performance as soon as data changes.
- Cost-Effective Solution
Unlike expensive software tools, Excel offers a free and familiar platform accessible to everyone.
- Scalability and Flexibility
You can add new KPIs, modify formulas, or tailor sheets to fit business needs without technical expertise.
How to Use the Travel & Tourism KPI Scorecard
Using this scorecard is simple and effective. Follow these steps:
- Enter KPI Data: Record your actual and target values in the Input Data Sheet.
- Verify KPI Definitions: Ensure formulas and definitions are correct in the KPI Definition Sheet.
- View Performance: Open the Scorecard Sheet to see MTD and YTD comparisons.
- Analyze Trends: Use the KPI Trend Sheet to visualize performance patterns.
- Take Action: Identify underperforming KPIs and adjust strategies accordingly.
This workflow helps maintain operational transparency while ensuring your management team always works with current and accurate data.
Best Practices for the Travel & Tourism KPI Scorecard
Following best practices ensures your scorecard remains efficient and insightful.
- Define Clear KPIs
Choose measurable indicators aligned with business goals. Avoid tracking too many metrics at once.
- Set Realistic Targets
Base your monthly and yearly targets on historical performance or industry benchmarks.
- Maintain Data Discipline
Update the Input Data Sheet regularly—preferably monthly or weekly—to keep the dashboard relevant.
- Use Visuals Wisely
Rely on conditional formatting and charts to simplify data interpretation without overwhelming the viewer.
- Encourage Departmental Collaboration
Involve managers from sales, marketing, and operations when reviewing KPIs to gain a holistic view of performance.
- Review Trends Over Time
Analyze MTD and YTD charts periodically to detect long-term progress or seasonal dips.
- Automate Where Possible
Leverage Excel formulas and pivot tables to automate calculations and minimize manual errors.
Use Cases of the Travel & Tourism KPI Scorecard
This Excel scorecard fits a wide range of applications across the travel industry.
- Travel Agencies: Track bookings, cancellations, and profit per customer.
- Hotels and Resorts: Monitor occupancy rate, average room rate, and guest satisfaction.
- Tour Operators: Evaluate tour performance, cost control, and customer feedback.
- Airlines and Transport Services: Measure seat occupancy, route profitability, and delay frequency.
- Destination Management Companies: Track marketing success, visitor count, and partner performance.
Whether you manage a small travel firm or a large chain, this scorecard adapts easily to your organization’s structure.
Tips for Maximizing the Scorecard’s Impact
- Customize KPIs: Tailor them to your specific service type—adventure tourism, business travel, luxury hospitality, etc.
- Visual Storytelling: Present the dashboard in meetings to communicate insights clearly.
- Data Validation: Add drop-down lists and formula protections to ensure clean data entry.
- Historical Tracking: Keep a record of previous years to assess long-term performance.
- Integration: Combine with Power BI or Google Data Studio for enhanced visualization if required.
Conclusion
The Travel & Tourism KPI Scorecard in Excel is a simple yet powerful performance management tool. It empowers travel professionals to transform everyday data into actionable insights. Whether you’re a travel agent, hotel manager, or tourism consultant, this dashboard helps you stay ahead of the curve by continuously monitoring key metrics.
By following the best practices shared in this article, you can ensure your organization makes informed decisions, optimizes operations, and delivers unforgettable travel experiences backed by reliable data.
Frequently Asked Questions (FAQs)
- What is the purpose of a Travel & Tourism KPI Scorecard?
It helps organizations track essential metrics like bookings, revenue, occupancy, and customer satisfaction, providing clarity on performance and growth opportunities.
- Can I customize the KPIs in this Excel scorecard?
Yes. You can easily edit, add, or remove KPIs according to your business needs. The structure is flexible and adaptable.
- Do I need advanced Excel skills to use this template?
No. The scorecard is built with simple formulas and drop-down selections. Anyone with basic Excel knowledge can use it effectively.
- How often should I update the KPI data?
Updating it monthly is ideal. However, for dynamic operations like travel agencies, weekly updates can offer more accurate tracking.
- Can I use this scorecard for multiple branches or locations?
Absolutely. You can duplicate the sheets for each branch or consolidate all location data in one central dashboard.
- What makes Excel a better choice for KPI scorecards?
Excel offers flexibility, low cost, and ease of customization compared to complex data platforms, making it ideal for small and mid-sized tourism businesses.
- Can I connect this scorecard with Power BI or other tools?
Yes. You can export the data from Excel into Power BI, Tableau, or Google Data Studio for advanced analytics.
- Does this scorecard include visual charts?
Yes. The Scorecard and Trend sheets include dynamic charts and color-coded visuals to represent KPI progress intuitively.
- Who can benefit from this tool?
Travel agencies, hotels, resorts, airlines, tour operators, and tourism boards can all leverage this scorecard to measure and improve their performance.
- Where can I download the Travel & Tourism KPI Scorecard in Excel?
You can download it from NextGenTemplates.com and start tracking your tourism KPIs instantly.
Visit our YouTube channel to learn step-by-step video tutorials
Watch the step-by-step video tutorial:
Click to buy Travel & Tourism KPI Scorecard in Excel