Managing a warehouse becomes easier when you track the right performance indicators and visualize them in a simple, organized dashboard. However, many teams still rely on scattered spreadsheets and manual reports that slow down decisions. Because of this, operations suffer delays, stock issues increase, and productivity drops.
A Warehousing KPI Dashboard in Excel solves all these problems. It organizes all important warehouse KPIs into one clear, interactive, and easy-to-use dashboard. From inventory accuracy to picking efficiency and on-time shipments, you can track everything in one place. Since the dashboard runs in Excel, warehouse teams can use it without learning any complex software.
In this detailed article, you will learn what the dashboard is, how it works, its components, its advantages, and its best practices. You will also get answers to the most common questions that users ask.
Click to buy Warehousing KPI Dashboard in Excel
What Is a Warehousing KPI Dashboard in Excel?
A Warehousing KPI Dashboard in Excel is a ready-to-use performance monitoring tool that helps warehouse teams track their operational efficiency. It collects all warehouse KPIs in a single file and displays their Month-to-Date (MTD) and Year-to-Date (YTD) performance. You can also compare actual numbers with targets and previous year values to understand the overall progress.
Since it is built in Excel, users can manage data easily, update KPIs quickly, and generate reports instantly. You don’t need advanced tools or coding; you simply enter your data into a structured format and the dashboard updates everything automatically.
The dashboard covers the most important areas of warehousing operations, such as:
- Inventory management
- Order fulfillment
- Receiving operations
- Storage efficiency
- Picking and packing performance
- Shipment accuracy
- Workforce productivity
With this dashboard, warehouse managers gain full visibility into their daily, monthly, and annual performance.
Why Do Warehousing KPIs Matter?
Tracking KPIs is essential for warehouse operations because it helps teams improve accuracy, reduce delays, and increase productivity. Warehousing processes involve multiple activities, and even small mistakes can affect the entire supply chain.
Here are the reasons why warehouse KPIs are important:
- KPIs help teams measure productivity.
- They identify bottlenecks before they turn into bigger issues.
- They guide planning, staffing, and scheduling decisions.
- They show whether the team is meeting service levels.
- They help teams reduce costs and improve efficiency.
- They support long-term strategic decision-making.
When you use a dashboard for these KPIs, you receive quick insights without spending time on manual review. This is why a Warehousing KPI Dashboard in Excel becomes an essential tool for modern warehouse management.
Key Features of the Warehousing KPI Dashboard in Excel
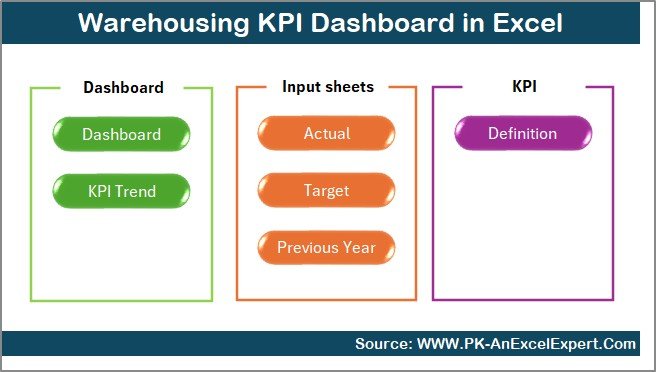
This dashboard is designed with simplicity and performance in mind. It includes seven well-structured worksheets, each serving a specific purpose. These worksheets work together to give the user a complete view of warehouse performance.
Let’s explore each worksheet in detail.
Summary Page: Your Navigation Control Panel
The Summary Page acts as an index sheet. It contains six smart buttons that let you jump to any worksheet instantly. Instead of scrolling through tabs, you can click a button and reach the exact section you need. This saves time and helps you move through the dashboard smoothly.
The Summary Page also gives a quick overview of the dashboard structure, so new users can understand it immediately.
Click to buy Warehousing KPI Dashboard in Excel
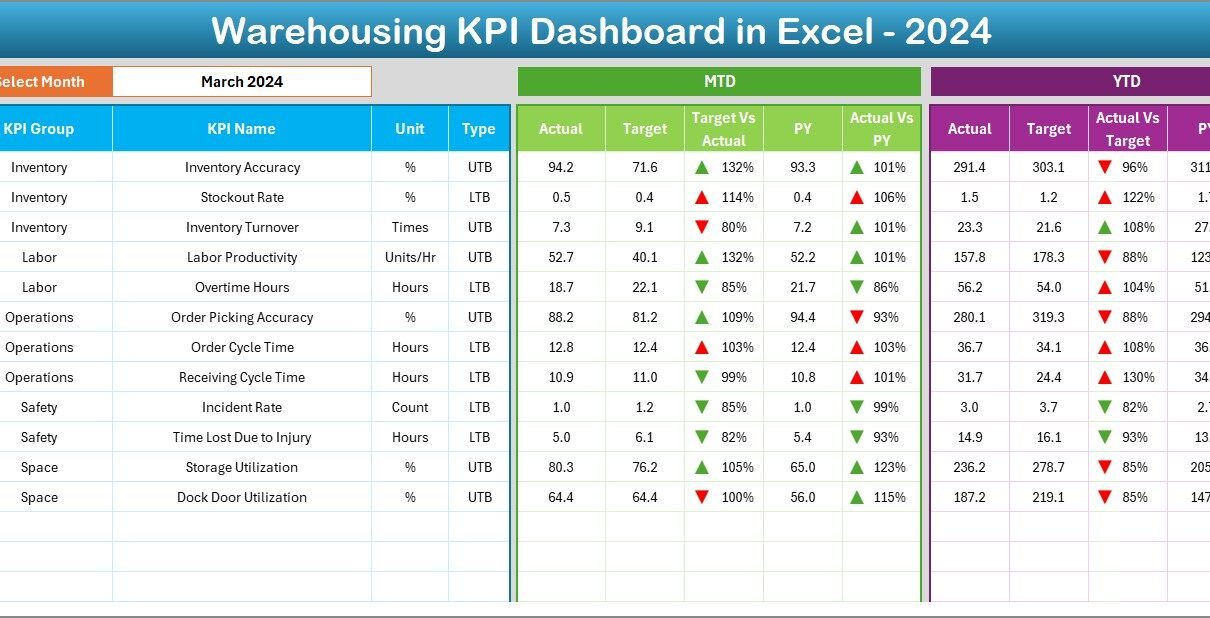
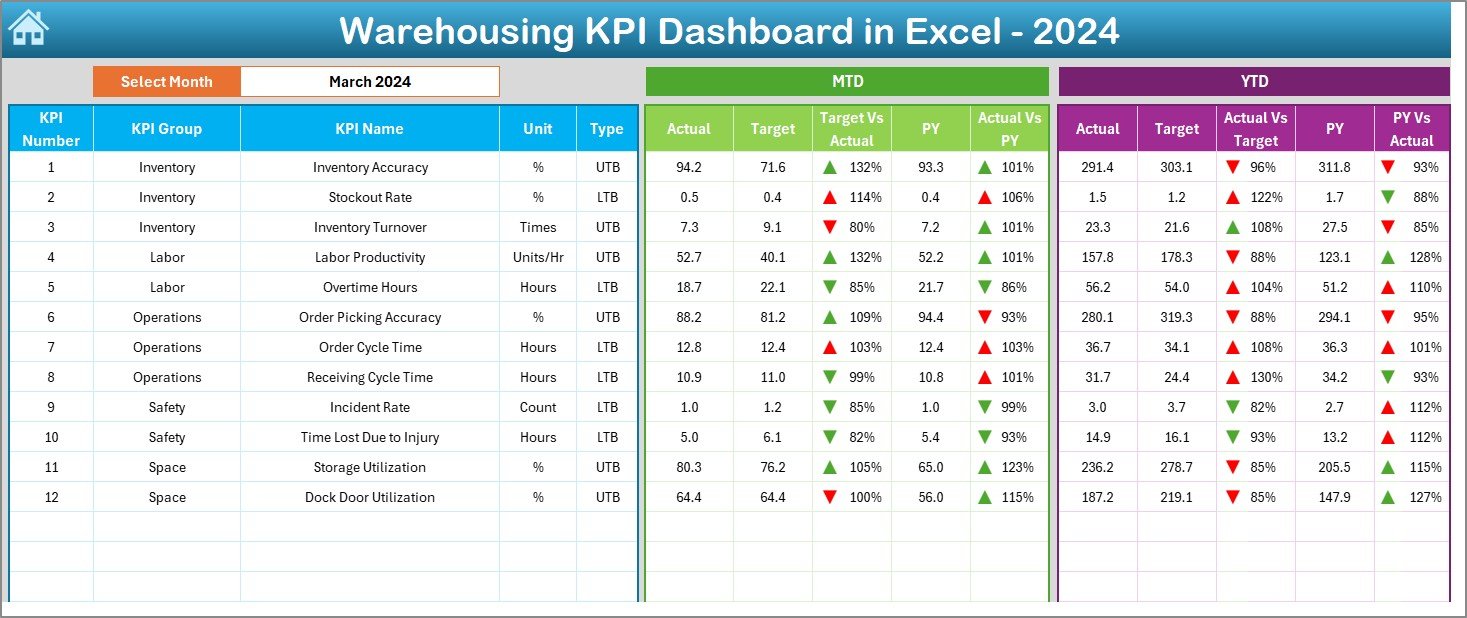
Dashboard Sheet: The Main Performance View
The Dashboard sheet is the core of the entire file. This is where warehouse teams spend most of their time.
You can select any month from the drop-down located in cell D3. As soon as you change the month, all KPI values update automatically. This makes tracking monthly performance extremely easy.
The Dashboard sheet shows:
- MTD Actual
- MTD Target
- MTD Previous Year (PY)
- Target vs Actual comparison
- PY vs Actual comparison
- YTD Actual
- YTD Target
- YTD Previous Year
- Target vs Actual (YTD)
- PY vs Actual (YTD)
All comparisons include color-coded arrows to show improvement or decline. This helps users identify trends at a glance.
Click to buy Warehousing KPI Dashboard in Excel
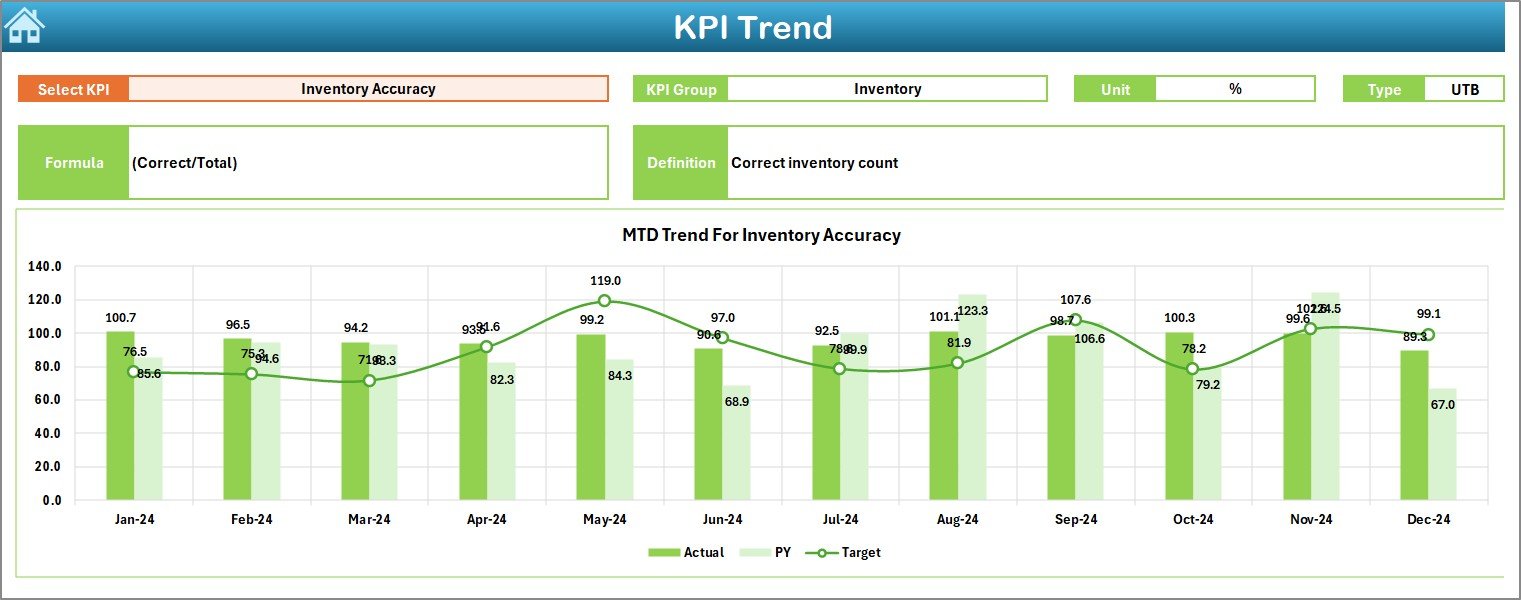
Trend Sheet: Visualizing KPI Performance Over Time
The Trend sheet helps you see how a KPI behaves over months. You can select the KPI name from the drop-down in cell C3.
Once selected, the sheet displays:
- KPI Group
- Unit
- KPI Type (Lower the Better or Upper the Better)
- Formula
- Definition
- MTD trend chart (Actual, Target, PY)
- YTD trend chart (Actual, Target, PY)
This visual approach helps teams detect seasonal patterns, performance improvements, and areas where they need to focus.
Click to buy Warehousing KPI Dashboard in Excel
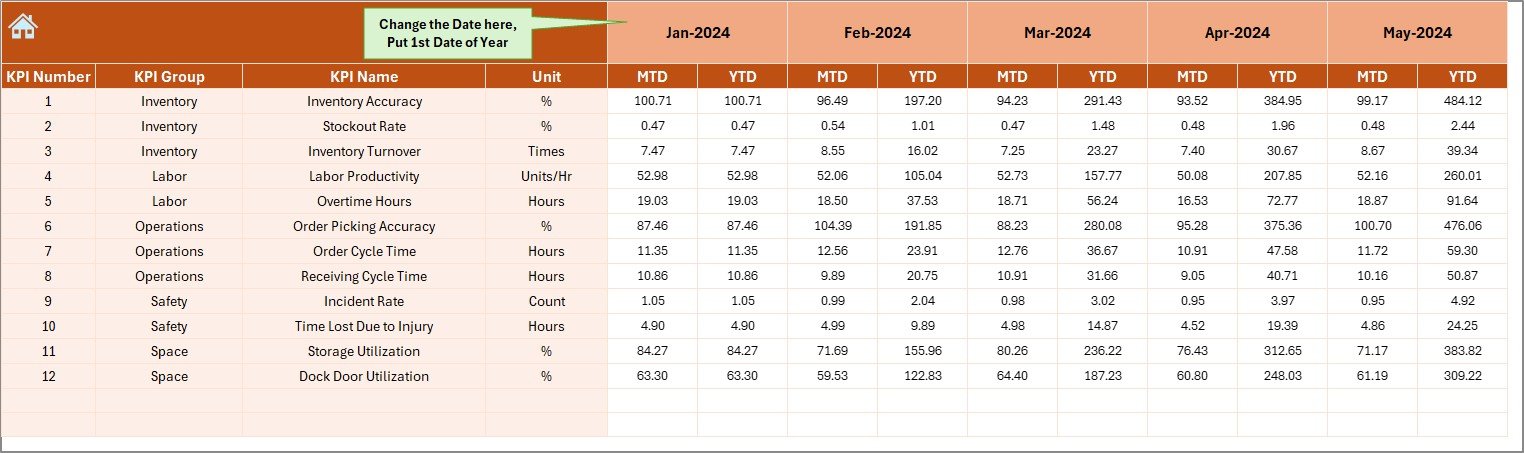
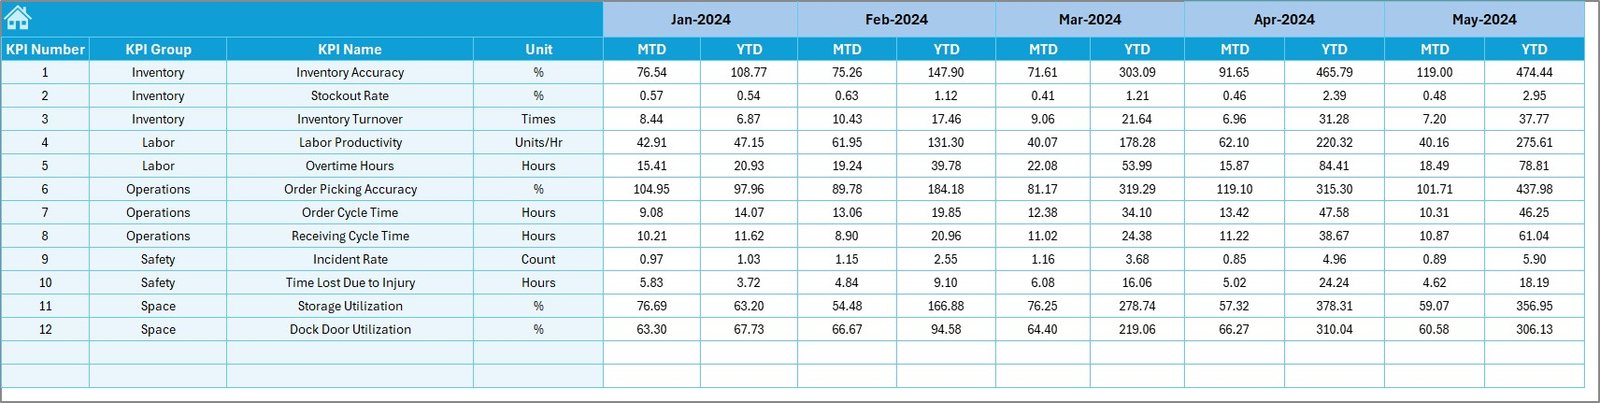
Actual Numbers Input Sheet: Entering Current Year Data
This sheet is used to input MTD and YTD actual values. You can set the starting month in cell E1. Once updated, the dashboard adjusts according to the financial or operational year.
The sheet ensures:
- Data remains consistent
- Monthly updates happen quickly
- Reports stay accurate
Teams only need to enter values once every month.
Click to buy Warehousing KPI Dashboard in Excel
Target Sheet: Setting Monthly KPI Targets
This worksheet is where monthly targets for each KPI are entered. You can add both MTD and YTD numbers.
This sheet helps teams:
- Set clear goals
- Compare performance against expected levels
- Stay aligned with business objectives
Targets guide warehouse staff and motivate them to achieve operational benchmarks.
Click to buy Warehousing KPI Dashboard in Excel
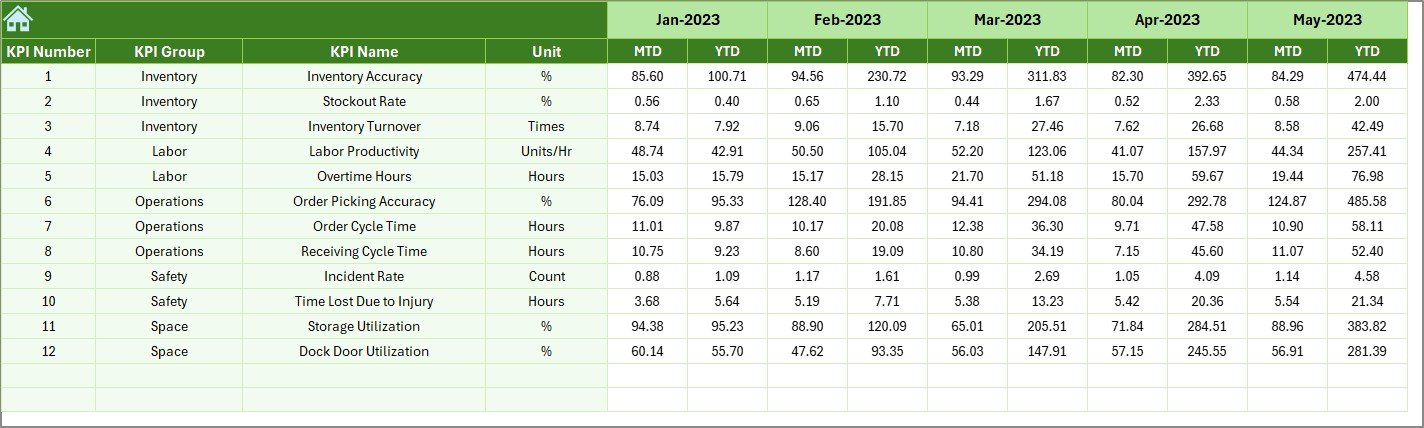
Previous Year Numbers Sheet: Comparing Past Performance
This sheet stores previous year values for every KPI. It mirrors the structure of the Actual Numbers sheet.
With this data, the dashboard can:
- Compare current year performance vs last year
- Show improvement trends
- Highlight areas needing attention
Year-over-year comparison is crucial for long-term operational growth.
Click to buy Warehousing KPI Dashboard in Excel
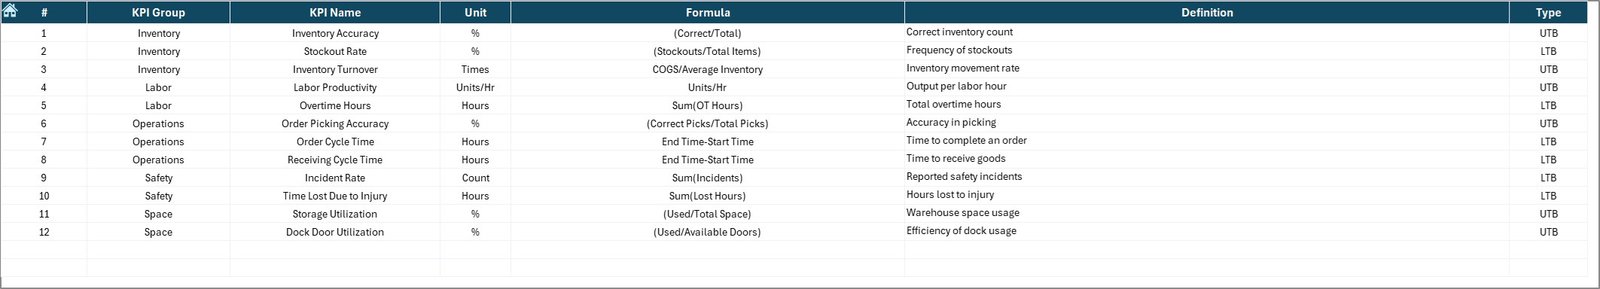
KPI Definition Sheet: Understanding Each KPI Clearly
This sheet contains the complete list of KPIs with:
- KPI Name
- KPI Group
- Unit
- Formula
- Definition
- Type (LTB or UTB)
This sheet keeps the dashboard easy to understand for new users. It ensures everyone interprets KPIs the same way.
Click to buy Warehousing KPI Dashboard in Excel
Why Should You Use a Warehousing KPI Dashboard in Excel?
Warehouse operations include many processes happening at the same time. Without a dashboard, managers struggle to track performance correctly. A KPI dashboard improves accuracy and helps teams make quick and confident decisions.
Here’s why you should use one:
- It offers real-time visibility.
- It reduces manual reporting work.
- It increases productivity and accuracy.
- It supports data-driven decisions.
- It keeps warehouse KPIs organized.
- It highlights gaps and opportunities.
A dashboard builds a strong foundation for operational excellence.
Top KPIs You Should Track in a Warehouse
Although the dashboard can include many KPIs, here are the most important ones often used in warehouse operations:
- Inventory accuracy
- Picking accuracy
- Order fulfillment cycle time
- On-time shipping rate
- Dock-to-stock cycle time
- Put-away accuracy
- Storage utilization
- Order picking time
- Damage rate
- Receiving efficiency
- Labor productivity
- Shipment accuracy
Tracking these metrics helps improve operations and reduce costs.
Advantages of a Warehousing KPI Dashboard in Excel
A well-designed dashboard offers many benefits. Here are the most important advantages:
- Better Visibility of Warehouse Operations
You see all important KPIs in one place, which helps you understand what is working well and what needs improvement.
- Faster and Smarter Decisions
Since the dashboard updates automatically, managers can make decisions without waiting for manual reports.
- Improved Productivity
You understand how well the team performs and can take steps to improve speed and accuracy.
- Reduced Errors and Delays
Tracking KPIs helps teams avoid mistakes that lead to shipment delays or stock problems.
- Easy to Use and Customize
Since the dashboard runs in Excel, anyone with basic Excel skills can use it.
- Year-to-Year Comparison
You can check whether performance improves compared to last year.
- Supports Continuous Improvement
With trend charts and comparisons, teams can monitor progress regularly.
Best Practices for the Warehousing KPI Dashboard in Excel
Follow these practices to get the most value from your dashboard:
- Update Data at the Start of Every Month
This ensures that MTD and YTD numbers stay accurate.
- Keep KPI Definitions Clear and Simple
Everyone in the team should understand what each KPI means and how it is calculated.
- Use Target Values Consistently
Targets help track progress effectively.
- Review Trend Charts Monthly
Trends highlight slowdowns or improvements early.
- Train Your Team to Read the Dashboard
Once the team understands the indicators, they can work toward improving them.
- Maintain Clean and Organized Data
Avoid mixing formats, text, or incorrect values.
- Use Conditional Formatting Wisely
Color coding helps understand the dashboard at a glance.
- Expand Your KPIs as the Warehouse Grows
As operations evolve, include new KPIs to track new challenges.
Conclusion
A Warehousing KPI Dashboard in Excel gives warehouse teams a simple but powerful way to track performance. It combines monthly updates, yearly comparison, trend charts, and clear KPI definitions to help managers improve operations. With the dashboard, you can analyze picking accuracy, order fulfillment time, inventory accuracy, shipment performance, and many other important metrics.
When warehouse teams track KPIs consistently, they make better decisions, reduce errors, improve service levels, and build a strong foundation for operational excellence.
Frequently Asked Questions (FAQs)
- What are the most important KPIs in warehouse management?
The most important KPIs include inventory accuracy, picking accuracy, on-time shipments, receiving efficiency, and storage utilization.
- Can beginners use a Warehousing KPI Dashboard in Excel?
Yes, the dashboard is designed for all skill levels. You only need basic Excel skills to update numbers and read results.
- How often should I update the dashboard?
You should update it monthly to keep MTD and YTD values accurate.
- Do I need special software to use the dashboard?
No, the entire dashboard works in Microsoft Excel.
- Can I add more KPIs to the dashboard?
Yes, you can expand the KPI Definition sheet and update the data structure if your warehouse grows.
- What is the benefit of tracking Previous Year values?
It helps you compare performance and see if your warehouse is improving over time.
Visit our YouTube channel to learn step-by-step video tutorials
Watch the step-by-step video tutorial:
Click to buy Warehousing KPI Dashboard in Excel