In today’s environmentally conscious world, effective waste management plays a crucial role in corporate sustainability and operational efficiency. Whether you run a manufacturing unit, a healthcare facility, or a municipal department, managing waste efficiently not only reduces costs but also helps meet compliance and sustainability goals.
The Waste Management KPI Scorecard in Excel is a powerful, ready-to-use analytical tool designed to simplify waste tracking, visualize performance metrics, and ensure data-driven decisions. Built in Microsoft Excel, it provides a structured and interactive way to monitor all critical waste management indicators—right from waste generation and recycling rate to cost efficiency and landfill diversion.
This article explores every aspect of this scorecard, including its structure, advantages, best practices, and FAQs to help you make the most of it.
Click to buy Waste Management KPI Scorecard in Excel
What Is a Waste Management KPI Scorecard in Excel?
A Waste Management KPI Scorecard is a data-driven dashboard that consolidates all waste-related performance indicators into one central platform. Using Excel’s powerful data analysis tools, the scorecard helps waste management teams and sustainability officers track actual performance against targets, analyze month-over-month trends, and identify opportunities for improvement.
Instead of manually preparing multiple reports, this scorecard offers automated calculations, visual insights, and instant performance comparisons. It enables organizations to monitor metrics such as waste generated, waste recycled, energy recovered, and overall efficiency—all in a visually rich, easy-to-navigate Excel interface.
Structure of the Waste Management KPI Scorecard
The template is organized into four key worksheets, each serving a unique purpose to make data tracking and analysis effortless.
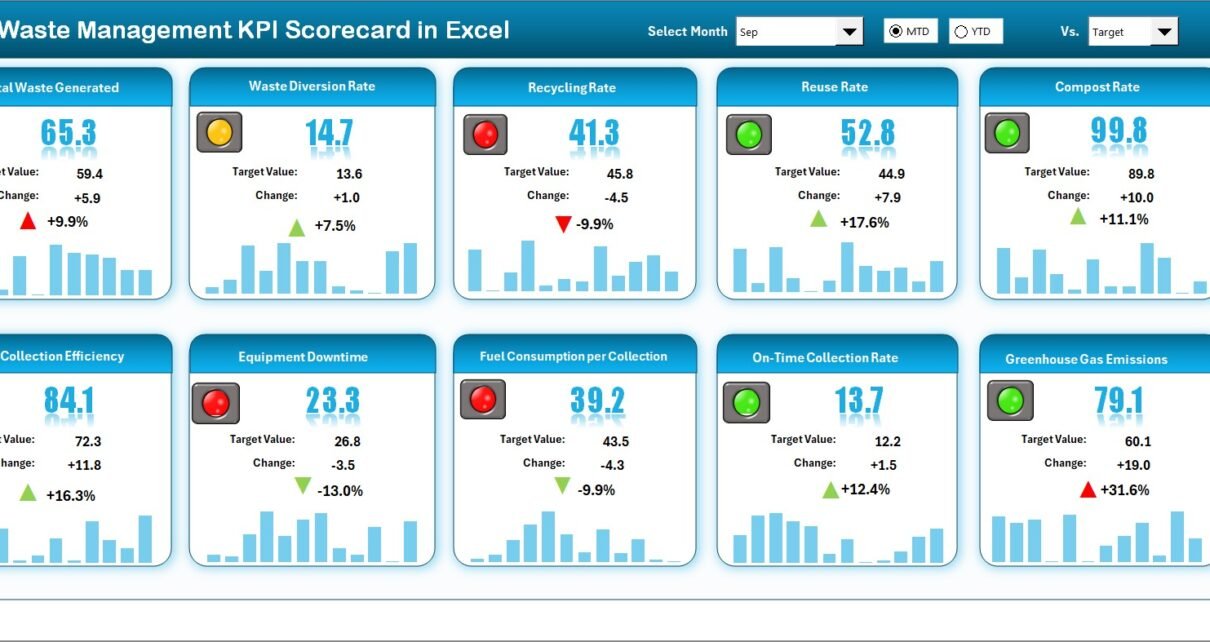
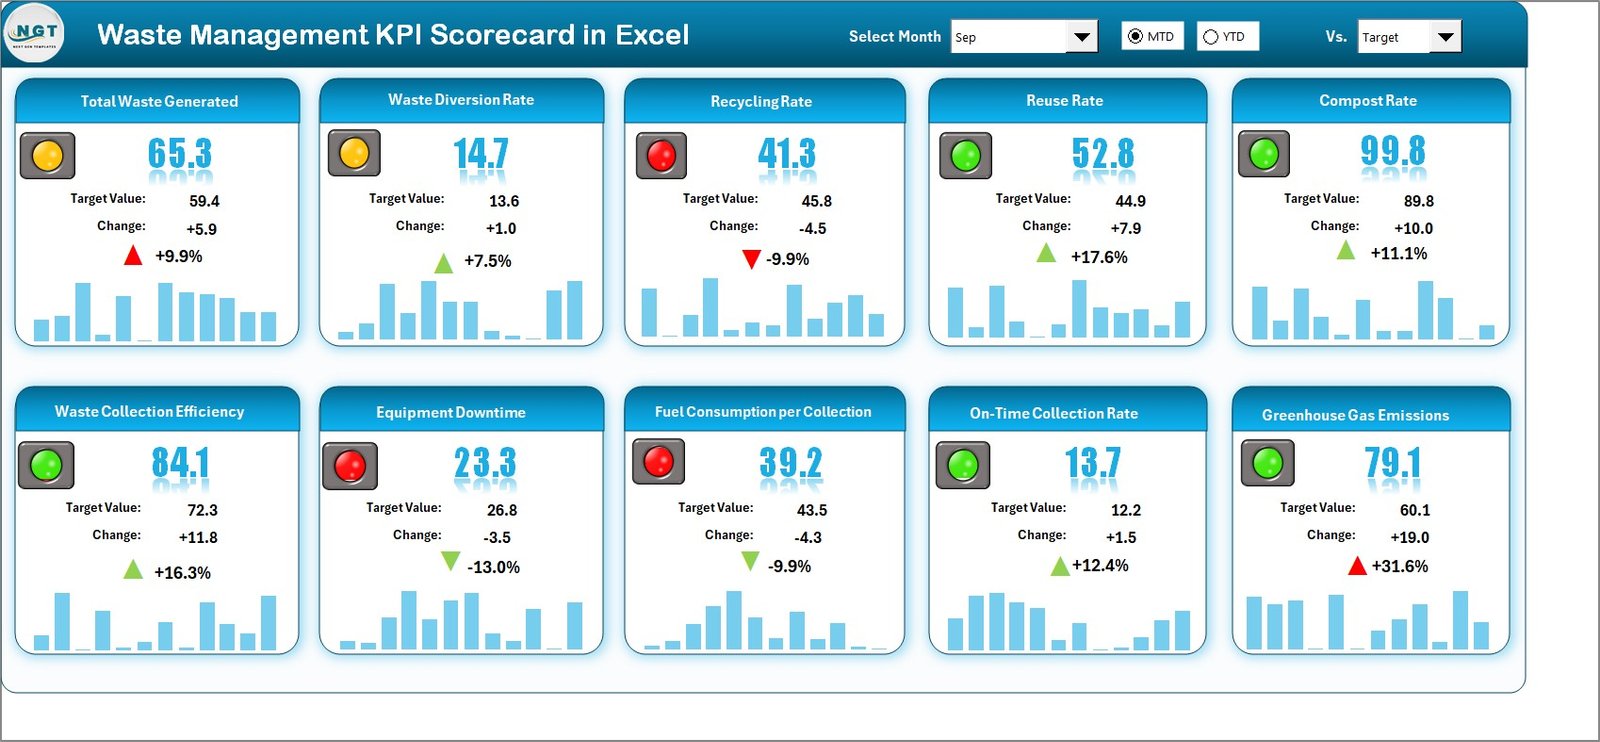
Scorecard Sheet – The Main Dashboard
This is the central hub of the scorecard where you can monitor the overall performance of your waste management KPIs.
Key Features:
- Dropdown Menus: Select Month, MTD (Month-to-Date), or YTD (Year-to-Date) to filter data dynamically.
- Actual vs Target Comparison: Quickly see whether performance goals are being achieved or missed.
- Color-Coded Indicators: Visual cues (like green for “On Target” and red for “Below Target”) make it easy to assess performance at a glance.
- Comprehensive KPI Overview: View all 10 KPIs in one place with updated performance metrics.
This sheet gives management a clear overview of operational performance and environmental impact, enabling faster and more informed decisions.
Click to buy Waste Management KPI Scorecard in Excel
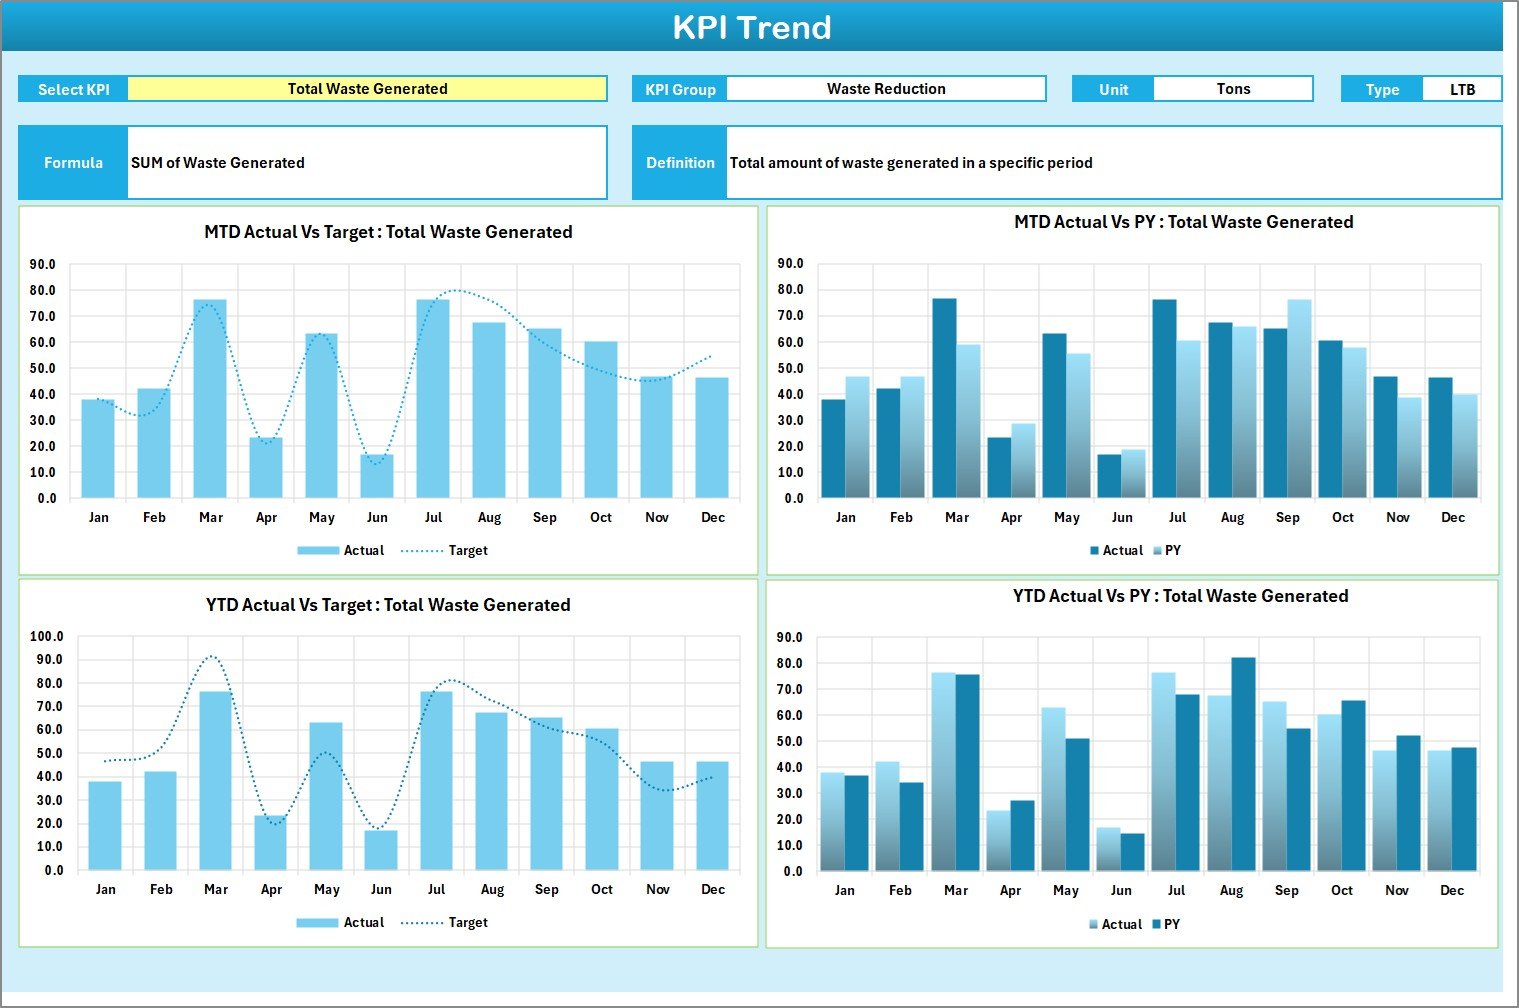
KPI Trend Sheet – Performance Over Time
The KPI Trend Sheet focuses on the progressive behavior of each KPI. Users can select a KPI from a dropdown (cell C3) to view its detailed metrics.
What You’ll Find Here:
- KPI Metadata: Displays KPI Group, Unit, Formula, and Type (Upper the Better or Lower the Better).
- Trend Charts: Visualize MTD and YTD trends for Actual, Target, and Previous Year values.
- Comparative View: Easily identify seasonal patterns or anomalies in waste generation and recycling performance.
This sheet helps sustainability officers understand long-term patterns and make strategic adjustments.
Click to buy Waste Management KPI Scorecard in Excel
Input Data Sheet – The Foundation of the Scorecard
All KPI values originate from this worksheet. It is the data input and maintenance area of the tool.
Features:
- Simple Data Entry: Record monthly or weekly actuals and targets for each KPI.
- Dynamic Updates: Automatically refreshes charts and scorecards when new data is entered.
- Flexible Format: Suitable for different frequencies (daily, weekly, monthly).
The Input Data sheet ensures accuracy, flexibility, and traceability in reporting.
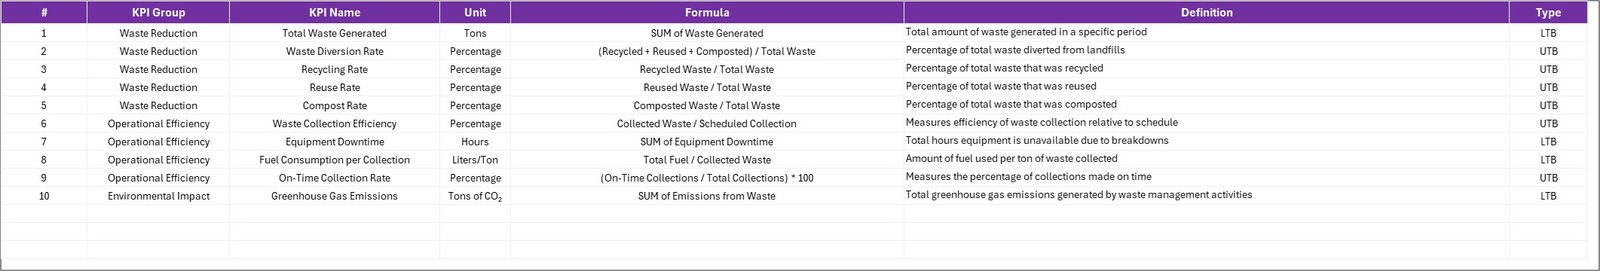
KPI Definition Sheet – The Knowledge Base
This tab contains the core definitions and formulas behind each KPI, ensuring standardization across the organization.
What to Include:
- KPI Name
- KPI Group
- Unit of Measurement
- Formula Used
- Definition or Description
This section enhances clarity and transparency, ensuring all stakeholders interpret KPIs consistently.
Click to buy Waste Management KPI Scorecard in Excel
Advantages of Using a Waste Management KPI Scorecard in Excel
Implementing a structured Excel-based KPI scorecard provides a range of tangible benefits. Here are the most notable ones:
Promotes Sustainability Goals
The scorecard enables organizations to track waste reduction initiatives and align them with sustainability objectives like carbon neutrality or zero waste.
Simplifies Performance Tracking
With clear visuals and dynamic filters, managers can instantly compare Actual vs Target performance, identify gaps, and take corrective actions.
Saves Time and Reduces Manual Work
No more creating reports from scratch—data updates automatically flow into dashboards, saving hours of effort every month.
Improves Decision-Making
By visualizing KPIs like recycling rate and landfill diversion, decision-makers can identify inefficiencies and prioritize improvement areas.
Reduces Costs
Tracking waste disposal costs and recycling revenue together provides insights into cost optimization opportunities.
Ensures Accountability
Each KPI has clear ownership, formula, and definition—making performance transparent and traceable.
Encourages Continuous Improvement
Year-o-year and month-over-month comparisons help organizations benchmark progress and push for continuous improvements.
How to Use the Waste Management KPI Scorecard
Using this scorecard is straightforward, even for non-technical users. Follow these steps:
- Input Data: Record your monthly actual and target values in the Input Data sheet.
- Define KPIs: Enter KPI names, formulas, and units in the KPI Definition tab.
- View the Scorecard: Go to the Scorecard Sheet to see automatic performance updates.
- Analyze Trends: Use the KPI Trend Sheet to study progress and compare results.
- Take Action: Use the insights to set new goals or initiate improvement projects.
Best Practices for the Waste Management KPI Scorecard
To make the most of your scorecard, follow these best practices:
Keep KPI Definitions Clear
Use concise, measurable definitions for each KPI. Ambiguous or overlapping indicators create confusion.
Update Data Regularly
Maintain a consistent update cycle—monthly or quarterly—to ensure reports reflect real-time performance.
Use Conditional Formatting
Apply visual indicators like arrows or color scales for quick interpretation of results.
Involve All Stakeholders
Encourage sustainability teams, operations managers, and finance staff to collaborate on KPI inputs and analysis.
Automate Where Possible
Leverage Excel formulas, data validation, and pivot charts to minimize manual errors.
Compare Historical Data
Use the Previous Year (PY) comparison feature to track long-term progress and evaluate policy effectiveness.
Secure the Data
Protect your data sheets and formulas to prevent accidental edits or inconsistencies.
Align KPIs with ESG Goals
Ensure your KPIs reflect environmental, social, and governance (ESG) reporting frameworks.
Review KPIs Annually
Business priorities change—update KPI definitions periodically to stay relevant.
How the Scorecard Supports Strategic Decision-Making
The Waste Management KPI Scorecard in Excel is not just a reporting tool—it’s a strategic decision-support system. By combining visual insights with real-time data updates, it empowers organizations to:
- Identify underperforming areas (e.g., high landfill rates)
- Prioritize cost-saving initiatives
- Optimize recycling programs
- Demonstrate compliance with environmental regulations
- Track sustainability progress against corporate targets
In short, this tool bridges the gap between data collection and actionable sustainability insights.
Conclusion
The Waste Management KPI Scorecard in Excel is a simple yet powerful tool that helps businesses and organizations achieve operational efficiency and environmental responsibility. It transforms raw data into meaningful insights, promoting smarter decisions, accountability, and continuous improvement.
By integrating KPIs like recycling rate, landfill diversion, and disposal cost into a single dashboard, managers can monitor performance in real-time and align it with broader sustainability goals.
Whether you’re a sustainability officer, operations head, or data analyst, this scorecard can become your go-to solution for effective waste management performance tracking.
Frequently Asked Questions (FAQs)
- What is the purpose of a Waste Management KPI Scorecard?
It helps organizations track, analyze, and improve waste management performance by consolidating all relevant KPIs in one Excel-based dashboard.
- Can this scorecard be customized?
Yes, it’s fully editable. You can add new KPIs, modify formulas, or adjust visuals as per your organizational requirements.
- Who can use this scorecard?
Sustainability teams, environmental officers, manufacturing heads, and municipal authorities can all use it to monitor performance and improve efficiency.
- How often should data be updated?
Monthly updates are ideal, but you can also adapt the frequency to your reporting cycle (weekly or quarterly).
- What are the benefits of using Excel for KPI tracking?
Excel is accessible, affordable, and versatile—it allows dynamic filtering, chart creation, and easy data sharing without requiring specialized software.
- Can this scorecard integrate with other systems?
Yes, advanced users can connect it with external data sources or Power BI for automated reporting and visualization.
- What type of KPIs should be included?
KPIs should cover waste generation, recycling, disposal cost, landfill diversion, and energy recovery for a balanced view.
- Is prior Excel knowledge required to use it?
Basic Excel skills are sufficient since all formulas and dropdowns are pre-built and easy to use.
Visit our YouTube channel to learn step-by-step video tutorials
Watch the step-by-step video tutorial:
Click to buy Waste Management KPI Scorecard in Excel