Managing audit activities and internal control performance becomes easy when you track your KPIs in the right way. Every organization wants strong governance, timely audits, and smooth compliance. However, manual reports, scattered spreadsheets, and unclear metrics slow down decision-making. Because of this, many teams look for a smart and simple solution.
An Audit & Internal Controls KPI Dashboard in Excel solves this challenge. It keeps all your KPIs in one place and gives you a clear view of the performance. You understand what works, what needs attention, and where you must improve. This guide explains everything about the dashboard, its structure, benefits, and best practices.
Click to buy Audit & Internal Controls KPI Dashboard in Excel
What Is an Audit & Internal Controls KPI Dashboard in Excel?
An Audit & Internal Controls KPI Dashboard in Excel is a ready-to-use tool that tracks all key audit metrics in one clean and interactive view. It helps you monitor MTD (Month-to-Date) performance, YTD (Year-to-Date) results, previous year numbers, and the achievement against targets.
You can analyze audit cycle time, internal control checks, issue closure rates, compliance scores, and much more.
Since it runs in Excel, you update data quickly and see insights instantly. You make informed decisions faster and run audit operations more confidently.
What Are the Key Features of the Dashboard?
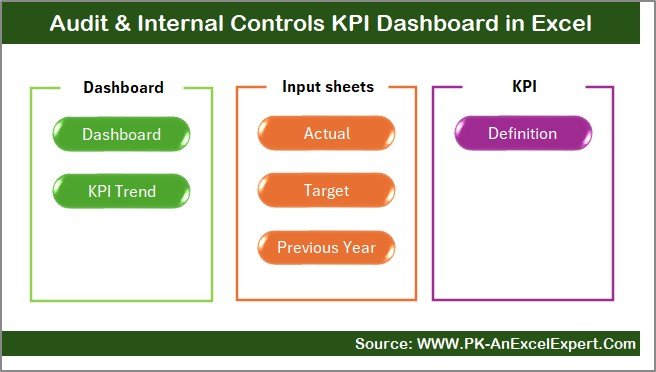
We included all important KPIs and analysis views so that users get a complete picture of audit and control performance. The dashboard contains 7 major worksheets, each serving a clear purpose.
Summary Page – What Does It Do?
The Summary Page works as an index. You get buttons to jump directly to any sheet.
It improves navigation and helps you find the right view instantly.
Click to buy Audit & Internal Controls KPI Dashboard in Excel
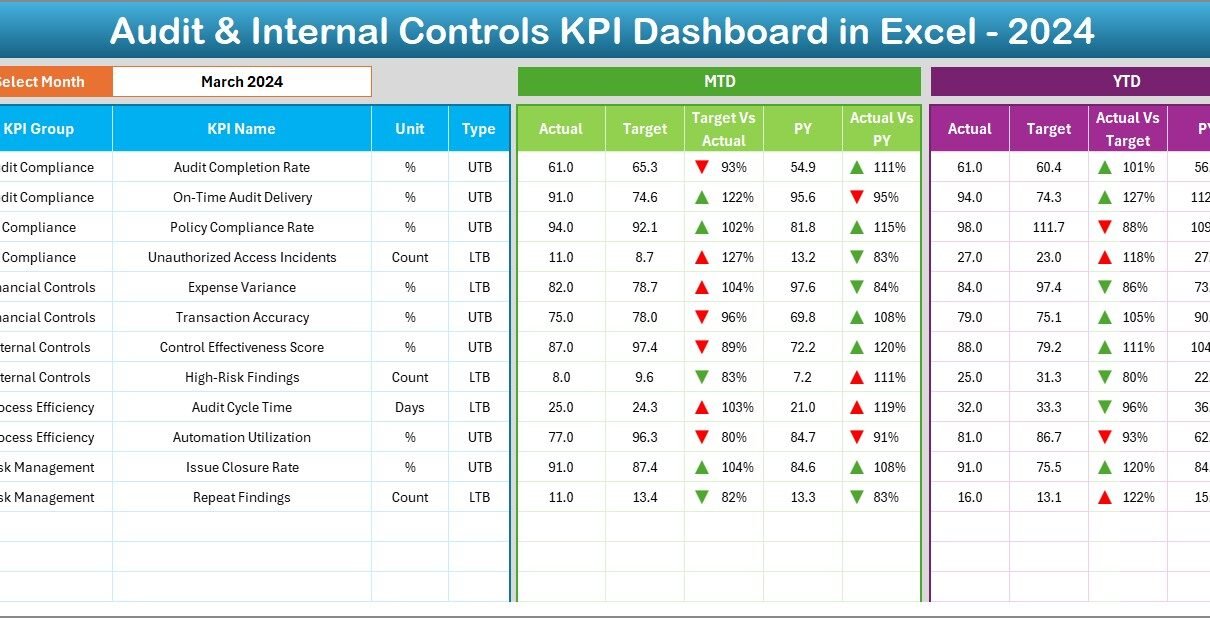
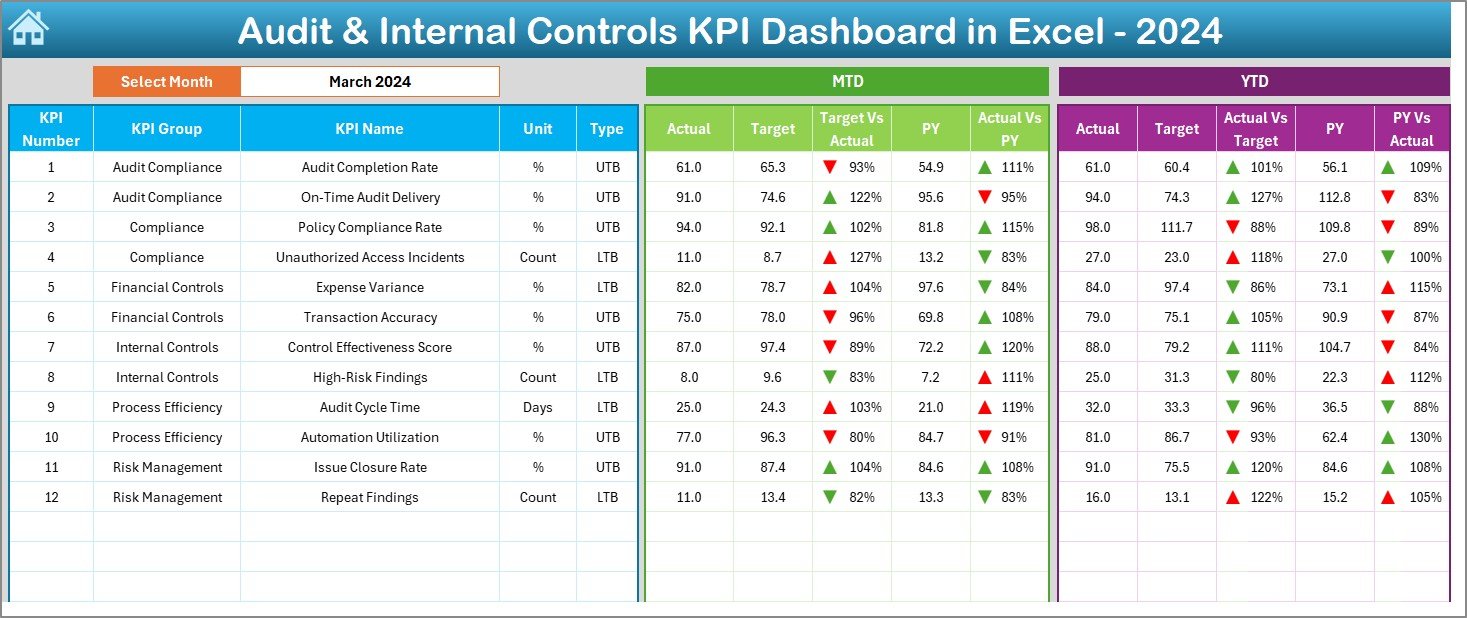
Dashboard Sheet – How Does It Help?
The Dashboard sheet is the main reporting page. You select the month from the drop-down in cell D3, and the entire dashboard updates.
You see:
- MTD Actual, Target, and PY values
- YTD Actual, Target, and PY values
- Target vs Actual analysis
- PY vs Actual analysis
- Conditional formatting arrows (green up arrow for improvement, red down arrow for drop)
This page gives you a complete view of performance in seconds.
Click to buy Audit & Internal Controls KPI Dashboard in Excel
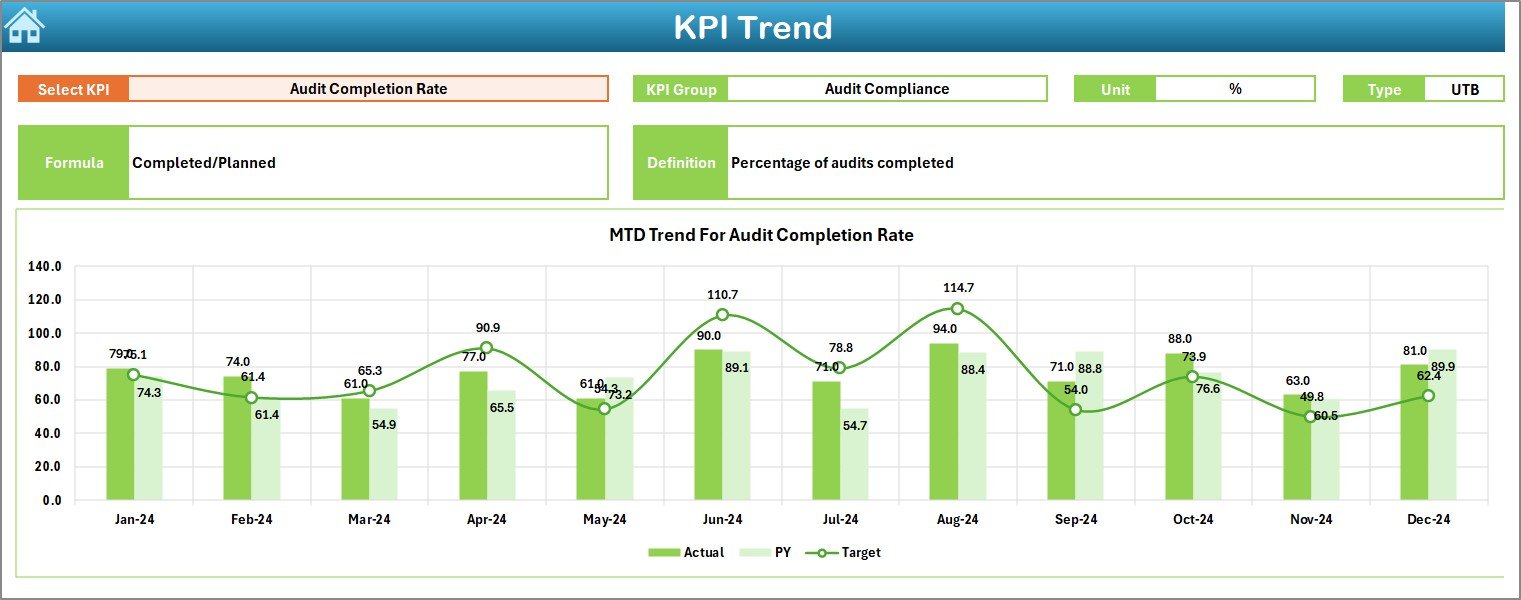
Trend Sheet – Why Do You Need It?
The Trend Sheet helps you study the KPI behavior over time.
You select any KPI from the drop-down in C3, and the sheet displays:
- KPI Group
- Unit of measurement
- Type (UTB – Upper the Better, LTB – Lower the Better)
- Formula
- Definition
You also get MTD and YTD trend charts for Actual, Target, and PY values, which help you understand the movement and pattern of each KPI.
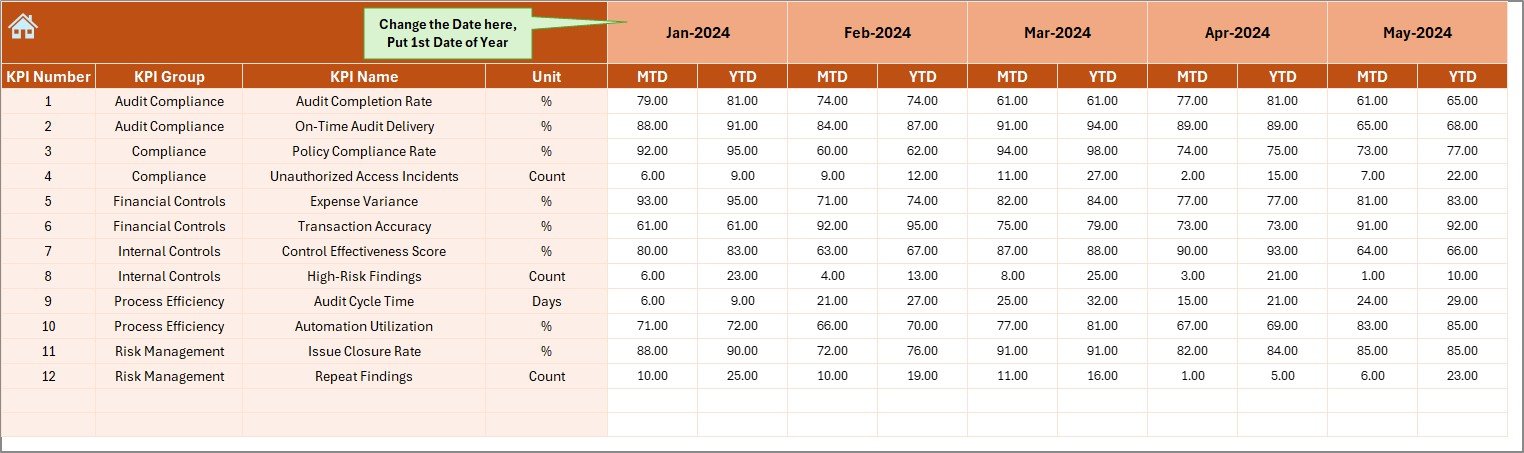
Actual Numbers Input Sheet – How Do You Update Data?
This sheet allows you to enter MTD and YTD actual numbers for each month.
You choose the starting month in cell E1 and update data based on the performance.
The dashboard converts this raw data into visual insights on the main screen.
Click to buy Audit & Internal Controls KPI Dashboard in Excel
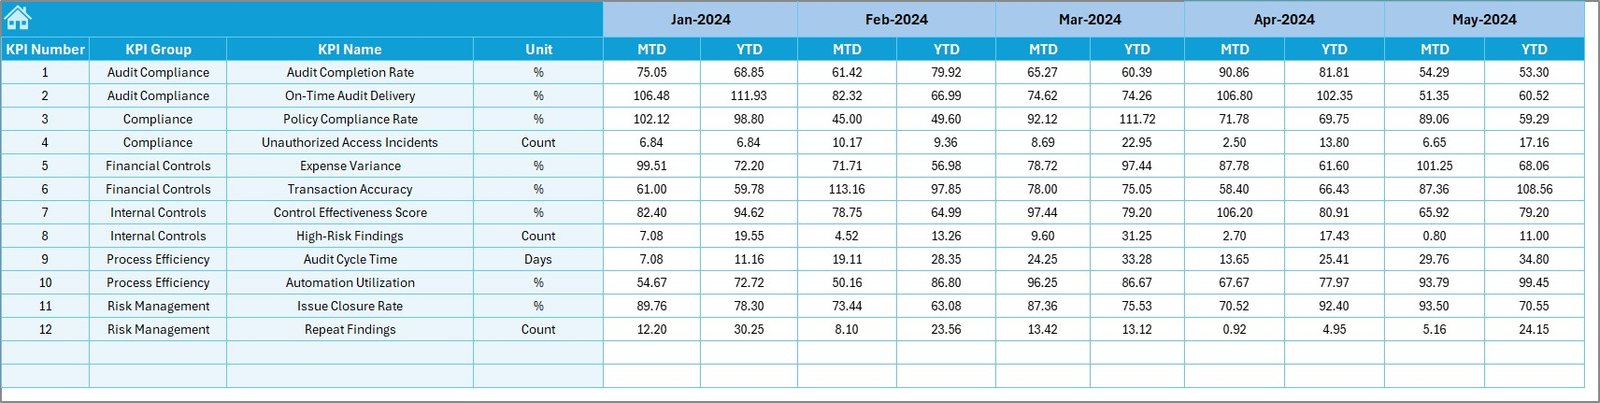
Target Sheet – Where Do You Enter Your Targets?
This sheet stores monthly MTD and YTD targets.
You can set realistic and achievable targets for each KPI, which helps you compare them with actuals and track performance clearly.
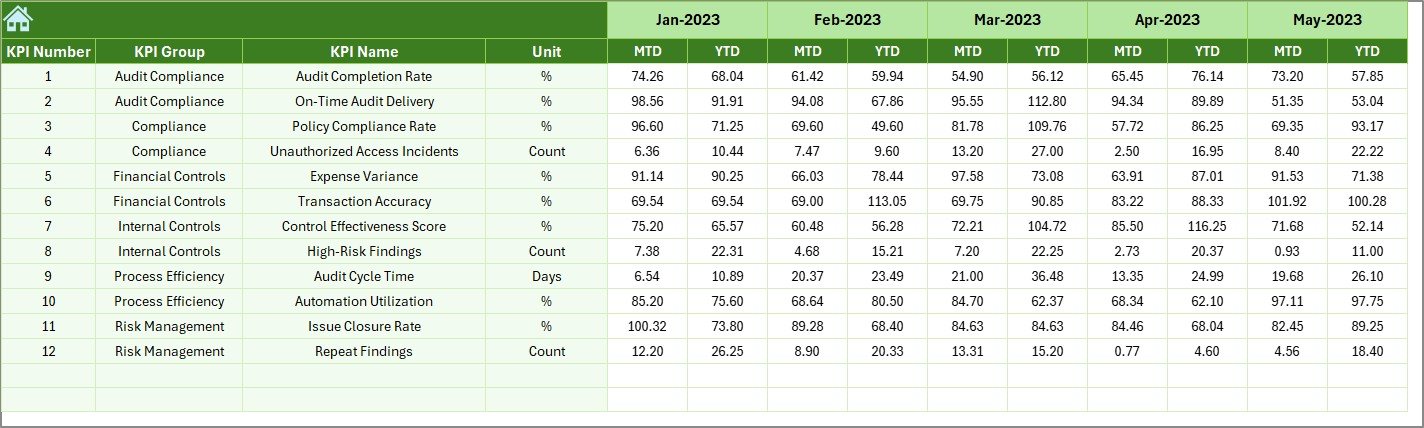
Previous Year Numbers Sheet – Why Compare With PY Data?
This sheet allows you to enter previous year values for all KPIs.
Since internal control and audit teams depend on improvement tracking, PY comparisons are important.
This sheet helps you see growth, decline, or stability.
Click to buy Audit & Internal Controls KPI Dashboard in Excel
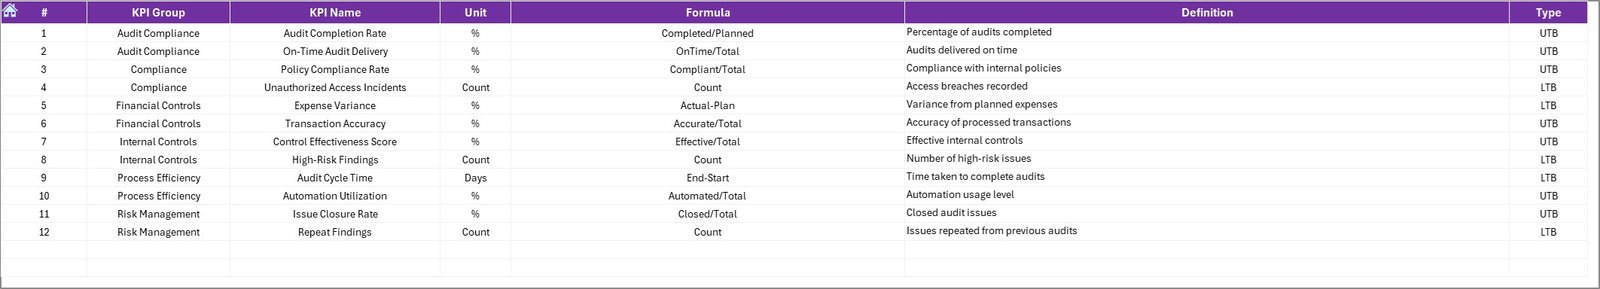
KPI Definition Sheet – Why Is It Useful?
You can enter:
- KPI Name
- KPI Group
- Unit
- Formula
- KPI Definition
This sheet brings clarity and ensures that the entire team follows the same meaning and formula for each metric.
Click to buy Audit & Internal Controls KPI Dashboard in Excel
Advantages of the Audit & Internal Controls KPI Dashboard in Excel
Using this dashboard delivers many benefits. Some major advantages include:
Real-time understanding of audit performance
You see MTD and YTD numbers instantly and make quicker decisions.
Improved transparency across internal controls
Every KPI becomes clear, structured, and easy to track.
Better compliance tracking
You understand where gaps exist and take action before the problem grows.
Clear performance comparison
You compare actuals with target and previous year results in one place.
Easy to update, simple to use
Anyone can update data without technical knowledge.
Better alignment between audit teams and management
Both teams view the same dashboard and stay aligned on goals.
Best Practices for Using the Audit & Internal Controls KPI Dashboard
To use this dashboard in the best way, follow these practices:
Update data every month without delay
Fresh data helps you get accurate insights.
Use simple and consistent KPI names
Clear naming avoids confusion.
Set realistic monthly and yearly targets
Unrealistic targets result in confusion and wrong interpretation.
Review trend charts regularly
Trends highlight long-term issues and improvement areas.
Compare results with both targets and last year data
This gives a balanced performance view.
Align KPI formulas with corporate audit policy
This ensures that the dashboard matches internal standards.
Conclusion
An Audit & Internal Controls KPI Dashboard in Excel helps you track performance with clarity and confidence. It simplifies monitoring, improves transparency, and allows better decision-making.
Since the dashboard covers Summary, Dashboard, Trend, Target, Actuals, PY numbers, and KPI definitions, you get a complete performance management tool in one Excel file.
With this dashboard, your audit team works smarter, faster, and more accurately.
Frequently Asked Questions (FAQs)
- How does this KPI Dashboard help audit teams?
It gives quick insights into audit activities, compliance checks, issue closures, delays, and overall performance. Teams can make decisions faster.
- Can I customize the KPIs in this dashboard?
Yes, you can add, update, or remove KPIs through the KPI Definition sheet and the data sheets.
- Do I need advanced Excel skills to use it?
No, anyone with basic Excel knowledge can update data and use the dashboard.
- Can the dashboard handle monthly audits?
Yes, it tracks both MTD and YTD values for every month of the year.
- Why is Previous Year (PY) comparison important?
PY comparison shows growth and helps you measure improvement in internal controls and audit activities.
Visit our YouTube channel to learn step-by-step video tutorials
Watch the step-by-step video tutorial:
Click to buy Audit & Internal Controls KPI Dashboard in Excel