Nutrition and dietetics professionals handle many responsibilities every day. They track patient health progress, calorie plans, dietary compliance, food preparation quality, clinical outcomes, and operational activities. As work grows, manual tracking becomes stressful and time-consuming. Because of this, many nutritionists, dietitians, and wellness centers now rely on digital dashboards to simplify monitoring.
A Nutrition & Dietetics KPI Dashboard in Excel solves this challenge in a simple way. It brings all essential KPIs into one place so you can analyze your performance with clarity. You view trends, compare month-to-date (MTD) and year-to-date (YTD) data, check targets, and make faster decisions.
In this detailed article, you will learn everything about this dashboard, including its structure, uses, benefits, and best practices. You will also find answers to common questions that most professionals ask before using a KPI dashboard.
Click to buy Nutrition & Dietetics KPI Dashboard in Excel
What Is a Nutrition & Dietetics KPI Dashboard in Excel?
A Nutrition & Dietetics KPI Dashboard in Excel is a ready-to-use performance tracking system designed for dietitians, nutrition clinics, hospitals, fitness centers, wellness centers, and food service departments. It helps users track all important KPIs related to nutrition planning, patient health, diet compliance, food quality, and service operations.
You can monitor monthly performance, compare your targets, evaluate past data, and track your progress in one clean and interactive Excel file. Since everything updates instantly, you save countless hours that you would otherwise spend on manual calculations.
Some of the KPIs you can track include:
- Patient Diet Compliance
- Average Caloric Intake
- Diet Plan Completion Rate
- Clinical Nutrition Outcomes
- Supplement Utilization
- Meal Quality Score
- Food Cost Variance
- Patient Satisfaction Score
- Inventory Usage
- Consultation Count
- Appointment No-Show Rate
- Revenue and Cost Metrics
This dashboard works for both clinical and non-clinical nutrition environments. Because of this flexibility, teams across healthcare, hospitality, fitness, and corporate wellness programs rely on it every day.
Why Do You Need a Nutrition & Dietetics KPI Dashboard?
Nutrition and dietetics involve many variables. Tracking these variables manually leads to errors and delays. With a dashboard, you improve your accuracy and speed. Moreover, you make decisions using real performance data, not assumptions.
Here are some strong reasons to use this dashboard:
- You see your monthly and yearly performance instantly.
- You keep your data organized across different functions.
- You track actual performance against targets in one view.
- You spot issues early through trend charts.
- You increase transparency within the team.
- You spend more time on patient improvement and less time on data handling.
Since everything stays structured, you build confidence in your operations and improve your decision-making quality.
Key Features of the Nutrition & Dietetics KPI Dashboard in Excel
The dashboard includes 7 well-designed worksheets, each built for a specific purpose. Every sheet helps you manage data in a simple and guided way so that you never feel confused.
Let’s explore each sheet in detail.
Summary Page
The Summary Page works like an index page. It contains six quick-access buttons that help you jump to different sheets instantly. You do not scroll through the workbook to find your sheet; instead, you simply click a button and move directly to your required page.
This makes navigation easy and smooth.

Click to buy Nutrition & Dietetics KPI Dashboard in Excel
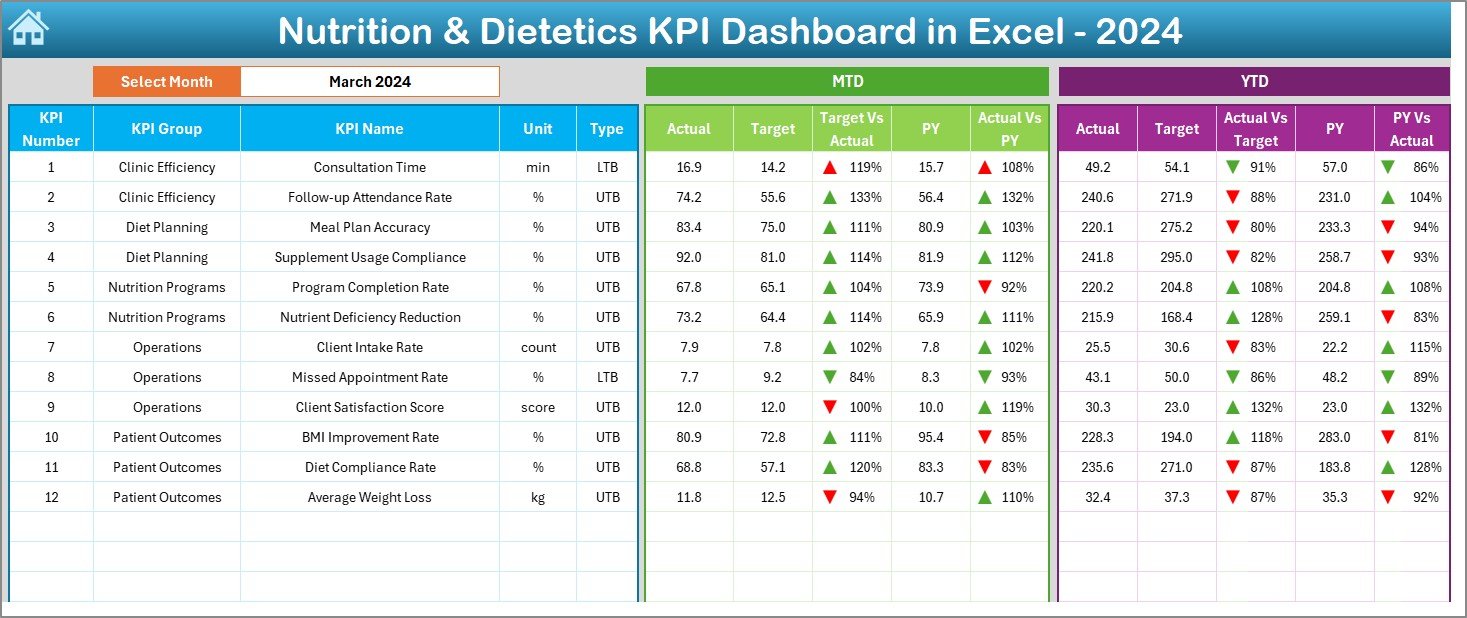
Dashboard Sheet — The Main Analysis View
This is the heart of the entire system. You view all KPI-related insights here.
At the top, you will find a Month drop-down menu in cell D3. You simply select your month, and the dashboard updates automatically. You see:
- MTD Actual
- MTD Target
- MTD Previous Year
- Target vs Actual
- PY vs Actual
- YTD Actual
- YTD Target
- YTD Previous Year
- YTD Target vs Actual
- YTD PY vs Actual
The dashboard uses conditional formatting arrows (up/down) to indicate performance clearly. Because of this, you identify improvement or decline without checking every number manually.
Click to buy Nutrition & Dietetics KPI Dashboard in Excel
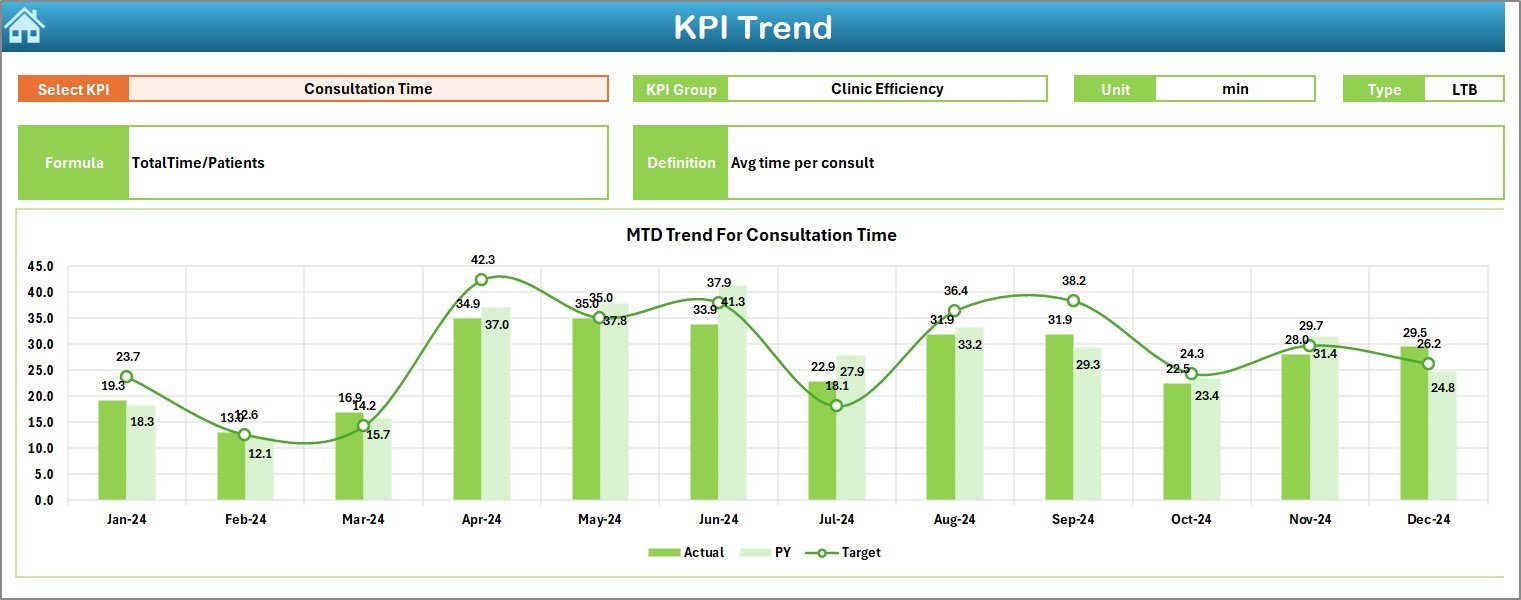
Trend Sheet — KPI Trends and Details
The Trend sheet gives you a deeper view of each KPI. On cell C3, you will find a drop-down to select any KPI.
When you choose a KPI, the sheet displays:
- KPI Group
- Unit
- KPI Type (Lower the Better or Upper the Better)
- Formula
- KPI Definition
Below this information, you can see MTD and YTD trend charts for:
- Actual
- Target
- Previous Year
This sheet helps you understand the behavior of your KPI across multiple months. You can track improvement, decline, fluctuations, and consistency.
Click to buy Nutrition & Dietetics KPI Dashboard in Excel
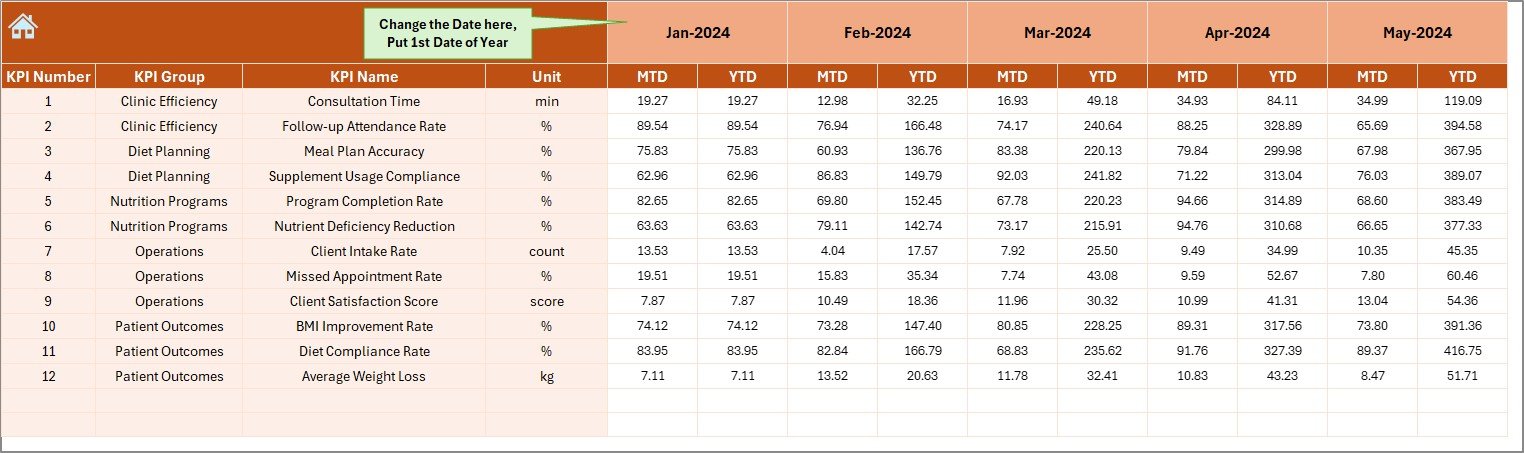
Actual Numbers Input Sheet
This sheet is where you enter your real performance numbers. You can select the year’s starting month from cell E1. After that, you enter the MTD and YTD values for each KPI.
Because you have a clean input structure, you avoid data entry mistakes.
Target Sheet
This sheet lets you input your Monthly Targets for both MTD and YTD metrics. Targets help your team understand expected performance standards and work toward them with clarity. Setting the right targets also helps you measure improvement.

Previous Year Numbers Sheet
This sheet is important because it provides comparison data. You enter the previous year’s MTD and YTD values here. When the dashboard compares your current performance with last year’s numbers, you understand how much you improved.

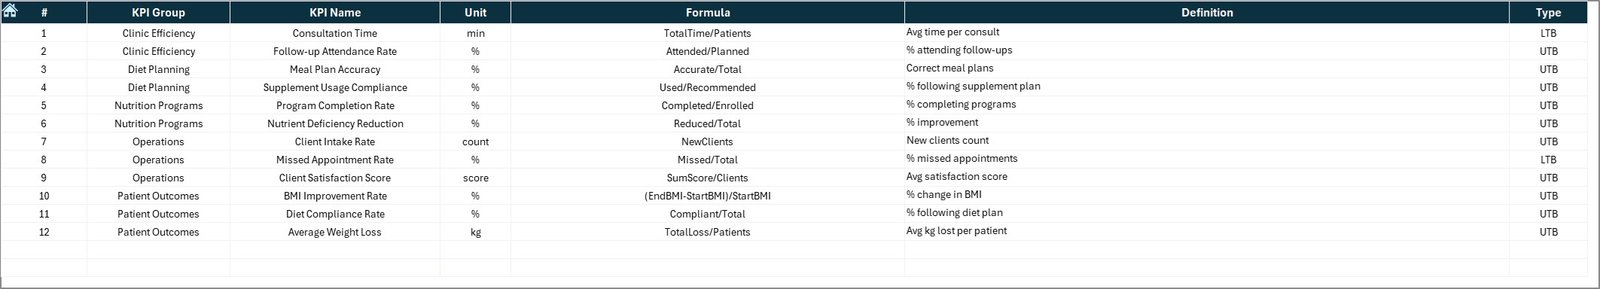
KPI Definition Sheet
This sheet contains essential KPI information, including:
- KPI Name
- KPI Group
- Unit
- Formula
- KPI Definition
This sheet helps your team understand each KPI clearly. It reduces confusion and ensures that everyone uses the same interpretation while entering or analyzing data.
How Does This Dashboard Improve Nutrition & Dietetics Performance?
This dashboard boosts accuracy and reduces manual work. You track KPIs faster, and you make better decisions. Because of this, your overall performance improves naturally.
Here are some ways the dashboard helps:
You track dietary compliance more accurately
You see whether patients follow their assigned diets.
You check food quality easily
Food scores help you maintain consistency and safety.
You manage caloric plans effectively
You can compare planned vs actual caloric intake.
You improve patient clinical outcomes
With trend charts, you catch issues early and take quick action.
You optimize food inventory
By tracking consumption trends, you avoid wastage.
You manage operational performance
Everything becomes measurable, from consultations to revenue.
With clear insights, your department works smarter and faster.
Advantages of a Nutrition & Dietetics KPI Dashboard in Excel
A dashboard gives you more control over your operations. You understand your numbers better, so your decisions become stronger. Below are the major advantages of using this system.
- Real-Time Visibility of KPIs
The dashboard updates instantly when you enter new data. Because of this, you always work with real-time information.
- Easy Comparison of MTD, YTD, and Previous Year
You compare performance across three dimensions:
- Month-to-Date
- Year-to-Date
- Previous Year
This helps you measure growth and make informed improvement plans.
- Better Team Collaboration
Your team understands KPIs clearly. Everyone follows the same definitions, formulas, and measurement standards.
- Improved Patient Outcomes
When you track nutrition KPIs regularly, your focus shifts to improving patients’ diets, wellness, and recovery.
- Reduced Manual Effort
The dashboard performs all calculations automatically. You spend less time on number-crunching and more time on meaningful activities.
- Easy to Customize
Since the dashboard runs in Excel, you can modify KPIs, add new sheets, or change visuals anytime.
- Data-Driven Decision Making
Effective nutrition planning requires accurate data. The dashboard provides clean visuals and insights so you can decide quickly with confidence.
Important KPIs to Track in Nutrition & Dietetics
Although KPIs vary depending on the clinic or department, here are some commonly used metrics:
- Patient Diet Compliance Rate
- Caloric Intake Accuracy
- Diet Plan Completion Rate
- Average Recovery Time
- Patient Satisfaction Score
- Supplement Consumption Rate
- Food Cost Percentage
- Food Waste Amount
- Inventory Turnover
- Consultation Count
- Appointment No-Show Rate
- Revenue and Expense Ratios
Tracking these KPIs helps you improve patient outcomes while optimizing operational efficiency.
Best Practices for Using a Nutrition & Dietetics KPI Dashboard
To get maximum value from your dashboard, follow these simple best practices.
- Keep Your KPI List Clear and Relevant
Do not overcrowd your dashboard with unnecessary KPIs. Choose only the metrics that impact your goals.
- Review Data Every Month
Regular reviews help you spot improvements and issues early.
- Set Realistic Targets
Your targets should push your team without causing stress. Review and update targets as your performance trends change.
- Maintain High Data Accuracy
Always enter correct and updated numbers. Wrong data leads to wrong strategies.
- Use Trend Charts for Analysis
Charts help you understand whether your performance is improving or declining. Use them to guide your decisions.
- Encourage Team Participation
Ask your team to review KPIs regularly. When everyone stays involved, performance improves faster.
- Update Definitions and Formulas When Needed
If your operations change, review and update KPI definitions so your dashboard stays aligned with your goals.
How to Build Your Own Nutrition & Dietetics KPI Dashboard in Excel
If you want to create your own dashboard, follow these steps:
- Identify your top KPIs.
- Create a KPI definition table.
- Prepare sheets for actual values, targets, and previous year numbers.
- Build your dashboard page with charts and indicators.
- Add MTD, YTD, and comparison formulas.
- Use conditional formatting for visual clarity.
- Add drop-downs for easy navigation.
- Test your dashboard with sample data.
However, creating such a dashboard from scratch takes time and expertise. A ready-to-use template reduces your effort and helps you start tracking immediately.
Conclusion
A Nutrition & Dietetics KPI Dashboard in Excel brings structure, clarity, and speed to your performance tracking. You monitor every important KPI, compare monthly and yearly values, and improve your operations using clean insights. Since the dashboard runs in Excel, you can customize it easily and use it across different nutrition and dietetics environments.
When you track nutrition performance consistently, you make better decisions, improve patient outcomes, reduce costs, and run a more efficient department. With this dashboard, you work smarter, stay organized, and reach your goals faster.
Frequently Asked Questions (FAQs)
- Below are some common questions that users often ask.
- Who can use a Nutrition & Dietetics KPI Dashboard in Excel?
- Dietitians, nutritionists, hospitals, wellness centers, fitness centers, schools, catering teams, and food service departments can use this dashboard.
- Can I customize the KPIs in the dashboard?
- Yes. You can add, remove, or modify KPIs easily because the dashboard is built in Excel.
- Do I need advanced Excel skills to use this template?
- No. The dashboard is user-friendly. You only enter your data, and everything updates automatically.
- What type of data should I enter in the Actual Numbers sheet?
- You should enter the MTD and YTD values for each KPI based on your performance for that month.
- How often should I update the dashboard?
Update it every month for the best results. Regular updates help you track progress clearly.
- Does the dashboard support trend analysis?
Yes. The Trend sheet displays MTD and YTD trend charts for Actual, Target, and Previous Year data.
- Can this dashboard help improve patient outcomes?
Yes. By tracking key KPIs like diet compliance, recovery time, and clinical nutrition metrics, you can improve care and results.
Visit our YouTube channel to learn step-by-step video tutorials
Watch the step-by-step video tutorial:
Click to buy Nutrition & Dietetics KPI Dashboard in Excel