Managing a primary school involves many responsibilities. Teachers, administrators, and academic leaders must track student progress, teacher performance, attendance, learning outcomes, infrastructure readiness, health and safety, and many other elements. Since every school runs on data, it becomes difficult to manage everything manually. Therefore, schools need a simple, clear, and powerful reporting system. A Primary Schools KPI Dashboard in Excel solves this challenge with ease.
This dashboard brings all important Key Performance Indicators (KPIs) into one place. It gives real-time insights, highlights trends, and helps school leaders make smarter decisions. In this detailed guide, you will learn everything about this dashboard, including its features, advantages, structure, best practices, and common questions users ask.
Click to buy Primary Schools KPI Dashboard in Excel
What Is a Primary Schools KPI Dashboard in Excel?
A Primary Schools KPI Dashboard in Excel is a performance-monitoring tool created to help schools track critical academic and operational KPIs. It converts complex data into easy-to-understand charts, tables, and cards. Since it runs in Excel, you do not need any advanced software or technical skills. You only update the numbers, and the dashboard gives instant results.
You can monitor activities such as:
- Student attendance
- Teacher performance
- Student-teacher ratio
- Academic results
- Classroom utilization
- Parent satisfaction
- Student behavior
- Extracurricular participation
- Health and hygiene indicators
- Monthly trends and yearly improvements
Because the dashboard uses formulas and smart visuals, it helps principals, coordinators, teachers, and admin teams stay informed throughout the year.
Why Do Primary Schools Need a KPI Dashboard?
Primary schools generate a lot of data every day. Without proper tools, this data becomes confusing. A KPI dashboard helps schools:
- Stay organized
- Track performance monthly and yearly
- Identify strengths and weaknesses
- Improve decision-making
- Maintain transparency
- Manage resources better
- Enhance student outcomes
Since Excel is familiar to everyone, schools can use this dashboard without training or external help.
Key Features of the Primary Schools KPI Dashboard in Excel
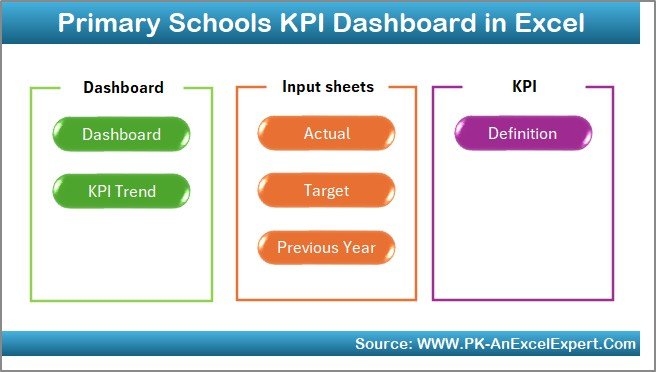
We created this dashboard using a simple yet powerful structure. It includes 7 worksheets, and each sheet plays an important role in helping users understand the data clearly.
Below are the worksheets and their functions:
Summary Page
The Summary Page works as an index. You will find six main buttons that take you to different sheets in just one click. This makes navigation easy and helps users move quickly between pages.
Click to buy Primary Schools KPI Dashboard in Excel
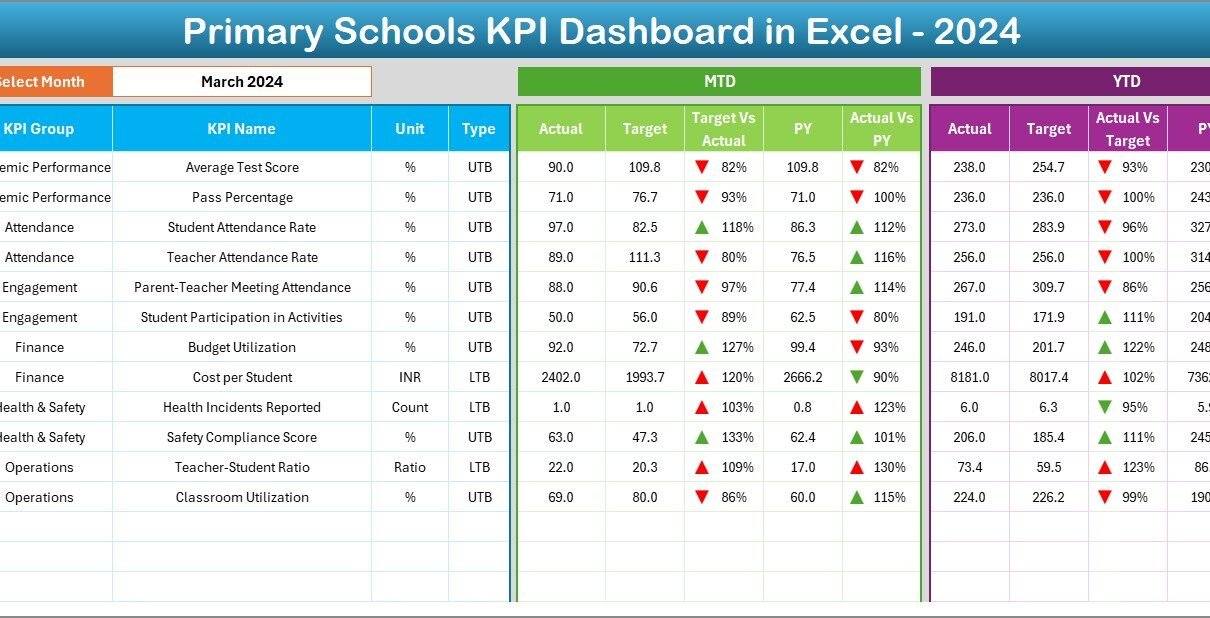
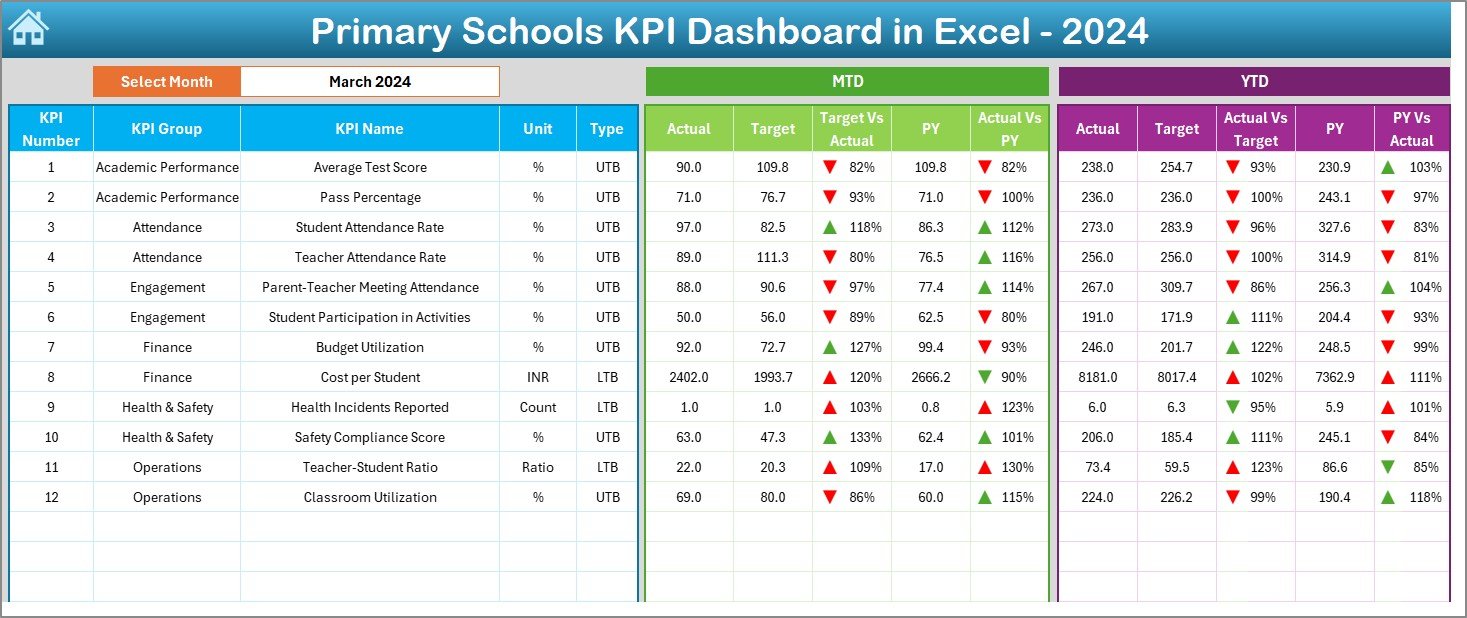
Dashboard Sheet Tab
This is the core of the dashboard. You will find all KPI results displayed in a clean and visually appealing layout.
Here is what you can do on this sheet:
- Select the month from a drop-down list (cell D3).
- See instant updates for all KPIs for the selected month.
- View MTD (Month-to-Date) performance.
- View YTD (Year-to-Date) performance.
- Compare Actual vs Target.
- Compare Actual vs Previous Year.
- Understand performance with conditional formatting arrows showing improvements or drops.
This sheet summarizes performance across academics, operations, attendance, and student development.
Click to buy Primary Schools KPI Dashboard in Excel
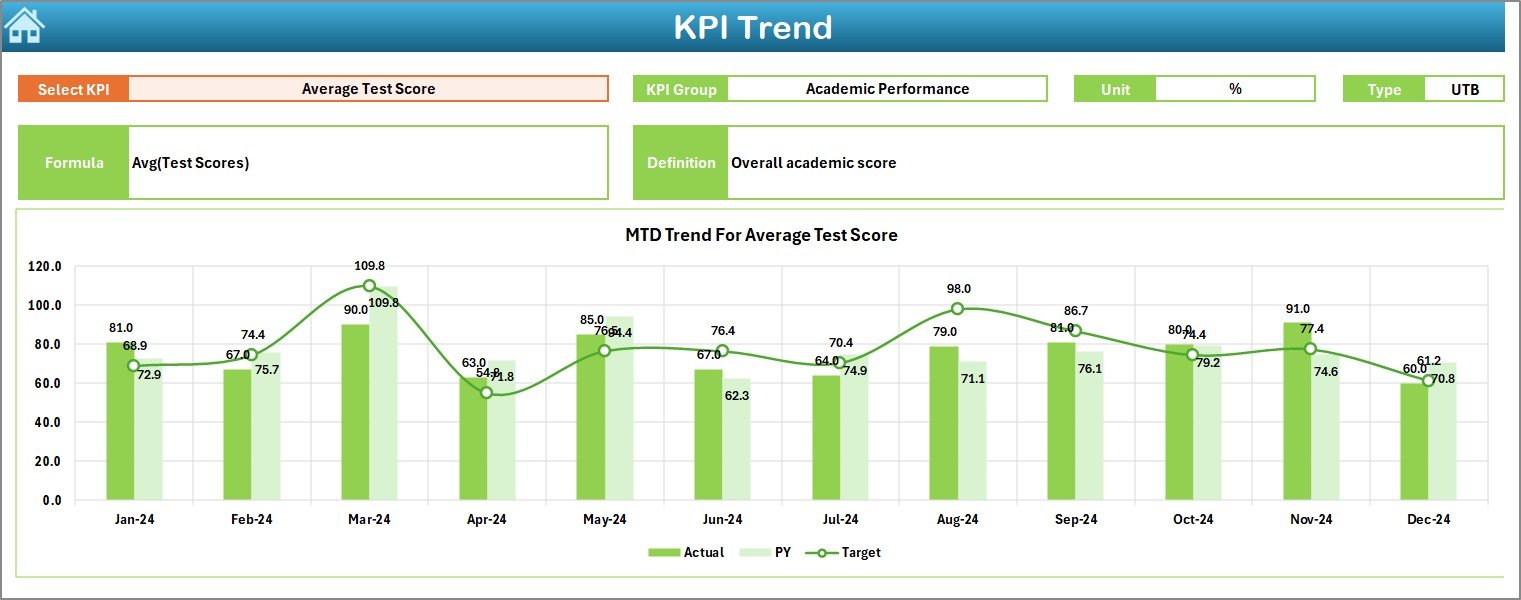
Trend Sheet Tab
The Trend Sheet gives a deeper view of each KPI.
On this page, you can:
- Select any KPI from the drop-down (cell C3).
- View the KPI Group.
- Check the Unit of Measurement.
- View KPI Type (UTB: Upper the Better or LTB: Lower the Better).
- Understand the KPI Formula.
- See the short KPI Definition.
- Analyze MTD Trend Chart (Actual, Target, Previous Year).
- Analyze YTD Trend Chart (Actual, Target, Previous Year).
This sheet helps identify if performance is improving or declining throughout the academic year.
Click to buy Primary Schools KPI Dashboard in Excel
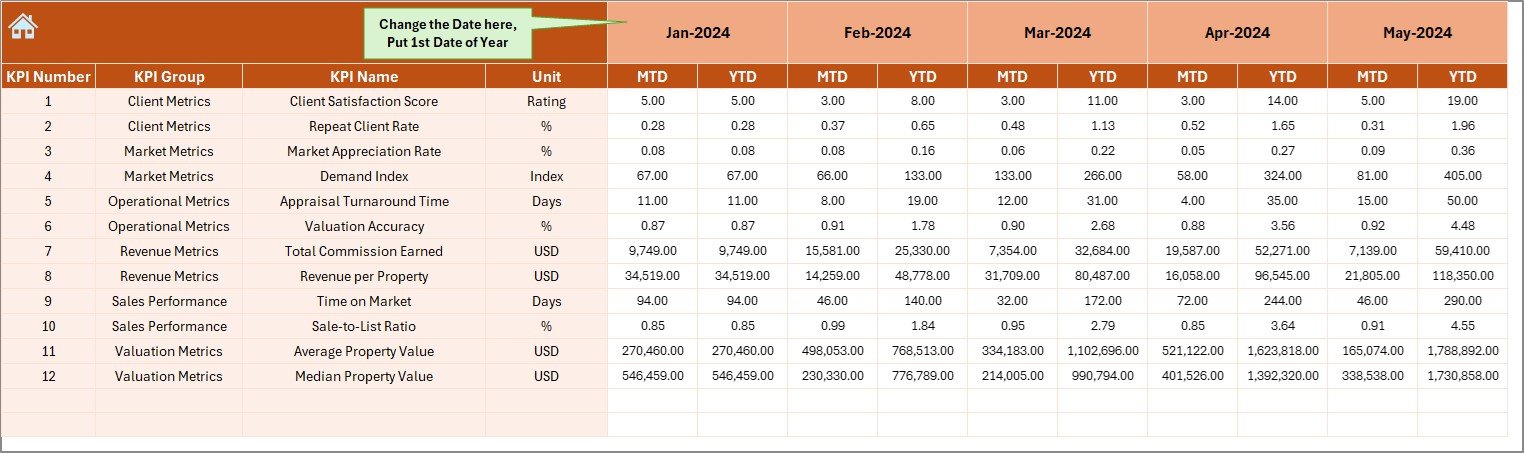
Actual Numbers Input Sheet
On this sheet, users enter all actual performance numbers.
You can:
- Enter MTD and YTD figures.
- Change the academic year’s first month from cell E1.
- Update data manually for each KPI.
Once you update the data, the dashboard refreshes automatically.
Click to buy Primary Schools KPI Dashboard in Excel
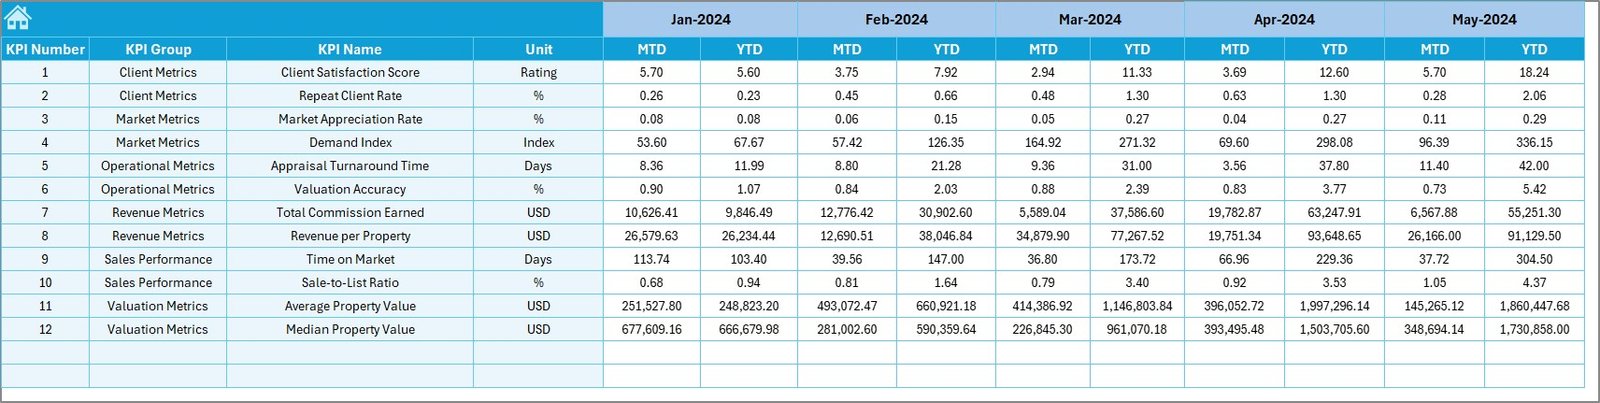
Target Sheet Tab
This sheet is for entering annual or monthly performance targets.
You can enter:
- Monthly MTD Targets
- Monthly YTD Targets
Targets help schools measure if they are performing as expected.
Click to buy Primary Schools KPI Dashboard in Excel
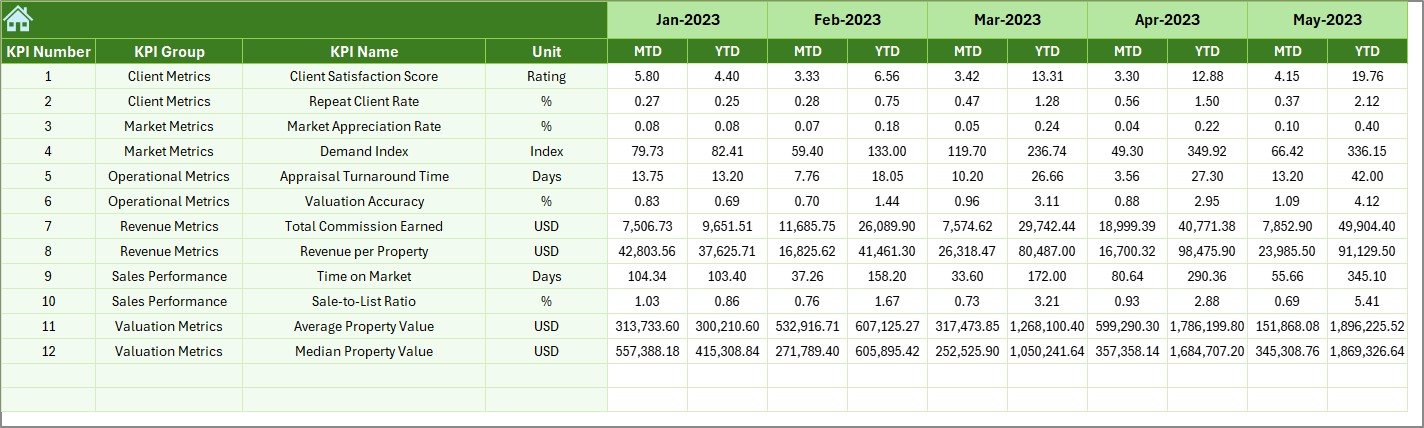
Previous Year Numbers Sheet Tab
This sheet stores last year’s data. You enter previous year numbers in the same format as current year data. The dashboard then uses it for comparison charts and analysis.
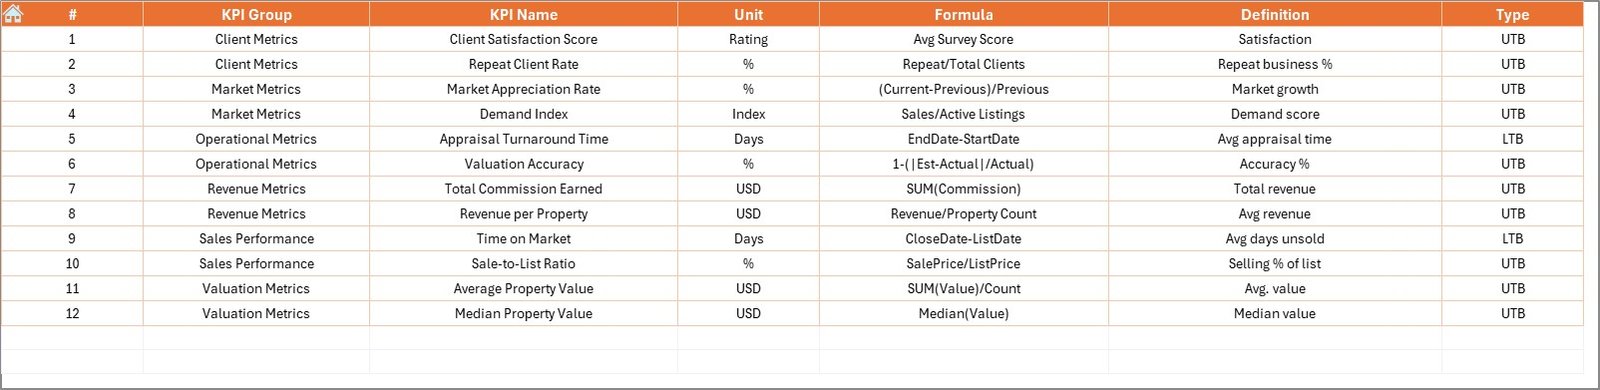
KPI Definition Sheet Tab
This is one of the most important sheets. Here, you store:
- KPI Name
- KPI Group
- Unit
- Formula
- KPI Definition
This sheet ensures that the dashboard remains organized, consistent, and easy for any user to understand.
Why a Primary School Should Use a KPI Dashboard?
A KPI dashboard helps school leaders:
- Track academic improvements
- Improve student outcomes
- Strengthen teaching quality
- Maintain attendance discipline
- Enhance classroom planning
- Manage resources effectively
- Build strong parent communication
- Monitor behavioral patterns
- Plan training programs for teachers
Since every school wants better results, using a dashboard becomes a smart step.
How Does the Dashboard Improve School Operations?
This dashboard improves planning and management through:
Clear Monthly Insights
Administrators can see where the school stands each month.
Accurate Yearly Tracking
YTD numbers highlight long-term progress.
Better Resource Allocation
Leaders can allocate staff and resources based on real performance.
Improved Decision-Making
Data helps leaders make smart and confident decisions.
Transparency for Stakeholders
Teachers, parents, and management teams can see clear progress.
Advantages of the Primary Schools KPI Dashboard in Excel
Below are the major benefits schools experience when using this dashboard:
- Easy to Use
Excel is simple and user-friendly. Anyone can use the dashboard without technical knowledge.
- Real-Time Insights
The dashboard updates instantly when you change the data, helping schools respond quickly.
- Better Academic Planning
You can track test scores, attendance, and progress to improve learning outcomes.
- Enhanced Teacher Monitoring
Measure teacher workload, class strength, and student feedback.
- Improved School Management
Schools can plan budgets, facilities, student activities, and operations using reliable data.
- Accurate Comparisons
Users compare actual numbers with targets and previous year results.
- Trend Tracking
MTD and YTD trend charts help identify consistent improvements or performance gaps.
Best Practices for Using the Primary Schools KPI Dashboard
To get the best results, follow these simple practices:
- Update Data Every Month
Regular updates help schools track performance more accurately.
- Keep KPI Definitions Clear
Always maintain updated definitions and formulas in the KPI Definition sheet.
- Enter Previous Year Data Carefully
Previous year numbers help in accurate comparison and trend analysis.
- Review Target Values Often
Adjust monthly and yearly targets based on performance.
- Use Trend Charts for Action Plans
Trend charts help teachers and leaders create better action plans.
- Share Dashboard Insights
Discuss dashboard results with teachers, parents, and school committees.
- Keep the File Clean and Organized
Avoid unnecessary formatting or changes to formulas.
Top KPIs Every Primary School Should Track
Here are some important KPIs that schools can include:
- Student Attendance Rate
- Teacher Attendance Rate
- Student-Teacher Ratio
- Academic Performance Score
- Homework Completion Rate
- Discipline Incidents
- Parent Satisfaction Score
- Class Utilization Rate
- Extracurricular Participation
- Health & Hygiene Compliance
- Library Usage Rate
- Staff Training Hours
These KPIs give a complete picture of a school’s performance.
How to Use the Dashboard Effectively
Follow these easy steps:
- Enter actual monthly numbers.
- Add yearly targets in the target sheet.
- Enter last year’s data.
- Select the month from the dashboard.
- Review MTD and YTD results.
- Open the Trend sheet for deeper insights.
- Share findings with teachers and management.
- Take action based on insights.
This simple routine ensures strong and consistent school performance.
Conclusion
A Primary Schools KPI Dashboard in Excel is a powerful tool for improving academic quality, teacher performance, operational planning, and student development. Since the dashboard makes data easy to read and understand, schools can make quicker and smarter decisions. It also helps teachers stay aligned with the school’s goals and long-term improvement plans.
With its clear layout, strong analytics, and simple navigation, this dashboard becomes an essential tool for any primary school that wants better outcomes and better management.
Frequently Asked Questions (FAQs)
- What is a KPI dashboard for primary schools?
A KPI dashboard is a tool that tracks and displays important performance indicators for schools, such as attendance, academics, and teacher performance.
- Can beginners use this dashboard easily?
Yes. The dashboard is designed in Excel, so anyone with basic knowledge can use it easily.
- How often should I update the data?
You should update it every month for accurate MTD and YTD results.
- Why do we need previous year data?
Previous year numbers help compare current performance and identify long-term improvements.
- Can schools customize the KPIs?
Yes. You can add, remove, or modify KPIs in the KPI Definition sheet.
Visit our YouTube channel to learn step-by-step video tutorials
Watch the step-by-step video tutorial:
Click to buy Primary Schools KPI Dashboard in Excel