The fashion and apparel industry changes fast. Trends shift, customer preferences evolve, and sales numbers fluctuate every single month. Because of this constant change, every retailer, brand, and manufacturer must track performance with clarity and speed. However, many teams still manage their KPIs in spreadsheets or scattered reports. This leads to slow decisions, missed opportunities, and delayed actions.
A Fashion & Apparel KPI Dashboard in Power BI solves this problem. It brings all fashion-related performance indicators into one clean and interactive dashboard. As a result, fashion teams understand sales, margins, stock movement, customer demand, and store performance in real time. In this detailed guide, you will learn what this dashboard is, how it works, why it matters, and how you can use it to grow faster.
Click to buy Fashion & Apparel KPI Dashboard in Power BI
What Is a Fashion & Apparel KPI Dashboard in Power BI?
A Fashion & Apparel KPI Dashboard in Power BI is an interactive reporting system that tracks all important performance metrics related to apparel sales, product categories, stock levels, margins, and customer behavior. Power BI converts your raw Excel data into clean visual charts, slicers, KPI cards, and trend visuals. This dashboard gives you a complete view of your business in just one glance.
Since fashion runs on fast-changing numbers, this dashboard helps teams:
- Track Month-to-Date (MTD) performance
- Track Year-to-Date (YTD) performance
- View previous year comparisons
- Check category-wise and store-wise trends
- Review product performance
- Identify fast-moving and slow-moving fashion items
- Monitor replenishment requirements
- Understand stock aging
- Track the difference between targets and actuals
Most importantly, the dashboard displays product and sales KPIs in a dynamic and interactive format. You can select a month, a category, or a KPI group and see all insights update instantly. As a result, managers take decisions with confidence and accuracy.
Why Do Fashion Businesses Need a KPI Dashboard?
Fashion businesses depend on data. Every collection, every product drop, and every season creates huge amounts of information. Without a dashboard, it becomes difficult to understand what is working and what requires improvement.
A Power BI dashboard helps because:
- You see your performance in seconds.
- You compare numbers across categories, stores, and years.
- You respond faster to low stock, high demand, or slow-moving items.
- You plan better for upcoming seasons.
When all KPIs stay in one place, the entire team—from sales to supply chain—stays aligned.
Key Features of the Fashion & Apparel KPI Dashboard in Power BI
Your dashboard includes three well-designed pages that help you track KPIs in a simple and structured way.
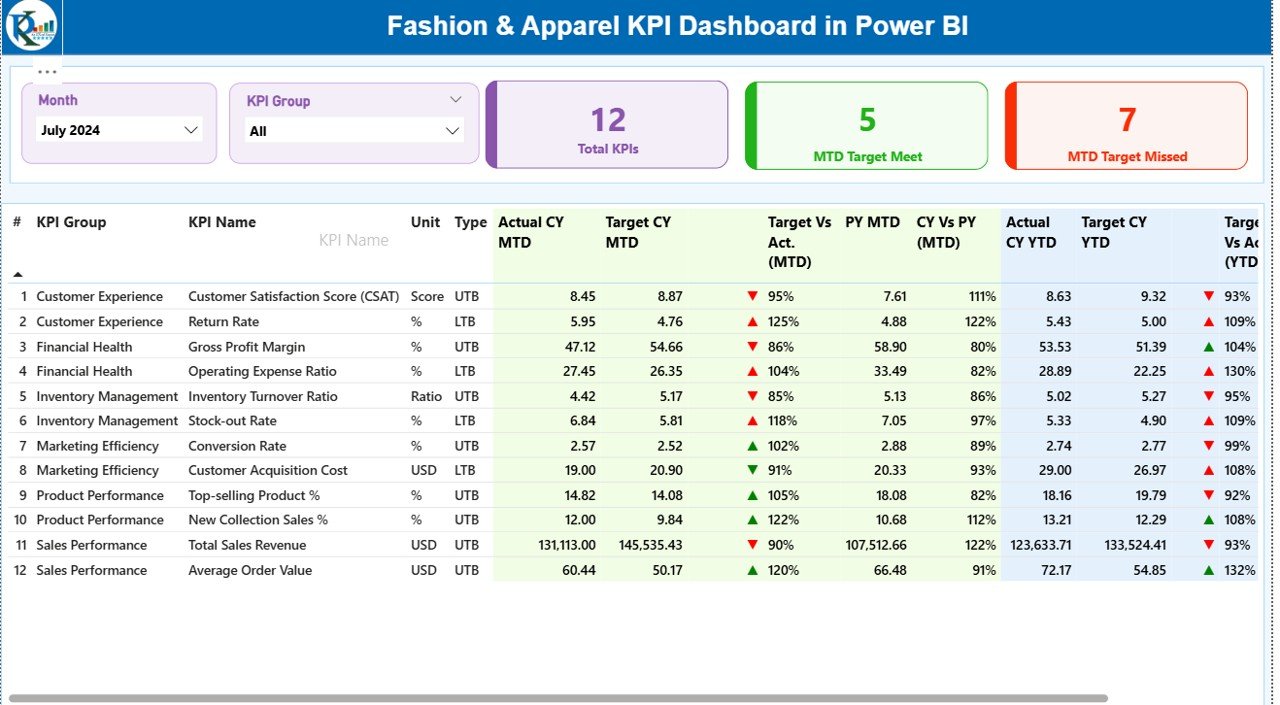
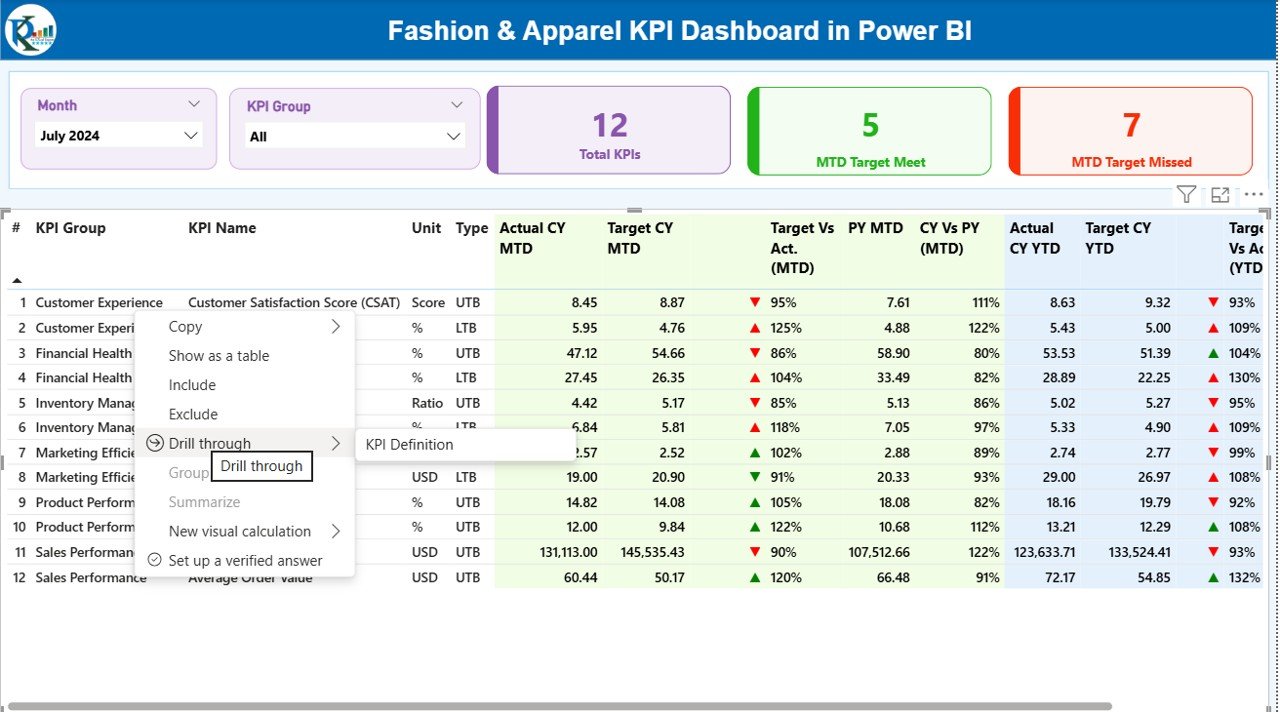
Summary Page – What Does It Show?
This is the main page of the Fashion & Apparel KPI Dashboard. It gives a complete snapshot of overall performance.
Top Section
You can select:
- Month
- KPI Group
(such as sales, inventory, customer behavior, production, or category performance)
This selection updates all visuals on the page.
KPI Cards
You can also view three important KPI summary cards:
- Total KPIs Count
- MTD Target Achieved
- MTD Target Missed
These cards help you understand whether you are meeting your goals.
Detailed KPI Table
Below the cards, you see a structured KPI table showing:
- KPI Number
- KPI Group
- KPI Name
- Unit
- KPI Type: LTB (Lower the Better) or UTB (Upper the Better)
- Actual CY MTD
- Target CY MTD
- MTD Icon (Green ▲ or Red ▼ based on performance)
- Target vs Actual (MTD %)
- Previous Year MTD
- CY vs PY MTD %
- Actual CY YTD
- Target CY YTD
- YTD Icon (Green ▲ or Red ▼)
- Target vs Actual (YTD %)
- Previous Year YTD
- CY vs PY YTD %
This table tells you exactly where you stand and how you compare with targets.
Click to buy Fashion & Apparel KPI Dashboard in Power BI
KPI Trend Page – How Does It Help?
This page shows two combo charts. Both charts help you track performance trends over time.
MTD Trend Chart
You can see:
- Actual MTD Numbers
- Target MTD Numbers
- Previous Year MTD Values
This trend helps you understand whether performance is improving or declining.
YTD Trend Chart
Here you see:
- Actual YTD Numbers
- Target YTD Numbers
- Previous Year YTD Values
When you track trends this way, you spot early warnings and opportunities.
You can also use the slicer on the left to select the specific KPI name. This changes the charts instantly.

Click to buy Fashion & Apparel KPI Dashboard in Power BI
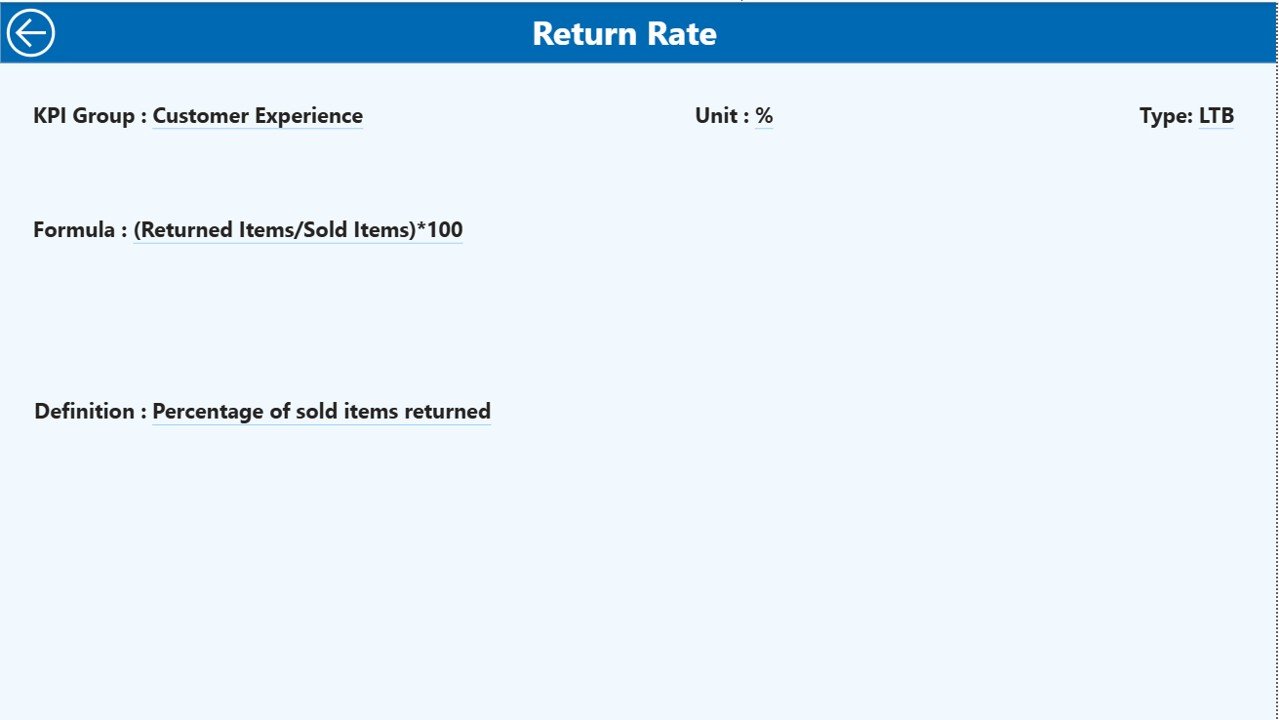
KPI Definition Page – Why Is It Important?
This drill-through page helps you check:
- KPI formula
- KPI description
- KPI category
- KPI unit
- KPI type (LTB or UTB)
Whenever you click a KPI on the summary page, you can drill through and view all details. This ensures a clear understanding of calculations, which is helpful when reviewing numbers with your team.
Click to buy Fashion & Apparel KPI Dashboard in Power BI
How Does the Excel Data Structure Support This Dashboard?
The dashboard uses an Excel file with three worksheets:
Input_Actual Tab
You fill:
- KPI Name
- Month
- MTD Actual
- YTD Actual
You must use the first date of the month (like 01-Jan-2024) so that Power BI can read it smoothly.
Input_Target Tab
You enter:
- KPI Name
- Month
- MTD Target
- YTD Target
These values help Power BI compare actuals with your goals.
KPI Definition Tab
You fill:
- KPI Number
- KPI Group
- KPI Name
- Unit
- Formula
- Definition
- Type (LTB/UTB)
This sheet helps Power BI build the drill-through page.
Click to buy Fashion & Apparel KPI Dashboard in Power BI
What KPIs Should You Track in Fashion & Apparel?
Fashion KPI groups may include:
- Sales KPIs
- Merchandising KPIs
- Inventory KPIs
- Customer Behavior KPIs
- Store & Location KPIs
- Production & Manufacturing KPIs
Here are some common examples:
Sales KPIs
- Total Sales
- Sales per Store
- Sales per Category
- Sales Return Rate
- Average Basket Value
Inventory KPIs
- Stock Turnover
- Stock Aging
- Slow-Moving Stock
- Fast-Moving Stock
- Reorder Levels
Customer KPIs
- Conversion Rate
- Repeat Purchase Rate
- Online vs Offline Sales
- Customer Satisfaction Score
Merchandising KPIs
- Category-wise Profit
- Sell-through Rate
- Markdown Percentage
- Gross Margin Return on Investment
When you combine these KPIs in Power BI, you get a complete view of your fashion business.
Why Is Power BI the Right Tool for Fashion KPI Tracking?
Power BI offers many benefits:
- It updates dashboards automatically.
- It connects directly to Excel or a database.
- It offers interactive visuals and easy filtering.
- It supports drill-through and drill-down features.
- It displays trends clearly.
- It turns huge data into simple visuals.
These advantages help fashion companies stay ahead in a fast-moving market.
Advantages of Fashion & Apparel KPI Dashboard in Power BI
Here are the major advantages:
- Real-Time Performance Visibility
You see your sales, stock, and customer KPIs instantly.
Faster Decision-Making
You never wait for manual reports. Instead, all insights update in seconds.
Better Inventory Planning
You avoid stockouts and reduce excess stock.
Improved Merchandising
You track category performance and adjust collections easily.
Strong Trend Analysis
You compare current vs previous year numbers and identify growth patterns.
- Clear Communication Across Teams
Everyone sees the same numbers, which improves alignment.
- Easy to Use for Non-Technical Teams
Power BI dashboards are clean, simple, and interactive.
- Increased Profitability
When you track KPIs clearly, your profit improves naturally.
Best Practices for Using the Fashion & Apparel KPI Dashboard
Follow these best practices to get the most value:
- Update Data on Time
Always fill MTD and YTD values every month.
Use the First Date of the Month
This ensures smooth time-series analysis.
Use Clear KPI Definitions
Your team should understand how each KPI is calculated.
Review MTD and YTD Separately
MTD gives short-term performance.
YTD gives long-term performance.
Compare with Targets Regularly
Check both target vs actual and previous year comparisons.
Track Both LTB and UTB KPIs
Some KPIs improve when they go down (LTB), like Return Rate.
Some improve when they go up (UTB), like Sales.
Drill Through for Deeper Insights
Use the hidden KPI Definition page to explore calculation logic.
Use Trend Charts Before Making Decisions
Trends tell the real story behind the numbers.
Review KPI Groups Separately
Sales, inventory, and customer KPIs behave differently.
Study each group with focus.
Conclusion
The Fashion & Apparel KPI Dashboard in Power BI helps fashion brands and retailers stay ahead in a fast-changing industry. It converts your Excel data into interactive visuals that tell you exactly how your business performs each month. Since fashion moves fast, this dashboard gives you the clarity, speed, and confidence you need to make smart decisions.
When you track sales numbers, stock levels, customer demand, and category performance in one place, your entire team becomes stronger. You reduce waste, improve profits, and respond faster to market changes.
Every fashion business—small or large—can grow faster using this Power BI dashboard.
Frequently Asked Questions (FAQs)
- Who should use the Fashion & Apparel KPI Dashboard in Power BI?
Fashion retailers, apparel manufacturers, merchandisers, store managers, and eCommerce teams can use this dashboard.
- Do I need technical skills to use this dashboard?
No. Power BI is simple and easy. You only select filters and review visuals.
- Can I use my own Excel data?
Yes. You only need to fill the three Excel sheets: Actuals, Targets, and KPI Definitions.
- Can I track both MTD and YTD performance?
Yes. The dashboard displays separate visuals for MTD and YTD numbers.
- Can I customize the KPIs?
Yes. You can add or remove KPIs in the Excel file based on your business need.
- Does the dashboard support previous year comparison?
Yes. You can compare both MTD and YTD performance with previous year numbers.
- Can I view KPI definitions?
Yes. You can drill through to the KPI Definition page to check formulas and descriptions.
Visit our YouTube channel to learn step-by-step video tutorials
Watch the step-by-step video tutorial:
Click to buy Fashion & Apparel KPI Dashboard in Power BI