Housing and urban development departments manage thousands of activities every month. They work with public housing projects, construction approvals, urban planning, land allocation, budget usage, and community development programs. Because these responsibilities impact every citizen’s daily life, teams need a fast and reliable way to track performance. This is where the Housing & Urban Development KPI Dashboard in Power BI becomes a game-changing tool.
The dashboard turns raw data into clear visuals so leaders understand what is working well and what needs improvement. It also brings all KPIs into one place, so teams save time and take better decisions. In this detailed blog post, you will discover what this dashboard is, how it works, its key features, advantages, best practices, and answers to important questions.
Click to buy Housing & Urban Development KPI Dashboard in Power BI
What Is a Housing & Urban Development KPI Dashboard in Power BI?
A Housing & Urban Development KPI Dashboard in Power BI is an interactive reporting tool that tracks the key performance indicators related to housing, infrastructure, construction projects, community facilities, and urban planning activities.
Power BI helps teams:
- Monitor project performance in real time
- Track MTD and YTD progress
- Compare actual vs target values
- Identify delays or overspending instantly
- Analyze trends and year-over-year improvement
With this dashboard, leaders inside housing boards, municipal corporations, smart city projects, and government planning departments make faster and more informed decisions.
Why Do Urban Development Departments Need a KPI Dashboard?
Urban development activities grow complex every year. Teams handle multiple ongoing projects such as:
- Affordable housing construction
- Road expansion programs
- Sewerage system upgrades
- Land development
- Community facility improvements
- Building approvals
- Environmental planning
Because so many teams work together, managers need full visibility. A dashboard removes guesswork and brings clarity.
Key Features of the Housing & Urban Development KPI Dashboard in Power BI
This dashboard contains three main pages, each designed to give a unique view of departmental performance.
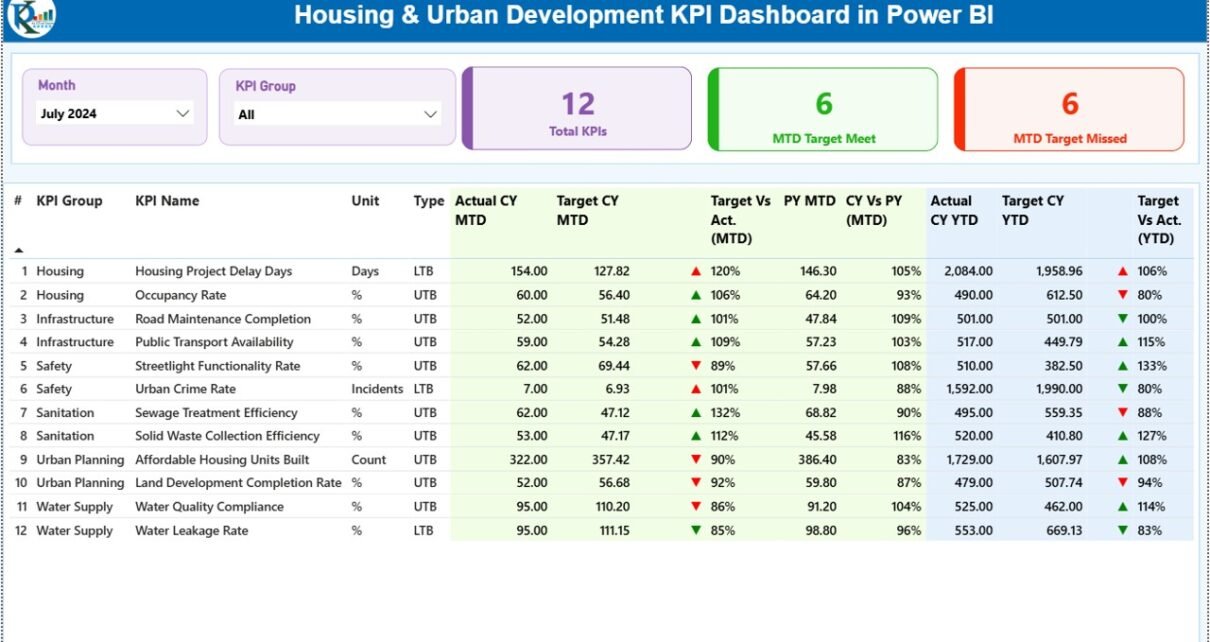
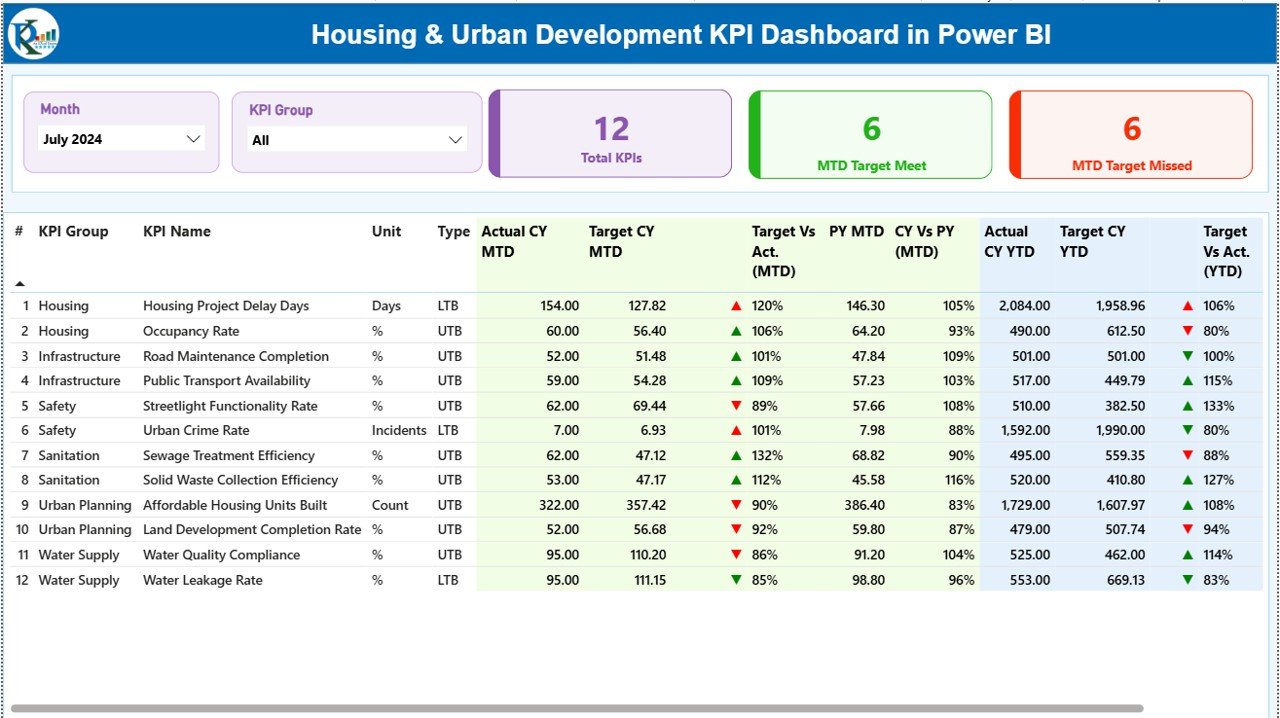
Summary Page – What Does It Show?
The Summary Page is the heart of the dashboard. It gives an instant overview of all KPIs.
Top Area: Filters and Overview Cards
Users can quickly select:
- Month
- KPI Group
These slicers help users focus on the exact period or category they want to review.
The page also displays three important KPI cards:
- Total KPIs Count
- MTD Target Met Count
- MTD Target Missed Count
These cards give a quick picture of overall performance for the selected period.
Detailed KPI Table – What Information Does It Show?
The main table includes all essential KPI fields:
- KPI Number
- KPI Group
- KPI Name
- Unit of Measurement
- KPI Type (LTB – Lower the Better / UTB – Upper the Better)
MTD Metrics
- Actual CY MTD
- Target CY MTD
- MTD Icon (Green ▲ or Red ▼)
- Target vs Actual (MTD %)
- PY MTD
- CY vs PY (MTD %)
YTD Metrics
- Actual CY YTD
- Target CY YTD
- YTD Icon (Green ▲ or Red ▼)
- Target vs Actual (YTD %)
- PY YTD
- CY vs PY (YTD %)
This structured view makes it easy to see month-wise and year-wise progress with clear signals.
Click to buy Housing & Urban Development KPI Dashboard in Power BI
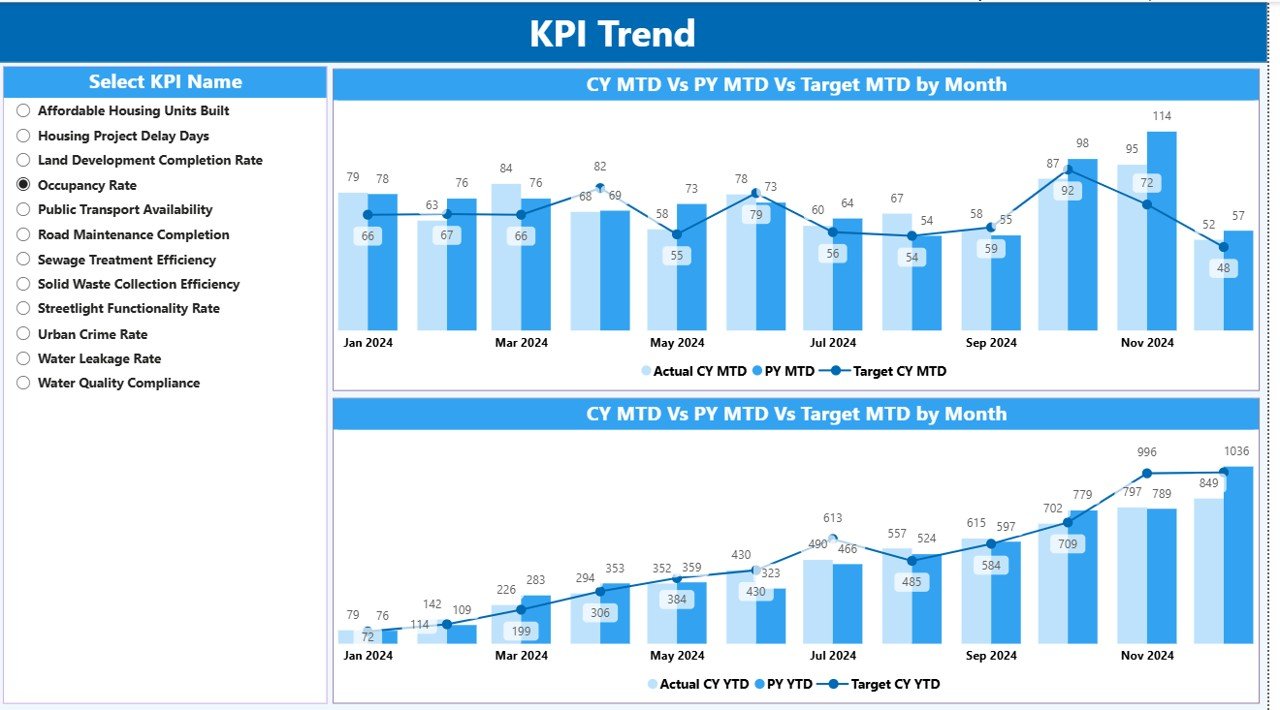
KPI Trend Page – Why Is Trend Analysis Important?
Trends help departments track long-term improvement. This page displays two powerful combo charts:
- MTD Trend Chart
- YTD Trend Chart
Both charts show:
- Current Year Actuals
- Previous Year Actuals
- Current Year Targets
A slicer on the left allows users to pick any specific KPI and instantly review:
- Performance improvements
- Monthly patterns
- Deviations
- Seasonal changes
This page supports strategic planning and forecasting.
Click to buy Housing & Urban Development KPI Dashboard in Power BI
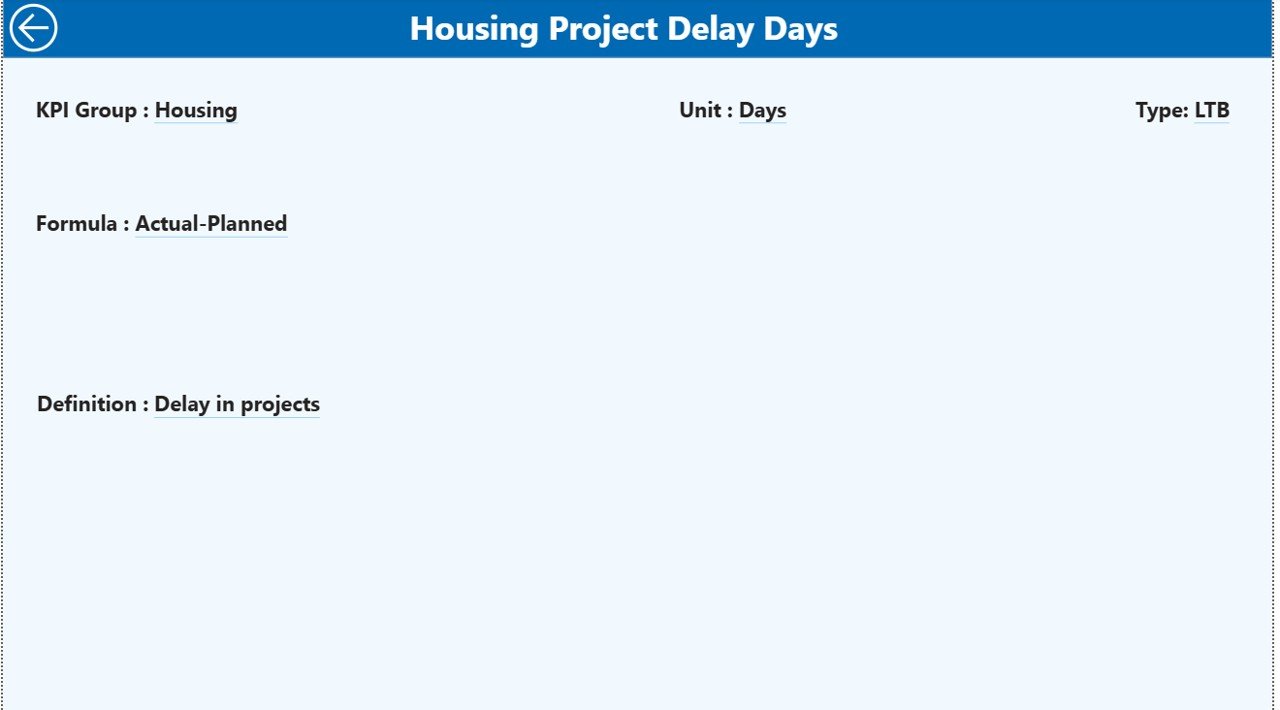
KPI Definition Page – Why Do Users Need This?
This drill-through page gives detailed information about every KPI:
- Formula
- Description
- Unit
- Type (LTB / UTB)
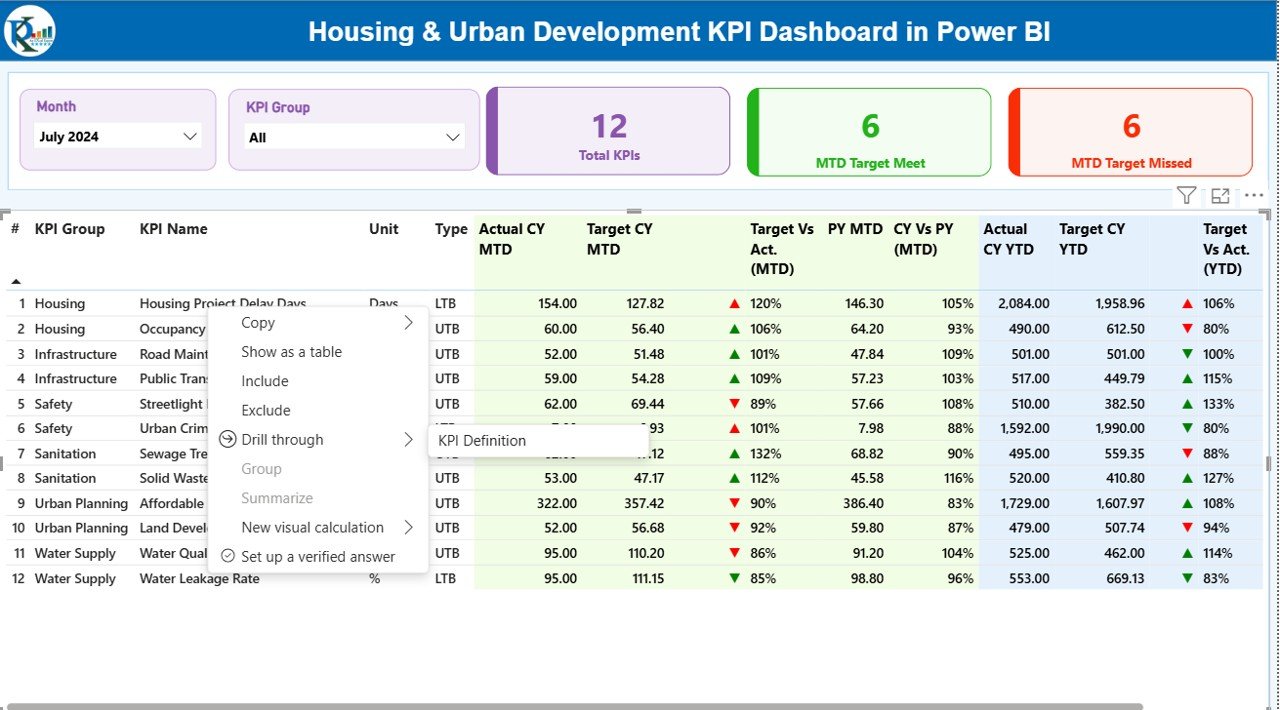
Users reach this page by right-clicking any KPI on the Summary Page and selecting “Drill Through”.
This page ensures everyone understands what each KPI means, how it is calculated, and why it matters.
How Does the Excel Data Source Work?
The dashboard collects its data from an Excel file with three sheets:
Click to buy Housing & Urban Development KPI Dashboard in Power BI
Input_Actual Sheet
Users fill:
- KPI Name
- Month (first date of the month)
- MTD numbers
- YTD numbers
Input_Target Sheet
Users enter:
- KPI Target values
- Month
- MTD target
- YTD target
KPI Definition Sheet
Users add:
- KPI Number
- KPI Group
- KPI Name
- Unit
- Formula
- Definition
- KPI Type
Because the Excel file is simple and structured, anyone can update the data without technical skills.
Click to buy Housing & Urban Development KPI Dashboard in Power BI
What KPIs Can You Track in Housing & Urban Development?
Different departments track different KPIs. Here are the most common ones:
Housing Development KPIs
- Number of housing units constructed
- Cost per housing unit
- Occupancy rate
- Construction progress %
- Affordable housing approvals
Urban Planning KPIs
- Number of building plans approved
- Average approval time
- Land development progress
- Environmental compliance rate
Infrastructure KPIs
- Road construction progress
- Sewerage network expansion
- Water pipeline coverage
- Public facility upgrades
Community Development KPIs
- Number of community projects completed
- Budget utilization rate
- Citizen satisfaction score
- Number of complaints resolved
This dashboard allows all these KPIs to appear in one place.
Advantages of the Housing & Urban Development KPI Dashboard in Power BI
Clear Visibility for Better Decision-Making
Managers see every department’s real-time performance in one view.
Faster Problem Detection
The red and green icons reveal issues instantly so teams act quickly.
Accurate Budget Tracking
Departments track target vs actual progress for MTD and YTD numbers.
Improved Accountability
Each KPI links to a department and responsible team.
Easy Data Entry
The Excel input sheets make updates simple and quick.
Better Planning with Trends
Trend charts help managers predict upcoming risks and allocate resources well.
Enhanced Transparency
When performance is visible to everyone, communication improves.
Why Should Cities Use Power BI for Urban Development?
Power BI is affordable, scalable, and easy to use. Government teams get:
- Interactive reports
- Clean visuals
- Automated refresh
- Drill-through views
- Easy distribution across departments
This makes Power BI an ideal solution for smart city projects and public sector reporting.
Best Practices for Using the Housing & Urban Development KPI Dashboard
- Update Data Every Month
Fresh data ensures accurate reporting.
- Keep KPI Definitions Clear
Everyone should understand the meaning of each KPI.
- Use KPI Groups for Better Organization
Examples: Housing, Infrastructure, Planning, Finance, Community.
- Follow LTB and UTB Rules
Always categorize KPIs correctly.
- Compare Current Year with Previous Year
This reveals efficiency and improvement.
- Highlight Critical KPIs
Focus on delays, overspending, or missed targets.
-
Limit Manual Work
Automate data refresh where possible.
How Can Teams Use This Dashboard in Daily Work?
Teams across departments use this dashboard to:
- Review monthly meetings
- Track ongoing construction
- Monitor infrastructure growth
- Review budgets and delays
- Improve citizen service delivery
- Prepare reports for leadership
It becomes the single source of truth for planning and performance review.
Conclusion – A Smarter Way to Manage Housing & Urban Development
Housing and urban development departments work on projects that shape the future of cities. Because these projects require accuracy and speed, teams need modern tools to track performance. The Housing & Urban Development KPI Dashboard in Power BI helps teams understand progress, highlight issues, and plan better.
It brings all KPIs together, shows MTD and YTD performance, highlights target gaps, and reveals long-term trends. As a result, leaders make better decisions and deliver better services to citizens.
This dashboard is simple to use, easy to update, and powerful enough to transform the way departments monitor performance.
Frequently Asked Questions (FAQs)
- What is a Housing & Urban Development KPI Dashboard?
It is a Power BI dashboard that tracks performance indicators related to housing, infrastructure, planning, and urban development activities.
- Who can use this dashboard?
Housing boards, smart city teams, municipal departments, planning authorities, and government project managers.
- Can I add custom KPIs?
Yes, you can add new KPIs in the Excel definition sheet and Power BI automatically updates them.
- How often should I update the data?
Monthly updates are ideal, but departments may update weekly depending on project needs.
- Is Power BI easy to use for government teams?
Yes, because Power BI uses simple visuals and an Excel-based data source that anyone can manage.
- Can I compare performance with last year?
Yes, MTD and YTD comparison with previous year values is included in the dashboard.
- What skills are required to use it?
Basic Excel knowledge and a simple understanding of Power BI navigation.
Click to buy Housing & Urban Development KPI Dashboard in Power BI
Visit our YouTube channel to learn step-by-step video tutorials
Watch the step-by-step video tutorial: