Public transportation systems run every minute, and thousands of people depend on them for safe and reliable travel. Because of this, metro and subway operations must track performance every day. However, scattered spreadsheets and manual reports slow down decisions. Therefore, many teams now use a Metro & Subway KPI Dashboard in Excel to monitor all critical metrics in one place.
In this detailed guide, you will learn everything about this dashboard, how it works, why it matters, and how each worksheet supports smooth metro operations. You will also explore its advantages, best practices, and answers to common questions.
Click to buy Metro & Subway KPI Dashboard in Excel
What Is a Metro & Subway KPI Dashboard in Excel?
A Metro & Subway KPI Dashboard in Excel is a ready-to-use performance monitoring tool. It organizes operational, service, safety, maintenance, and passenger KPIs into a single dashboard. You can view MTD, YTD, target numbers, previous year data, and trend charts with just one click. Because the dashboard runs on Excel, you can use it without learning any complex software.
This dashboard helps metro operations teams track daily performance, compare current numbers with last year, improve planning, and solve issues before they grow.
Why Does a Metro & Subway KPI Dashboard Matter?
Metro systems handle thousands of activities every day—train movement, passenger safety checks, staff schedules, station operations, and ticketing operations. When information spreads across files, important data goes unnoticed. Therefore, a dashboard becomes essential.
Here are the key reasons why this dashboard matters:
- It brings all KPIs into one place
- It shows real-time performance numbers
- It improves decision-making
- It highlights performance gaps early
- It supports smooth reporting
- It helps track trends across the entire year
When every department looks at the same set of KPIs, coordination becomes easier and faster.
Key Features of the Metro & Subway KPI Dashboard in Excel
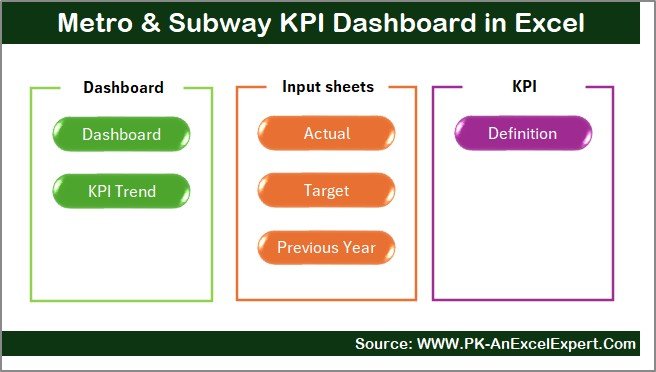
This dashboard includes 7 powerful worksheets. Each sheet plays an important role in managing data and showing performance insights. Below is a detailed explanation of each one.
Summary Page – Your Central Navigation Hub
The Summary Page works like an index page. It provides six quick navigation buttons that take you directly to any worksheet in the dashboard. Because of this, you save time while moving between pages.
You can jump to:
- Dashboard
- Trend Analysis
- Actual Input Sheet
- Target Sheet
- Previous Year Sheet
- KPI Definition Sheet
This overview page keeps everything organized and easy to access.
Click to buy Metro & Subway KPI Dashboard in Excel
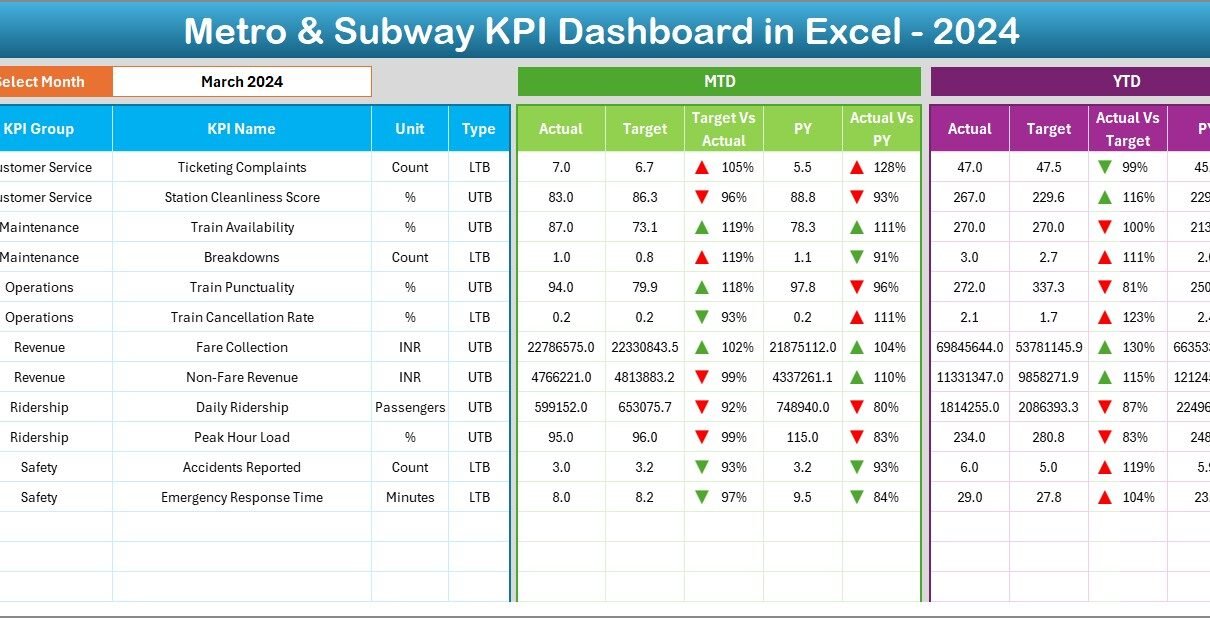
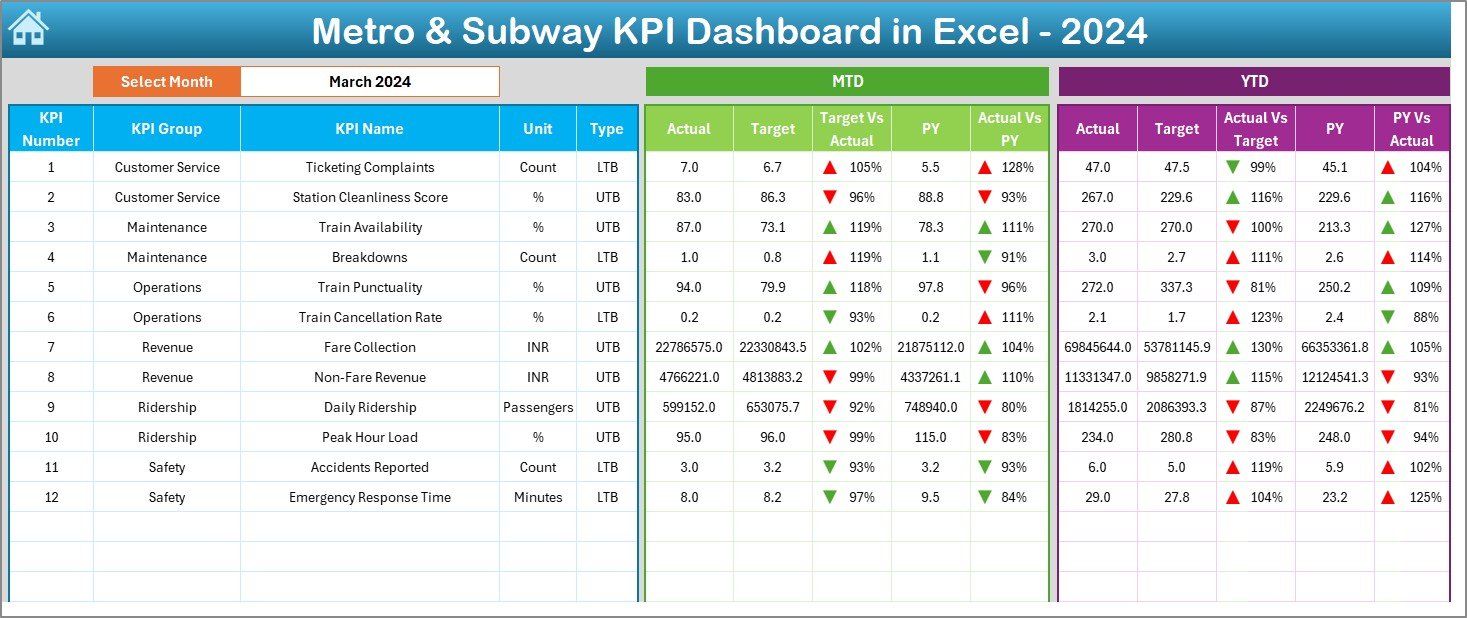
Dashboard Sheet – Complete KPI Performance View
The Dashboard Sheet is the heart of this template. It shows monthly and yearly performance numbers for every KPI. You can select the month from the drop-down in cell D3, and the entire dashboard updates instantly.
The dashboard displays:
MTD (Month-to-Date) Performance
- MTD Actual
- MTD Target
- MTD Previous Year
- Target vs Actual comparison
- PY vs Actual comparison
- Color-coded arrows that show improvement or decline
YTD (Year-to-Date) Performance
- YTD Actual
- YTD Target
- YTD Previous Year
- Target vs Actual comparison
- PY vs Actual comparison
- Trend arrows for clear insight
This sheet helps metro managers understand performance gaps quickly. They can see whether KPIs fall above or below target and whether the current month performs better than the previous year.
Click to buy Metro & Subway KPI Dashboard in Excel
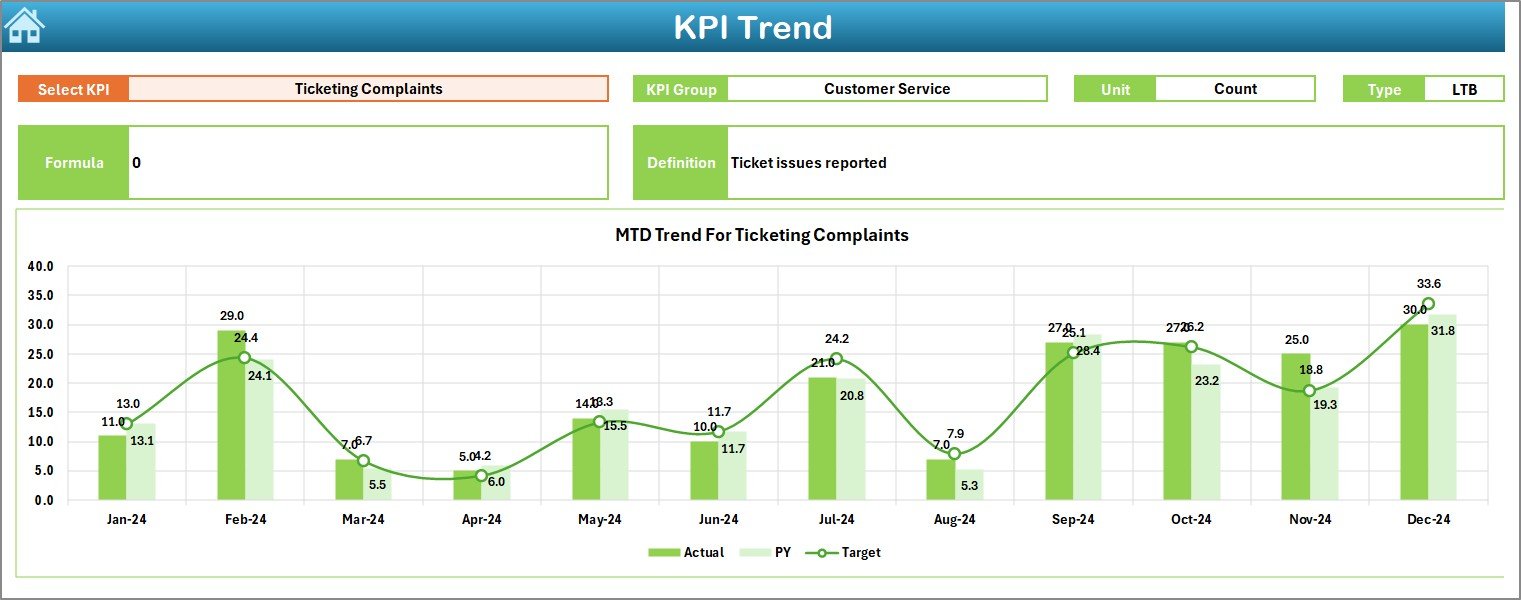
Trend Sheet – KPI-Wise Trend Analysis
The Trend Sheet helps you study a specific KPI in detail. You can select any KPI name from the drop-down in cell C3. Once you choose a KPI, the sheet displays:
- KPI Group
- Unit of measurement
- KPI Type (Lower the Better or Upper the Better)
- KPI Formula
- KPI Definition
Along with this information, you also see:
Trend Chart for MTD
This visual shows how the KPI performs across months for Actual, Target, and Previous Year values.
Trend Chart for YTD
This chart helps you understand the overall yearly performance pattern.
Trend charts make it easy to identify whether performance improves, declines, or remains stable.
Click to buy Metro & Subway KPI Dashboard in Excel
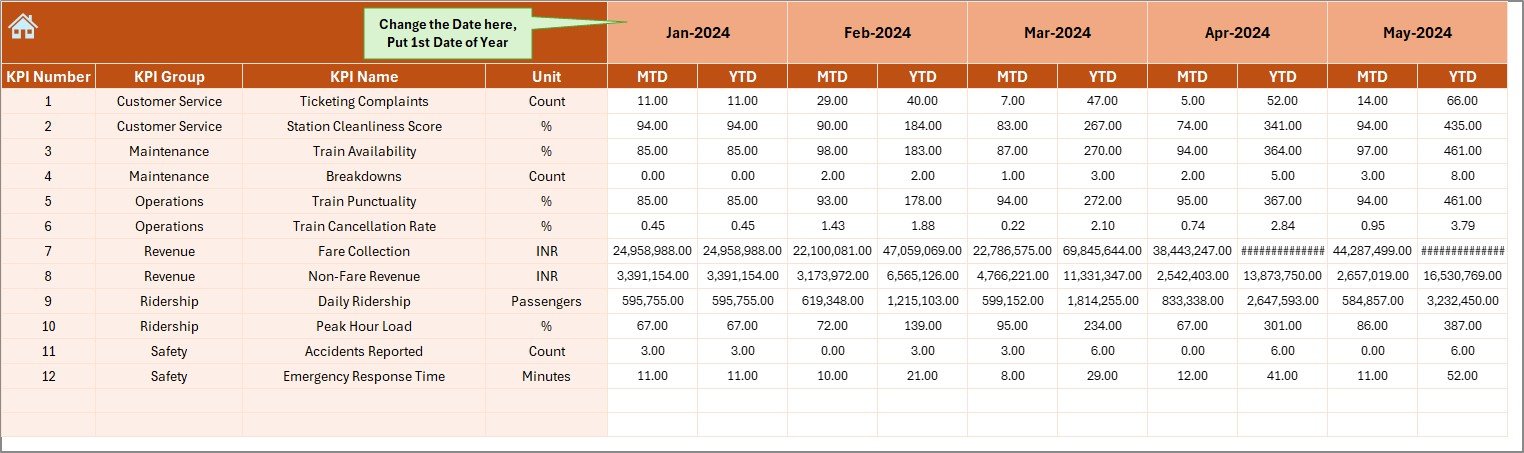
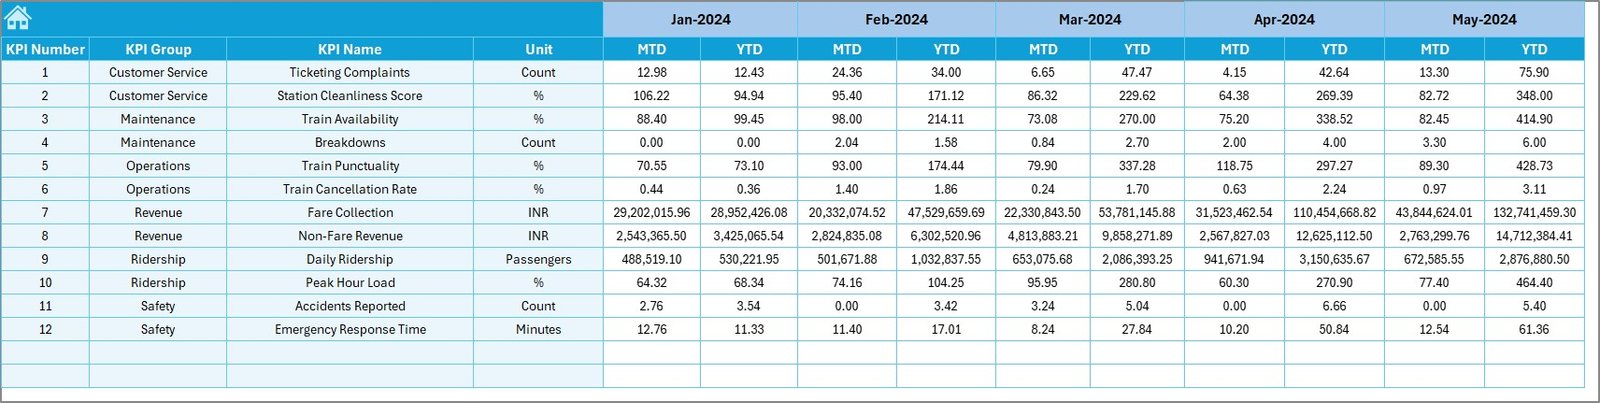
Actual Numbers Input Sheet – Enter Actual MTD/YTD Values
This sheet is designed for data entry. You enter the actual MTD and YTD values for each month. You only need to set the starting month in cell E1, and the sheet adjusts automatically.
Key benefits of this sheet:
- Helps maintain clean and structured data
- Ensures monthly numbers remain correct
- Supports dashboard calculations
- Updates visuals instantly when data changes
Click to buy Metro & Subway KPI Dashboard in Excel
Target Sheet – Store All KPI Target Values
This sheet allows you to store the official target numbers for both MTD and YTD. When the month changes, the dashboard automatically picks the correct target.
You can:
- Set monthly targets
- Adjust numbers anytime
- Maintain consistent tracking
- Compare target vs actual easily
Targets help teams stay focused and maintain operational discipline.
Click to buy Metro & Subway KPI Dashboard in Excel
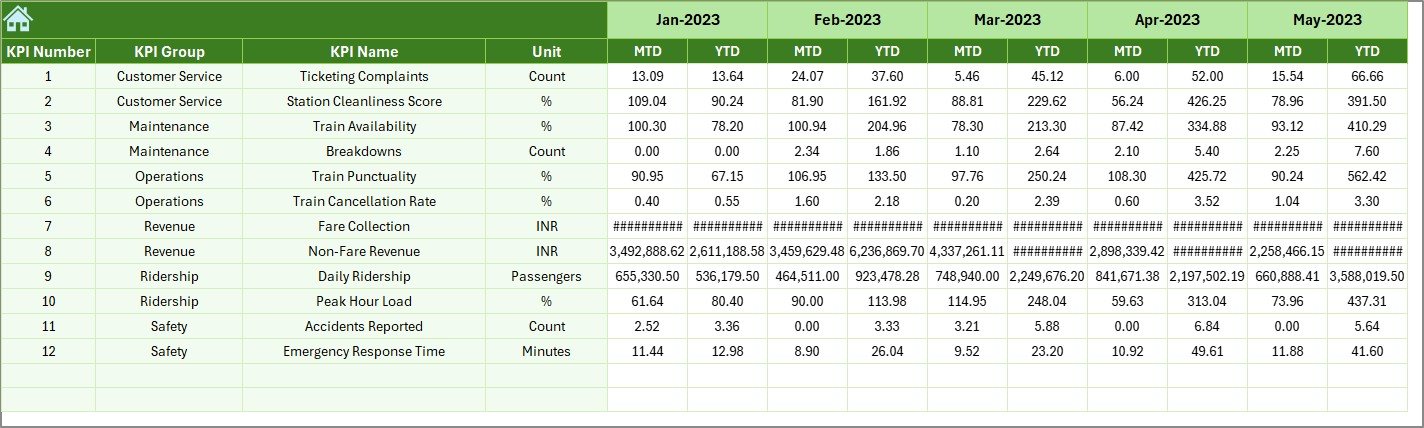
Previous Year Numbers Sheet – Compare Year-over-Year Performance
This sheet contains previous year MTD and YTD data. You enter the numbers in the same format as the current year. Because year-over-year comparison shows improvement clearly, this sheet becomes extremely important.
Managers can study:
- Whether service quality improved
- Whether train delays reduced
- Whether fuel or electricity consumption changed
- Whether passenger demand grew
This insight helps teams plan better for the future.
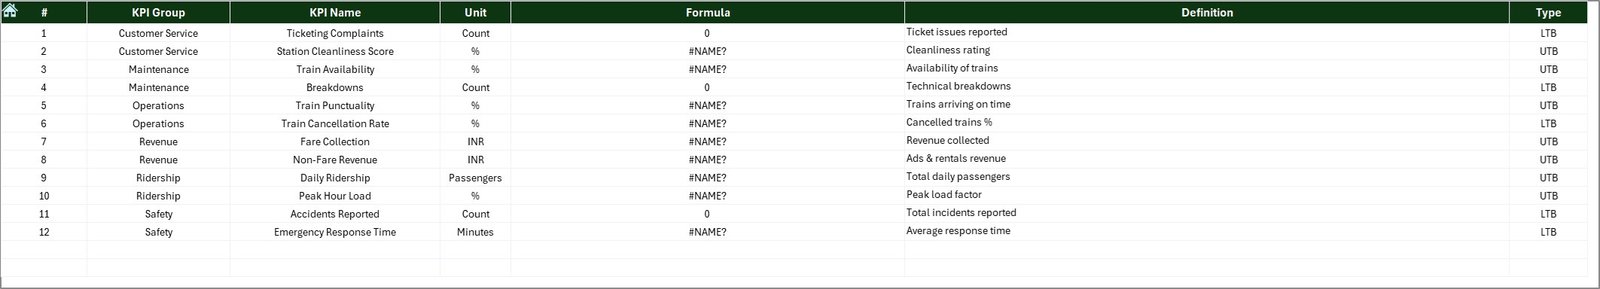
KPI Definition Sheet – Maintain Clear KPI Documentation
This sheet stores:
- KPI Name
- KPI Group
- KPI Unit
- KPI Formula
- KPI Definition
Clear definitions help teams understand every metric without confusion. When all departments follow the same meaning of KPIs, the entire reporting system becomes stronger.
Click to buy Metro & Subway KPI Dashboard in Excel
Top KPIs That Metro & Subway Operations Should Track
A Metro & Subway KPI Dashboard in Excel works best when you track the right metrics. Here are the most useful KPIs for metro systems:
- Train Punctuality
- Service Reliability
- Train Frequency
- Passenger Per Trip
- Passenger Complaints
- On-Time Departure
- Percentage of Scheduled Trips Completed
- Ticketing Accuracy
- Station Cleanliness Score
- Energy Consumption
- Breakdown Incidents
- Safety Compliance Score
- Revenue per Route
- Peak Hour Load
- Platform Waiting Time
These KPIs cover performance, safety, customer satisfaction, operations, and maintenance.
Advantages of Using a Metro & Subway KPI Dashboard in Excel
Metro teams gain many benefits when they use this dashboard. Below are the main advantages with clear explanations.
- Faster Decision-Making
Because the dashboard updates in one click, you can take decisions quickly. You no longer search across multiple spreadsheets. You simply select a month and instantly see all trends.
- Improved Performance Visibility
You can see MTD and YTD numbers at the same time. This clear view supports long-term planning and helps teams stay aligned with yearly targets.
- Accurate Comparison of Actual, Target, and Previous Year Data
The dashboard shows how current performance compares with your goals and with last year. This helps you understand whether operations improve or decline.
- Easy Trend Analysis
Trend charts help teams understand long-term behavior. As a result, you can identify issues early and take corrective steps at the right time.
- Better Internal Communication
Teams across operations, safety, maintenance, and finance use the same dashboard. This reduces confusion and improves collaboration.
- No Need for Complex Tools
You only need Excel. You don’t need expensive software or technical training. This makes the dashboard accessible for everyone.
- Saves Time in Reporting
Because all sheets link together automatically, monthly reporting becomes quick and smooth.
How to Use the Metro & Subway KPI Dashboard Effectively
To get the maximum value from this dashboard, you can follow the simple steps below:
- Enter all KPI definitions first
- Enter previous year numbers
- Enter monthly target values
- Enter actual MTD/YTD values on time
- Select a month in the dashboard
- Review gap analysis (Target vs Actual and PY vs Actual)
- Analyze trend charts
- Take action based on insights
This workflow ensures accurate and reliable data every month.
Best Practices for the Metro & Subway KPI Dashboard
Following best practices helps you keep the dashboard fast, clean, and accurate.
- Update Data on the Same Day Every Month
Use a fixed schedule for entering data. This ensures consistency.
- Define Each KPI Clearly
Use the KPI Definition sheet to maintain clear documentation. This reduces confusion.
- Keep File Size Low
Delete unused rows and avoid unnecessary formatting. This keeps Excel fast.
- Protect Formula Cells
Lock formula cells to avoid accidental changes.
- Use Data Validation for Clean Input
Dropdowns help reduce errors while entering KPI names, months, or units.
- Review Trend Charts Regularly
Charts show early warnings. Use them every week for better planning.
- Share the Dashboard with All Departments
Use it as a central performance communication tool.
Conclusion
A Metro & Subway KPI Dashboard in Excel offers a simple but powerful way to track performance. It gives you complete visibility of operational, safety, customer service, and maintenance KPIs. You get instant access to MTD, YTD, target, and previous year numbers in a structured format. Because the dashboard uses Excel, anyone can use it without technical knowledge.
This dashboard improves planning, teamwork, and decision-making. With clear KPI definitions, easy data entry sheets, trend charts, and a dedicated dashboard page, metro operations stay organized and efficient. As a result, your team stays ahead and solves issues before they grow.
Frequently Asked Questions (FAQs)
- What is a Metro & Subway KPI Dashboard in Excel?
It is a performance monitoring system that tracks KPIs such as train punctuality, ridership, delays, safety, maintenance, and revenue using Excel.
- Can a beginner use this dashboard?
Yes. This dashboard uses simple drop-downs, clear worksheets, and easy navigation buttons. Any user with basic Excel knowledge can use it.
- What is the use of trend charts in this dashboard?
Trend charts help you study performance changes across months. Because trends show patterns clearly, you can find problems and take action quickly.
- How does the dashboard compare target and actual numbers?
You enter monthly target and actual values. The dashboard automatically calculates the differences and shows improvements or declines.
- Can I add more KPIs to the dashboard?
Yes. You can add more KPIs in the KPI Definition sheet and update the data input sheets based on your needs.
- Does this dashboard support YTD analysis?
Yes. The dashboard shows both MTD and YTD numbers along with target and previous year comparisons.
- Why should metro teams use Excel instead of other tools?
Excel is simple, widely available, and easy to customize. You don’t need complex software or technical setup.
Visit our YouTube channel to learn step-by-step video tutorials
Watch the step-by-step video tutorial:
Click to buy Metro & Subway KPI Dashboard in Excel