Water plays a major role in every industry, community, and city. Because demand keeps rising and clean water sources stay limited, organizations need a simple way to track how well they use, store, and conserve water. Water managers, project leads, plant operators, and government teams want quick insight into how much water they consume, how much they lose, and how well they treat or recycle it. However, teams struggle when data stays scattered across many files, manual notes, and month-end summaries.
A Water Resource Management KPI Dashboard in Excel solves this problem in a very simple and powerful way. It brings all key performance indicators into one easy-to-read dashboard. Users can track daily, monthly, and yearly values without complex tools. Because it runs entirely in Excel, it works for any team and offers full control without needing any coding.
In this detailed guide, you will learn what this dashboard is, how it works, what each worksheet includes, and how teams can use it to improve water management. You will also learn the key advantages, best practices, and answers to common questions.
Click to buy Water Resource Management KPI Dashboard in Excel
What Is a Water Resource Management KPI Dashboard in Excel?
A Water Resource Management KPI Dashboard in Excel is a ready-to-use tool that helps organizations measure, monitor, and improve their water-related performance. It converts raw data into clean visuals, KPI cards, comparison charts, and monthly trends. Because the dashboard stays fully automated, users only update the basic input sheets, and Excel updates the entire report.
Teams across industries use this dashboard to track:
- Water consumption
- Water treatment efficiency
- Water recycling rate
- Groundwater level changes
- Rainwater harvesting output
- Leak percentage
- Pump energy usage
- Storage tank levels
- Distribution efficiency
Since Excel is easy to operate, anyone can manage this dashboard. It supports planning, compliance, reporting, and decision-making.
Why Do Organizations Need a Water Resource Management Dashboard?
Water is now one of the most watched resources in the world. Many industries spend a large part of their operational budget on water usage, pumping, treatment, and discharge. Because of this, small errors or delays in tracking water metrics can cause:
- High water bills
- Waste of clean water
- System failures
- Low supply reliability
- Non-compliance penalties
When leaders see accurate MTD (Month-to-Date) and YTD (Year-to-Date) numbers, they take faster and better decisions. Moreover, real-time visibility helps them reduce waste and increase efficiency. Therefore, a well-structured KPI dashboard becomes a key tool in daily operations.
Key Features of the Water Resource Management KPI Dashboard in Excel
This dashboard includes seven interactive worksheets, each designed to help teams manage water KPIs with clarity and speed. Below is the expanded and improved explanation based on your written content:
Summary Page – A Quick Navigation Index
The Summary Page works as the index of the dashboard. It includes six navigation buttons that help users jump directly to the required worksheet. Because of these quick links, the dashboard becomes easy to explore for beginners and advanced users both.
This sheet keeps the dashboard organized and improves user experience, especially when many KPIs and months exist in the file.

Click to buy Water Resource Management KPI Dashboard in Excel
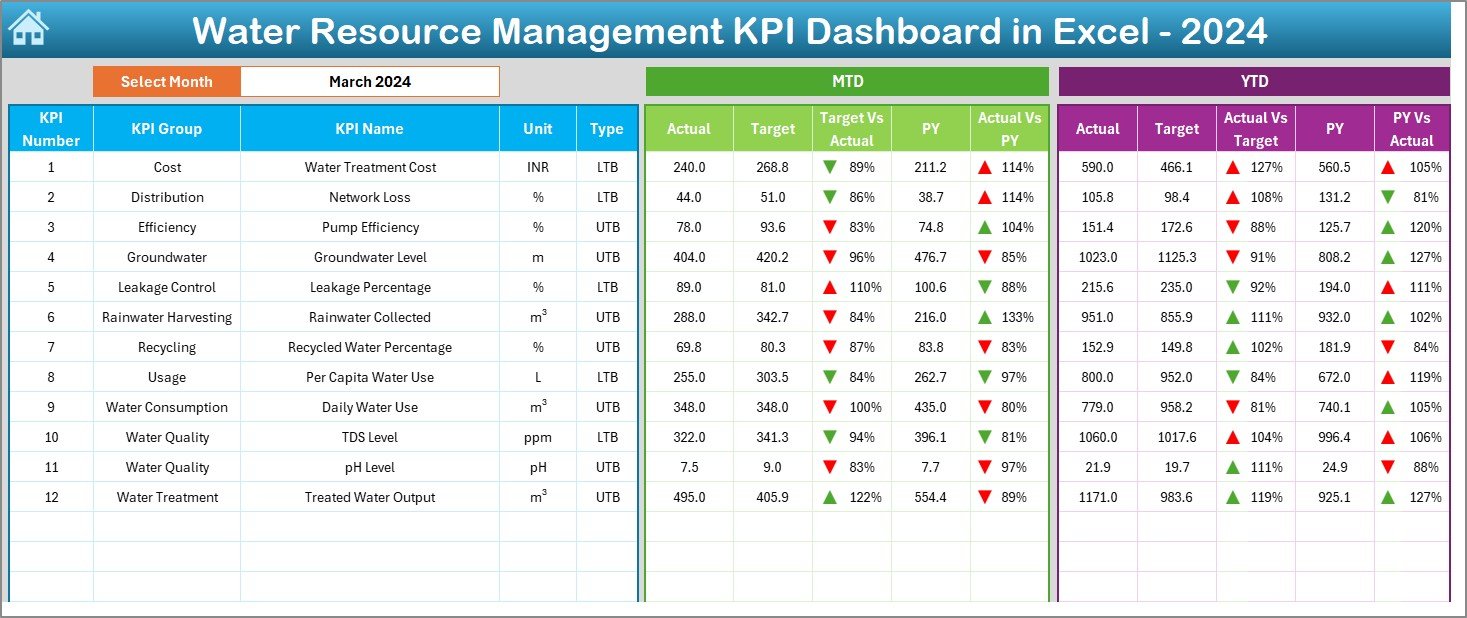
Dashboard Sheet – The Heart of the Report
The Dashboard sheet shows all KPIs in one place. It is the main reporting page where you can select the month from the drop-down in cell D3. As soon as you change the month, all KPI numbers update instantly.
On this page, users can see:
MTD Analysis
- MTD Actual
- MTD Target
- MTD Previous Year
- Target vs Actual (with up/down arrows)
- PY vs Actual (with up/down arrows)
YTD Analysis
- YTD Actual
- YTD Target
- YTD Previous Year
- YTD Target vs Actual
- YTD PY vs Actual
Conditional formatting makes the dashboard easy to understand at a quick glance. Green arrows show good performance, and red arrows show areas that need improvement. This visual clarity helps managers act faster.
Click to buy Water Resource Management KPI Dashboard in Excel
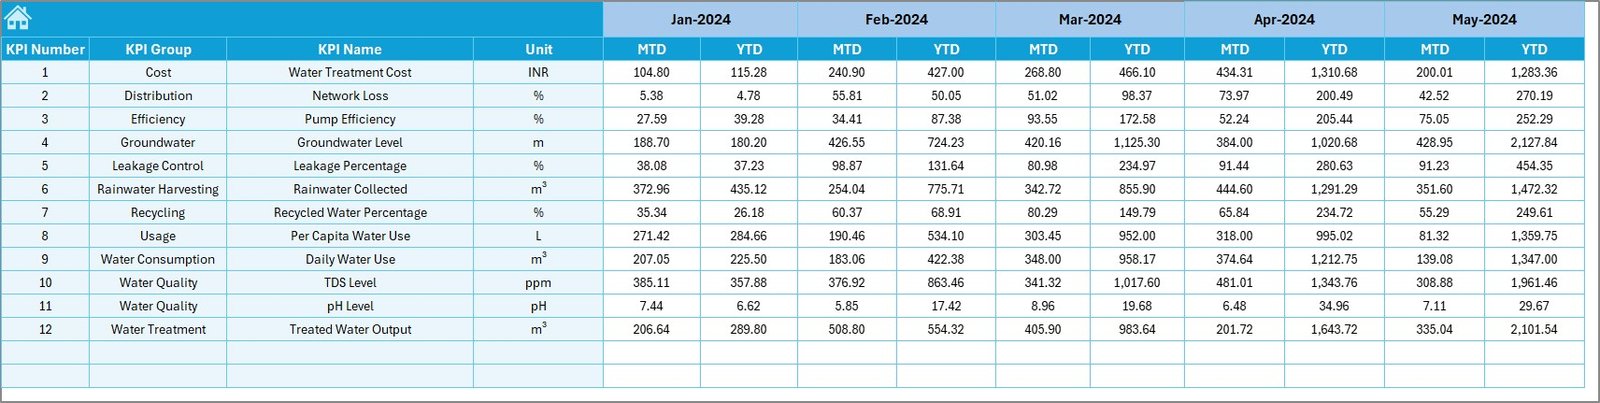
Trend Sheet – KPI Trend and Details View
The Trend sheet allows users to study the progress of each KPI over time. When you select a KPI from the drop-down in cell C3, the sheet displays:
- KPI Group
- KPI Unit
- KPI Type (Lower the Better or Upper the Better)
- KPI Formula
- KPI Definition
Along with KPI details, this sheet includes MTD and YTD trend charts for Actual, Target, and Previous Year data. These charts help users understand whether performance improves, falls, or stays stable.
Teams use this sheet to review long-term changes and plan water-saving projects based on real data.

Click to buy Water Resource Management KPI Dashboard in Excel
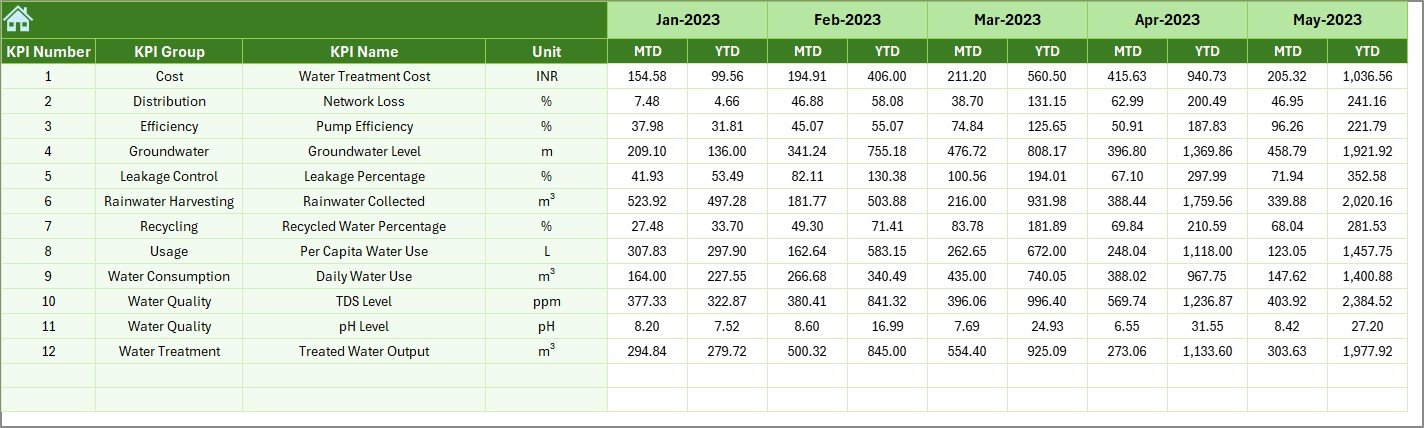
Actual Numbers Input Sheet – Enter Monthly Values Easily
The Actual Numbers Input sheet is where users enter the MTD and YTD Actual values. You can update the first month of the financial year in cell E1. After that, all months adjust automatically.
This design allows:
- Faster data entry
- Error-free monthly updates
- Automatic alignment with dashboard filters
Because the sheet stays clean and structured, teams face no confusion while entering numbers.

Click to buy Water Resource Management KPI Dashboard in Excel
Target Numbers Sheet – Set Monthly and Yearly Targets
This sheet helps managers set goals for each KPI. For every KPI, users can enter:
- MTD Target
- YTD Target
Setting correct targets helps teams compare actual performance against expected values. Since all charts and tables link to this sheet, users only need to update targets once.
Click to buy Water Resource Management KPI Dashboard in Excel
Previous Year Numbers Sheet – Compare With Historical Data
To understand real improvement, teams must compare the current year with the previous year. This sheet stores all previous-year numbers in the same format as the actual data.
Because historical data stays available, the dashboard shows:
- PY MTD
- PY YTD
- Comparison arrows
This helps managers understand seasonal patterns, performance gaps, and long-term progress.
Click to buy Water Resource Management KPI Dashboard in Excel
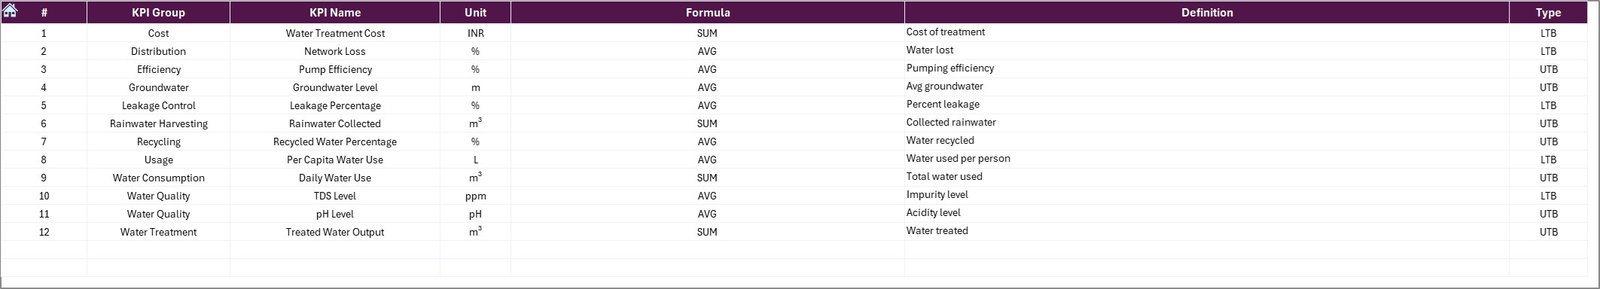
KPI Definition Sheet – Define Every KPI Clearly
This sheet includes all KPI metadata:
- KPI Name
- KPI Group
- Unit
- Formula
- KPI Definition
- KPI Type (LTB or UTB)
Teams use this sheet to ensure clarity and standardization across departments. It also helps new team members understand the meaning of each KPI without confusion.
Click to buy Water Resource Management KPI Dashboard in Excel
What KPIs Should You Track in Water Resource Management?
While each organization may track different KPIs, the following indicators are common and useful:
- Total Water Consumption
- Water Recycling Percentage
- Treated Water Output
- Groundwater Drop Rate
- Pump Energy Per KL
- Pipeline Leakage Percentage
- Rainwater Harvesting Output
- Water Treatment Efficiency
- Storage Tank Fill Levels
- Water Loss Rate in Distribution
Because businesses vary in size and structure, the dashboard allows customization of KPIs as required.
How Does a Water Resource Management Dashboard Improve Decision-Making?
A well-designed dashboard does more than show numbers. It helps teams understand where they stand and what actions they must take. With month-wise insights, yearly comparison, and trend analysis, teams get clarity in areas such as:
- Water usage planning
- Resource allocation
- Leak detection
- Cost reduction
- Compliance auditing
- Maintenance scheduling
Because the dashboard updates instantly, decisions become faster and more accurate.
Advantages of a Water Resource Management KPI Dashboard in Excel
A dedicated section on advantages helps readers understand why the dashboard is a valuable tool.
- Easy to Use and No Learning Curve
Excel is simple and familiar for every user. Anyone can update data without training.
- Real-Time Insights
As soon as you update monthly numbers, the dashboard changes the complete analysis.
- Helps Reduce Water Waste
Trends and comparisons highlight areas where water loss happens.
- Supports Planning and Reporting
Managers use this dashboard for internal reviews, audits, and yearly planning.
- Improves Operational Efficiency
Teams act faster because they see accurate performance at all times.
- Fully Customizable
Users can add, remove, or rename KPIs based on their industry needs.
- Saves Time
Manual reports take hours, whereas this dashboard finishes the job in seconds.
Best Practices for Using the Water Resource Management KPI Dashboard
To get maximum value, follow these practical best practices:
- Update Data Every Month
Timely inputs keep the dashboard accurate and useful.
- Use Clear KPI Definitions
Well-defined KPIs avoid confusion in reporting and decision-making.
- Compare Actuals With Both Target and Previous Year
Dual comparison gives a complete picture of growth.
- Review Trend Charts Regularly
Trends help managers predict future performance and plan actions early.
- Keep Data Sheets Clean
Delete unnecessary rows and avoid merging cells to maintain accuracy.
- Set Realistic Targets
Unrealistic goals confuse teams and reduce productivity.
- Use Conditional Formatting Smartly
Color coding helps teams understand performance quickly.
Conclusion
Water management plays a key role in sustainable operations. When teams understand how water flows, where it gets used, and how much loss occurs, they take smart decisions. A Water Resource Management KPI Dashboard in Excel becomes the simplest and strongest tool to monitor all water-related KPIs. It offers real-time clarity, saves time, improves decisions, and helps organizations reduce waste.
Because the dashboard includes Summary, Dashboard, Trend, Input, Target, Previous Year, and KPI Definition sheets, it becomes a complete solution for any team. When used correctly, it supports better planning, lower costs, and improved sustainability.
Frequently Asked Questions (FAQs)
- Who should use a Water Resource Management KPI Dashboard?
Water managers, plant supervisors, sustainability teams, auditors, and project leaders benefit from this dashboard.
- Can beginners operate this dashboard easily?
Yes, the dashboard runs in Excel and uses simple drop-downs and input sheets.
- Can we add more KPIs to the dashboard?
Yes, users can add as many KPIs as they need by updating the KPI Definition and input sheets.
- How often should I update the Actual and Target numbers?
Monthly updates give the best results, but teams can also update weekly if needed.
- Does the dashboard work for both small and large organizations?
Yes, it works for plants, industries, offices, and government water departments.
- Why compare with the previous year?
It helps understand seasonal changes and long-term improvement.
- Can I customize charts and colors?
Yes, the dashboard allows full customization because it is built in Excel.
Visit our YouTube channel to learn step-by-step video tutorials
Watch the step-by-step video tutorial:
Click to buy Water Resource Management KPI Dashboard in Excel