The plastics manufacturing industry faces constant pressure to improve productivity, control costs, reduce waste, and meet strict quality standards. However, many manufacturers still depend on manual Excel reports, delayed performance reviews, and disconnected data sources. As a result, decision-making becomes slow and reactive.
That is exactly where a Plastics Manufacturing KPI Dashboard in Power BI becomes essential.
Instead of reviewing scattered reports, plant managers, operations heads, and executives can view all critical KPIs in one interactive dashboard. Moreover, Power BI transforms raw production data into meaningful insights that support faster and smarter decisions.
This detailed article explains what a Plastics Manufacturing KPI Dashboard in Power BI is, how it works, its page-wise structure, Excel data design, advantages, best practices, and frequently asked questions.
Click to buy Plastics Manufacturing KPI Dashboard in Power BI
What Is a Plastics Manufacturing KPI Dashboard in Power BI?
A Plastics Manufacturing KPI Dashboard in Power BI is an interactive analytics solution designed to monitor, measure, and analyze key performance indicators across plastics production operations.
Instead of tracking KPIs in multiple spreadsheets, this dashboard consolidates production, quality, efficiency, and performance metrics into one visual report. As a result, stakeholders gain full visibility into plant performance at both monthly and yearly levels.
Because the dashboard uses Power BI for visualization and Excel as the data source, it remains flexible, scalable, and easy to maintain.
How Does a Plastics Manufacturing KPI Dashboard Improve Decision-Making?
A KPI dashboard does more than display numbers. It tells a performance story.
First, it highlights which KPIs meet targets and which KPIs miss targets. Next, it compares current performance with previous year data. Finally, it helps leaders take corrective action before issues escalate.
Because Power BI updates visuals dynamically, users can switch months, KPI groups, or specific KPIs instantly. Therefore, performance reviews become faster, clearer, and more effective.
What Are the Key Features of the Plastics Manufacturing KPI Dashboard in Power BI?
This ready-to-use dashboard includes a well-structured Power BI report with three interactive pages, supported by a clean Excel data model.
What Does the Summary Page Show?
Summary Page Overview
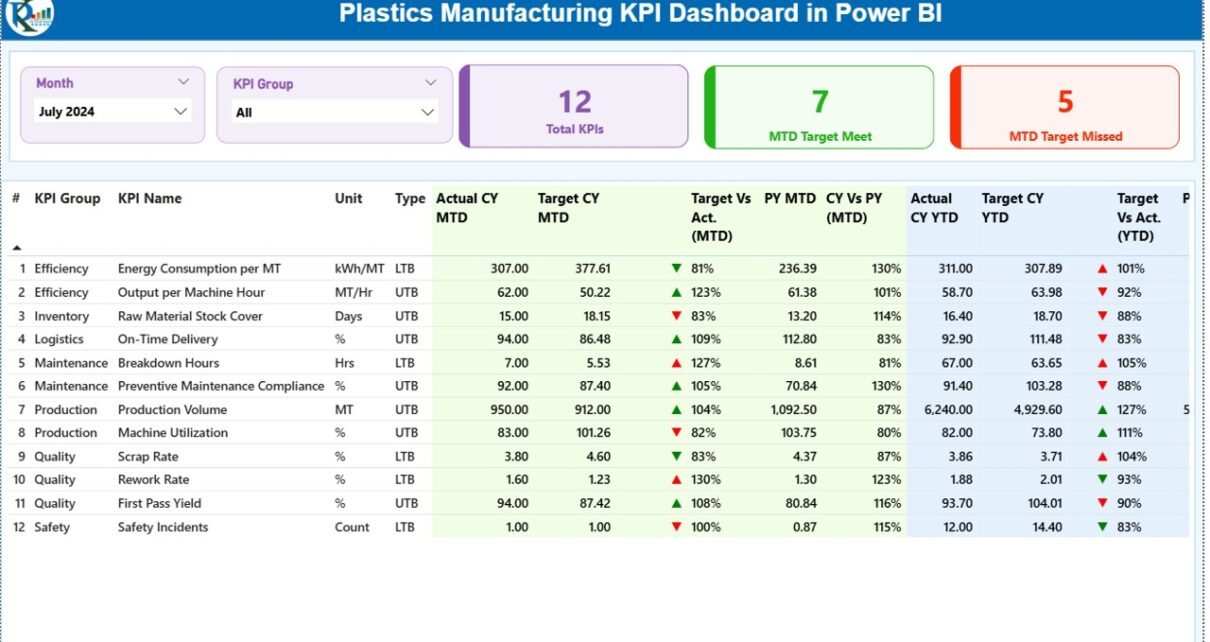
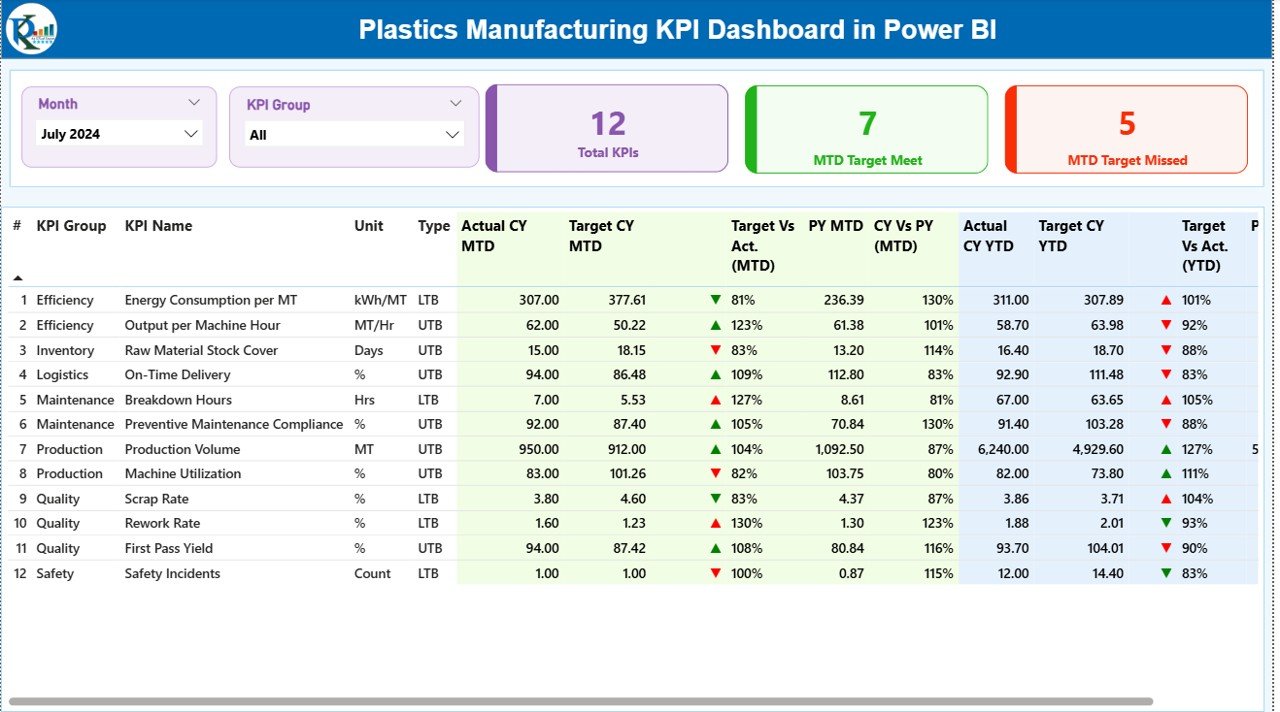
The Summary Page acts as the main control center of the dashboard. It provides a high-level snapshot of all KPIs while also allowing users to drill down into details.
Slicers on the Summary Page
At the top of the page, you can find:
- Month Slicer – Select any month to view MTD and YTD performance
- KPI Group Slicer – Filter KPIs by category such as Production, Quality, Cost, or Efficiency
These slicers instantly update all visuals on the page.
KPI Cards on the Summary Page
The Summary Page displays three important KPI cards:
- Total KPIs Count – Shows the total number of tracked KPIs
- MTD Target Met Count – Displays how many KPIs achieved targets
- MTD Target Missed Count – Highlights KPIs that missed targets
These cards help leadership quickly assess overall performance health.
Detailed KPI Table on the Summary Page
Below the cards, a detailed KPI table provides complete transparency for each KPI.
The table includes:
- KPI Number – Unique sequence number for each KPI
- KPI Group – Category or functional group of the KPI
- KPI Name – Name of the KPI
- Unit – Measurement unit such as %, Units, Tons, or Hours
- Type – UTB (Upper the Better) or LTB (Lower the Better)
MTD Performance Metrics
The Summary Page clearly displays Month-to-Date performance:
- Actual CY MTD – Current year actual MTD value
- Target CY MTD – Current year target MTD value
- MTD Icon – ▲ or ▼ with green or red color to indicate performance status
- Target vs Actual (MTD) – Percentage calculated as
Actual MTD / Target MTD - PY MTD – Previous year MTD value
- CY vs PY (MTD) – Percentage comparison of current vs previous year
Because of these metrics, users instantly understand whether performance improves or declines.
YTD Performance Metrics
The dashboard also tracks Year-to-Date performance:
- Actual CY YTD – Current year actual YTD value
- Target CY YTD – Current year target YTD value
- YTD Icon – Visual indicator of target achievement
- Target vs Actual (YTD) – Percentage calculated as
Actual YTD / Target YTD - PY YTD – Previous year YTD value
- CY vs PY (YTD) – Current vs previous year YTD comparison
Therefore, leadership can analyze long-term trends, not just monthly results.
Click to buy Plastics Manufacturing KPI Dashboard in Power BI
the KPI Trend
KPI Trend Page Overview
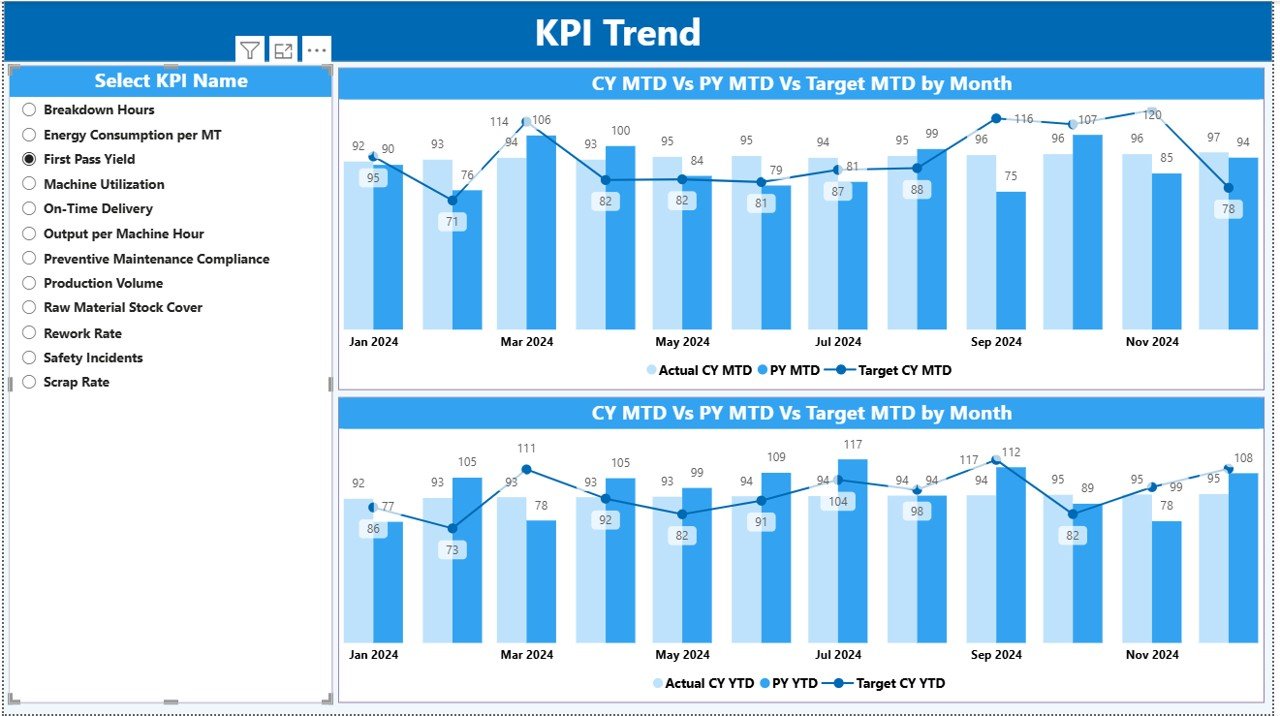
The KPI Trend Page focuses on trend analysis over time. Instead of viewing static numbers, users see how KPIs evolve month by month.
Visuals on the KPI Trend Page
This page includes two combo charts:
MTD Trend Chart
Current Year Actual
Previous Year Actual
Target Values
YTD Trend Chart
Current Year Actual
Previous Year Actual
Target Values
Because combo charts combine bars and lines, users easily compare targets with actual performance.
KPI Selection Slicer
On the left side of the page, a KPI Name slicer allows users to select any KPI.
Once selected, both charts update instantly. As a result, managers can analyze individual KPIs without changing pages.
Click to buy Plastics Manufacturing KPI Dashboard in Power BI
KPI Definition Page
KPI Definition Page Overview
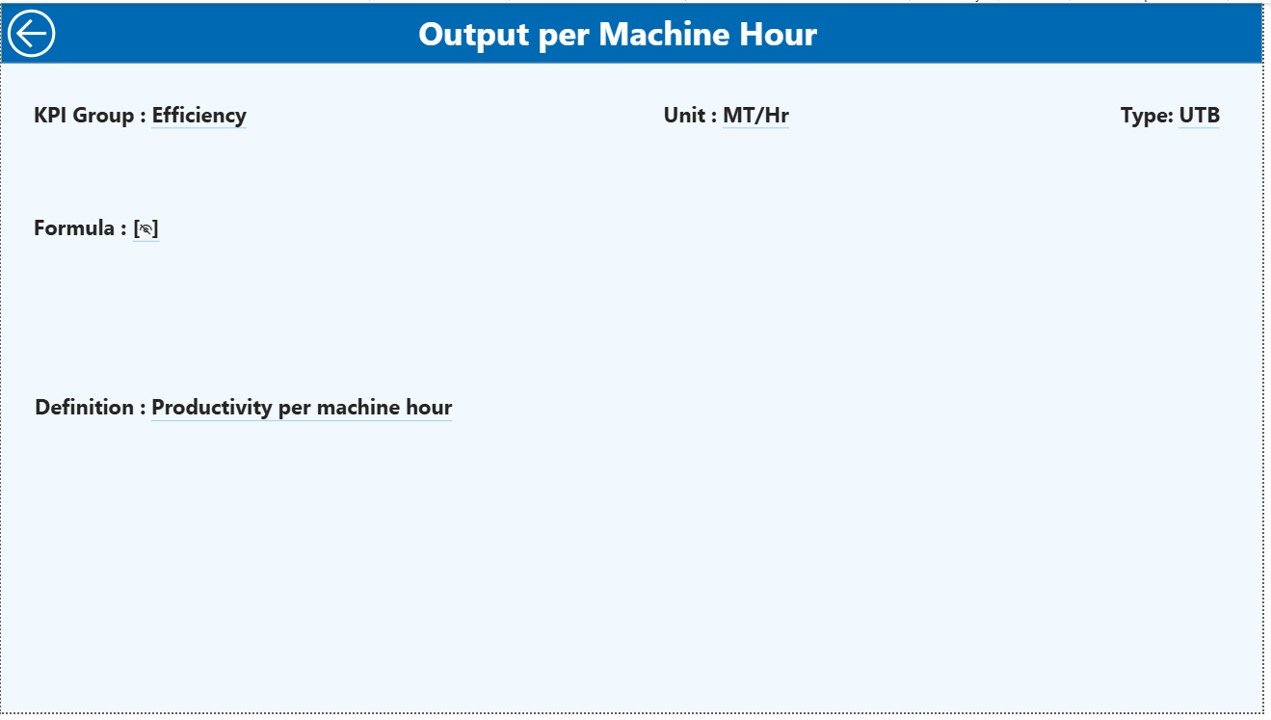
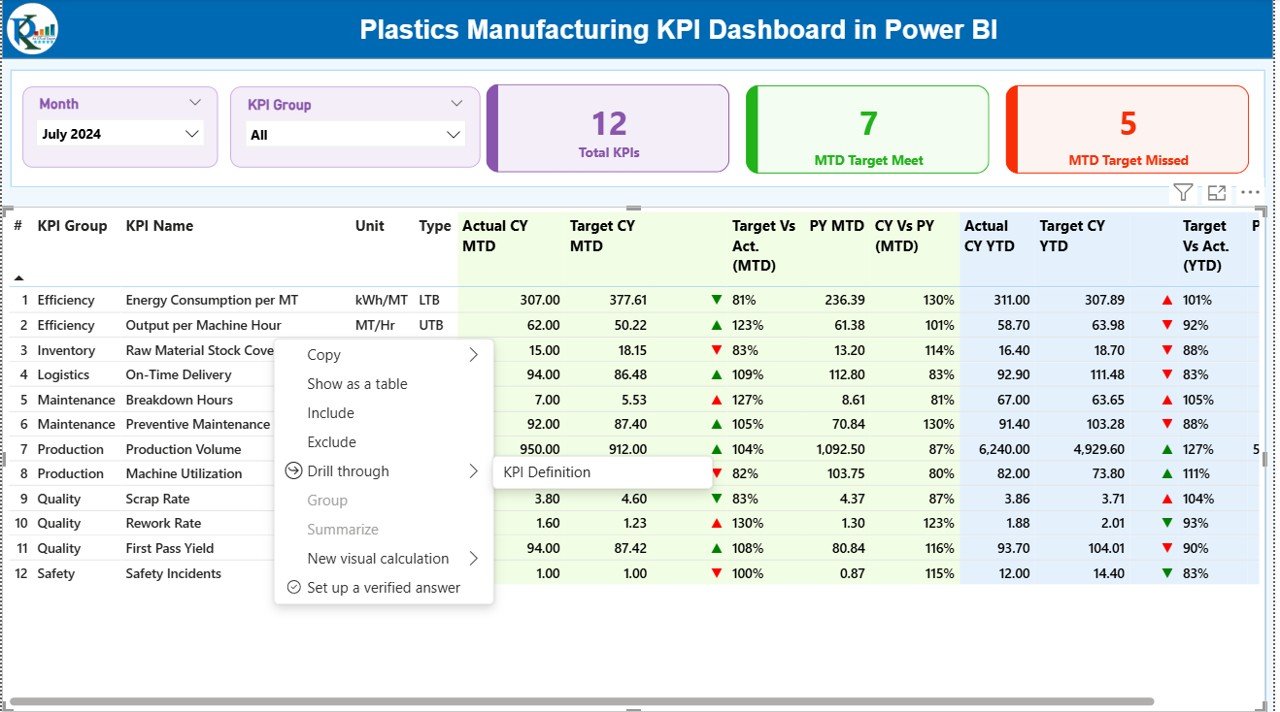
The KPI Definition Page acts as a hidden drill-through page. Although users do not see it by default, they can access it by drilling through from the Summary Page.
What Information Does the KPI Definition Page Show?
This page explains each KPI in detail, including:
- KPI Number
- KPI Name
- KPI Group
- Unit of Measurement
- Formula
- KPI Definition
- KPI Type (UTB or LTB)
Because of this page, there is no confusion about how KPIs are calculated or interpreted.
Easy Navigation
A Back Button at the top left corner helps users return to the Summary Page instantly. Therefore, navigation remains simple and user-friendly.
Click to buy Plastics Manufacturing KPI Dashboard in Power BI
How Is Excel Used as the Data Source for This Dashboard?
The Plastics Manufacturing KPI Dashboard uses Excel as its data source, which keeps data entry simple and flexible.
What Are the Excel Worksheets Used in This Dashboard?
Input_Actual Sheet
This sheet captures actual performance data.
You need to fill:
- KPI Name
- Month (use the first date of the month)
- MTD Actual Value
- YTD Actual Value
Because the structure stays clean, data refresh in Power BI remains smooth.
Input_Target Sheet
This sheet stores target values.
You need to fill:
- KPI Name
- Month (first date of the month)
- MTD Target Value
- YTD Target Value
Targets drive all performance comparisons in the dashboard.
Click to buy Plastics Manufacturing KPI Dashboard in Power BI
KPI Definition Sheet
This sheet defines each KPI.
You need to fill:
- KPI Number
- KPI Group
- KPI Name
- Unit
- Formula
- Definition
- Type (UTB or LTB)
As a result, KPI governance and consistency remain strong.
Advantages of Plastics Manufacturing KPI Dashboard in Power BI
Why Should Plastics Manufacturers Use This Dashboard?
A Plastics Manufacturing KPI Dashboard delivers several strategic benefits.
- Centralized Performance Monitoring
- Tracks all KPIs in one dashboard
- Eliminates multiple Excel reports
- Improves data clarity
- Faster Decision-Making
- Highlights underperforming KPIs instantly
- Supports proactive corrective actions
- Reduces operational delays
- Clear Target Tracking
- Shows MTD and YTD target achievement
- Uses visual icons for quick understanding
- Improves accountability across teams
- Year-Over-Year Comparison
- Compares current performance with previous year
- Identifies improvement or decline trends
- Supports strategic planning
- User-Friendly Design
- Uses simple slicers and visuals
- Requires no advanced Power BI knowledge
- Supports self-service analytics
Best Practices for Plastics Manufacturing KPI Dashboard in Power BI
How Can You Get Maximum Value from This Dashboard?
Following best practices ensures long-term success.
- Define Clear KPIs
Always define KPIs with clear formulas and ownership. Avoid vague or overlapping metrics.
- Maintain Data Accuracy
Update Excel input sheets regularly. Clean data ensures reliable insights.
- Review KPIs Monthly
Conduct monthly KPI review meetings using the Summary Page.
- Focus on Trends, Not Just Numbers
Use the KPI Trend Page to understand performance patterns over time.
- Align KPIs with Business Goals
Ensure KPIs support production efficiency, quality improvement, and cost control.
Who Should Use a Plastics Manufacturing KPI Dashboard?
This dashboard works best for:
- Plant Managers
- Production Heads
- Operations Managers
- Quality Managers
- Supply Chain Teams
- Manufacturing Executives
Because it supports both operational and strategic views, it fits organizations of all sizes.
Conclusion: Why Is a Plastics Manufacturing KPI Dashboard in Power BI a Smart Investment?
In today’s competitive manufacturing environment, relying on intuition and delayed reports no longer works. Plastics manufacturers need real-time visibility, accurate performance tracking, and clear insights.
A Plastics Manufacturing KPI Dashboard in Power BI delivers exactly that. It transforms Excel data into interactive visuals, highlights performance gaps, and supports smarter decisions.
By implementing this dashboard, organizations gain control, clarity, and confidence in their manufacturing operations.
Frequently Asked Questions (FAQs)
- What KPIs can I track in a Plastics Manufacturing KPI Dashboard?
You can track production efficiency, scrap rate, downtime, quality yield, cost per unit, energy usage, and more.
- Do I need advanced Power BI skills to use this dashboard?
No. The dashboard uses simple slicers and visuals. Basic Power BI knowledge is sufficient.
- Can I customize KPIs in this dashboard?
Yes. You can add, modify, or remove KPIs using the Excel input sheets.
- How often should I update the data?
You should update data monthly. However, you can update it more frequently if needed.
- Is Excel mandatory as the data source?
This dashboard uses Excel by default. However, Power BI can connect to other data sources if required.
Visit our YouTube channel to learn step-by-step video tutorials
Watch the step-by-step video tutorial:
Click to buy Plastics Manufacturing KPI Dashboard in Power BI