Managing port contracts involves high-value agreements, multiple vendors, long durations, and strict performance tracking. Ports handle contracts related to terminal operations, logistics, cargo handling, maintenance, dredging, security, and infrastructure services. Because of this complexity, tracking contract value, revenue, costs, renewals, and risks using manual spreadsheets quickly becomes inefficient.
That is where a Port Contract Management Dashboard in Power BI becomes essential.
This ready-to-use Power BI dashboard provides a centralized, visual, and data-driven view of all port contracts. It helps port authorities, finance teams, operations managers, and leadership teams monitor performance, identify risks, control costs, and improve decision-making.
In this article, we will explain the complete structure, key cards, charts, analysis sections, and business benefits of the Port Contract Management Dashboard in Power BI.
What Is a Port Contract Management Dashboard in Power BI?
Click to Buy Port Contract Management Dashboard in Power BI
A Port Contract Management Dashboard in Power BI is an interactive analytics solution that tracks and analyzes all contract-related data for port operations. It consolidates contract values, revenue, costs, profits, vendor performance, renewal status, and monthly trends into one centralized dashboard.
Instead of reviewing multiple files or static reports, stakeholders get:
-
Real-time contract visibility
-
Automated calculations
-
Interactive filtering
-
Clear financial and operational insights
As a result, teams manage contracts more efficiently and reduce financial and operational risks.
Why Do Ports Need a Contract Management Dashboard?
Ports operate in a high-value and high-risk environment. Poor contract visibility often leads to:
-
Missed renewals
-
Revenue leakage
-
Cost overruns
-
Vendor performance issues
-
Weak financial controls
A Power BI contract dashboard solves these problems by:
-
Centralizing contract data
-
Tracking active and renewal contracts
-
Monitoring revenue, cost, and profit
-
Highlighting risks early
-
Supporting strategic planning
Overview Section – Key KPIs at a Glance
Click to Buy Port Contract Management Dashboard in Power BI
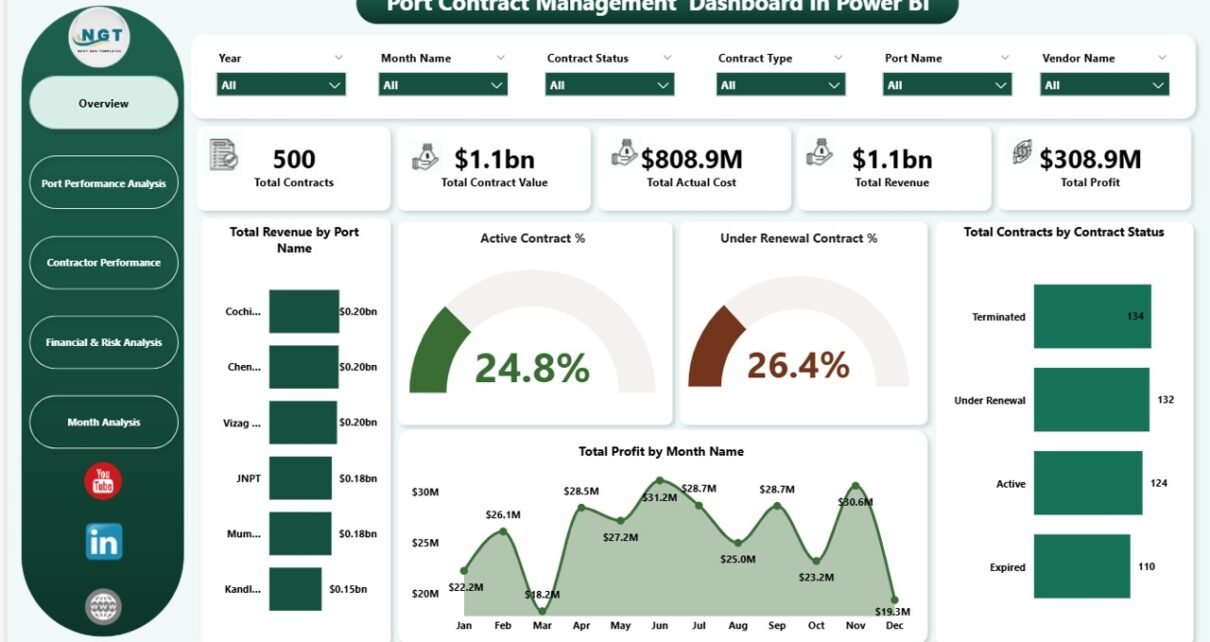
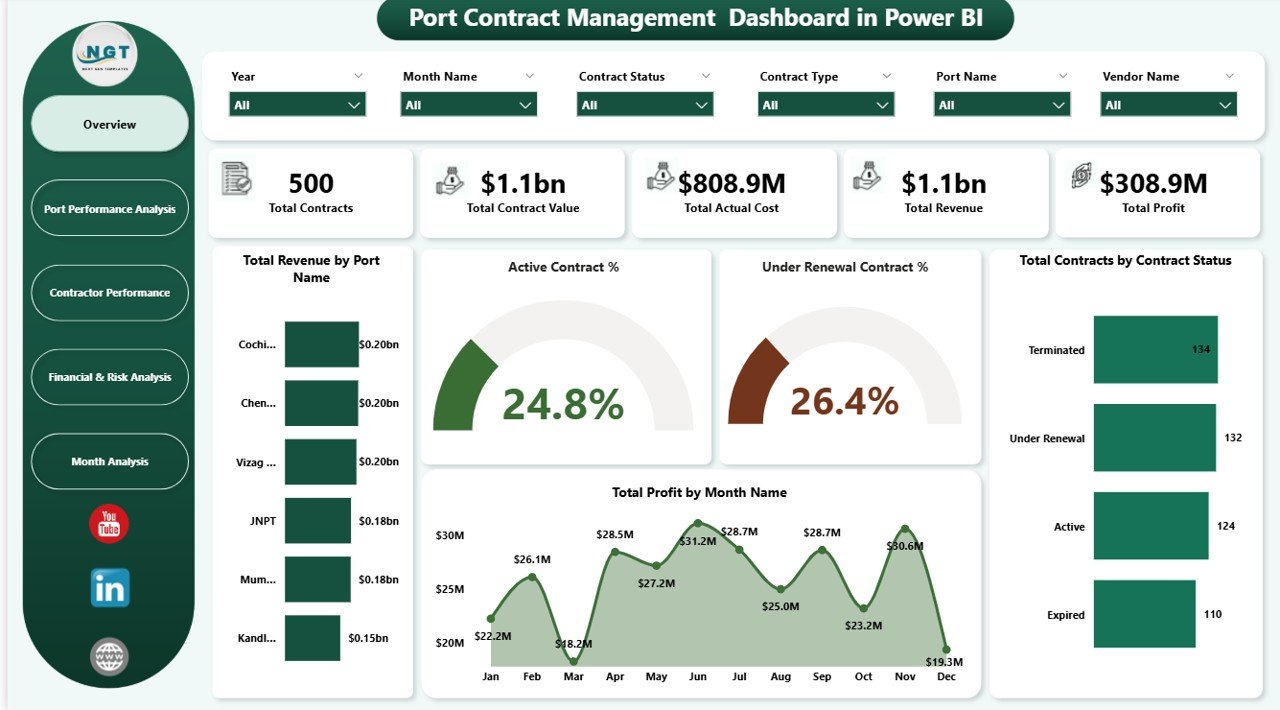
The Overview section gives an instant snapshot of contract performance using KPI cards and charts.
KPI Cards
These cards display high-level metrics that leadership teams review first:
-
Total Contracts – Number of contracts under management
-
Total Contract Value – Combined value of all contracts
-
Total Actual Cost – Cost incurred across all contracts
-
Total Revenue – Revenue generated from contracts
-
Total Profit – Net profit after cost deduction
These KPIs help decision-makers quickly assess overall contract health.
Overview Charts – Contract & Financial Performance
Total Revenue by Port Name
Shows how much revenue each port generates from contracts. This helps identify high-performing and underperforming ports.
Active Contract %
Displays the proportion of currently active contracts. A high percentage indicates strong operational continuity.
Under Renewal Contract %
Highlights contracts nearing renewal. This allows teams to act early and avoid service disruption.
Total Contracts by Contract Status
Breaks down contracts by status such as Active, Under Renewal, Expired, or Closed.
Total Profit by Month Name
Tracks monthly profit trends and helps identify seasonal patterns or financial risks.
Click to Buy Port Contract Management Dashboard in Power BI
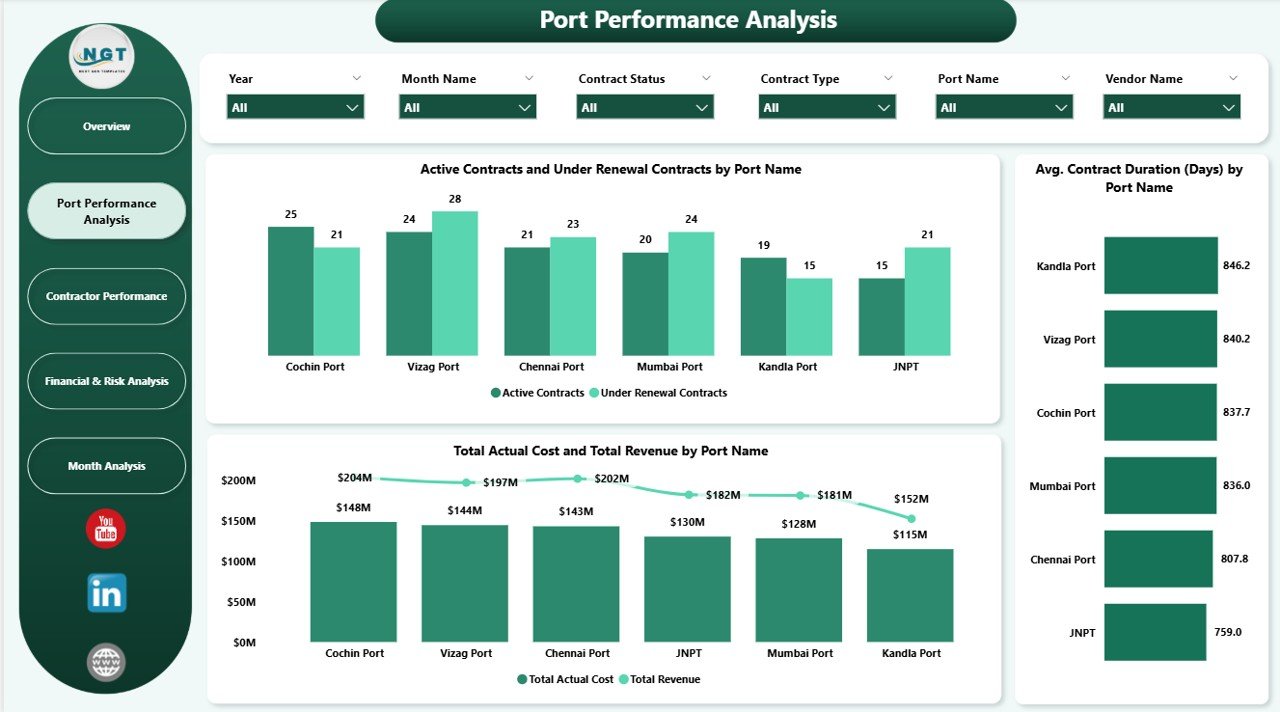
Port Performance Analysis
This section focuses on port-wise contract performance.
Active Contracts vs Under Renewal Contracts by Port Name
Compares active and renewal contracts for each port. It helps contract managers prioritize renewal actions.
Total Actual Cost vs Total Revenue by Port Name
Shows profitability at the port level and highlights ports with cost inefficiencies.
Average Contract Duration (Days) by Port Name
Helps assess contract maturity and long-term engagement levels.
This analysis supports better contract structuring and negotiation strategies.
Click to Buy Port Contract Management Dashboard in Power BI
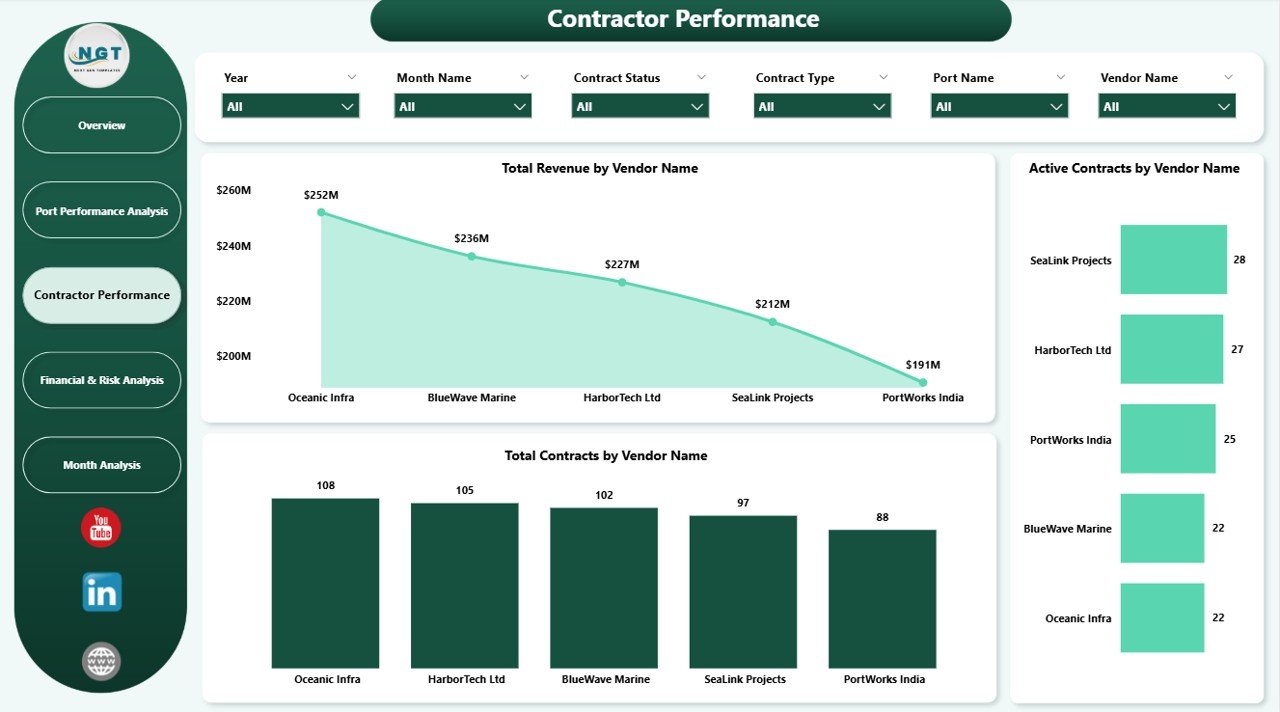
Contractor Performance Analysis
Vendor performance directly affects service quality, cost control, and compliance. This section evaluates contractors using financial and operational metrics.
Total Revenue by Vendor Name
Identifies vendors generating the highest revenue.
Total Contracts by Vendor Name
Shows vendor dependency and concentration risk.
By analyzing these insights, ports can:
-
Identify strategic vendors
-
Reduce over-dependency
-
Improve vendor negotiations
-
Strengthen performance management
Click to Buy Port Contract Management Dashboard in Power BI
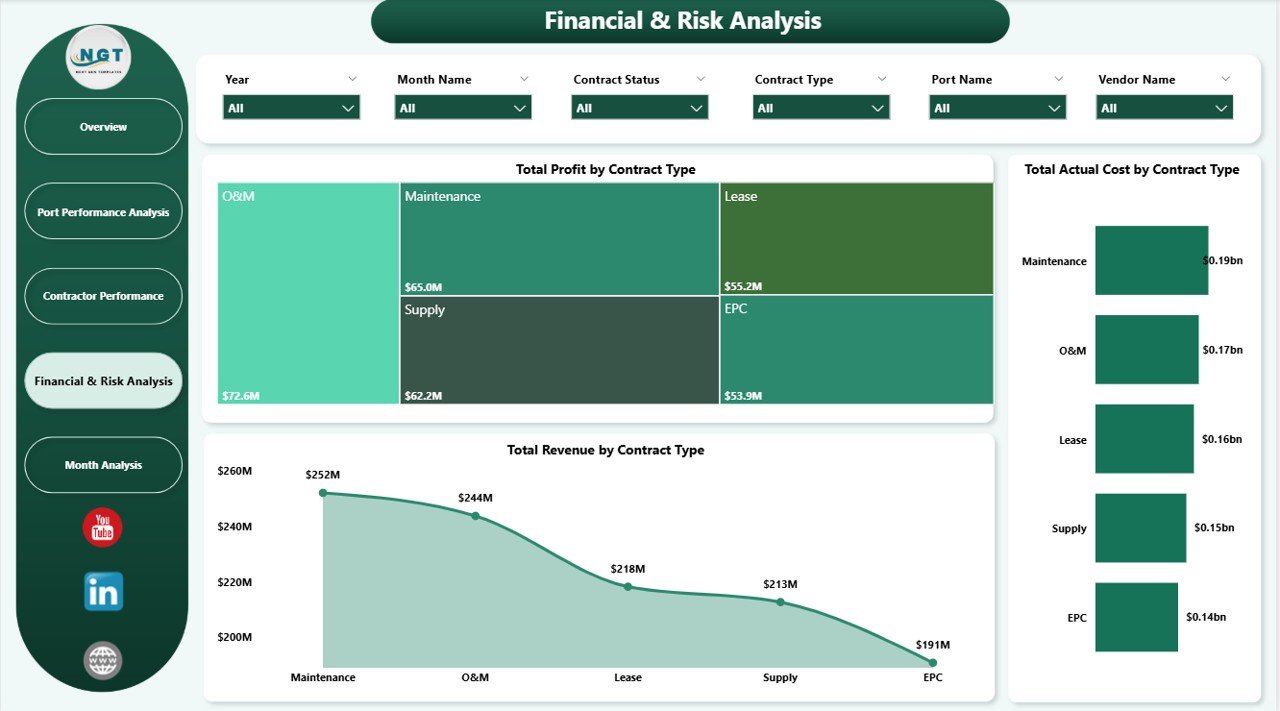
Financial & Risk Analysis
This section helps finance and risk teams monitor profitability and cost exposure.
Total Profit by Contract Type
Highlights which contract types deliver the highest profit margins.
Total Actual Cost by Contract Type
Identifies cost-intensive contract categories.
Total Revenue by Contract Type
Helps align revenue strategy with contract mix.
Finance teams use this analysis to optimize contract portfolios and control risk.
Click to Buy Port Contract Management Dashboard in Power BI
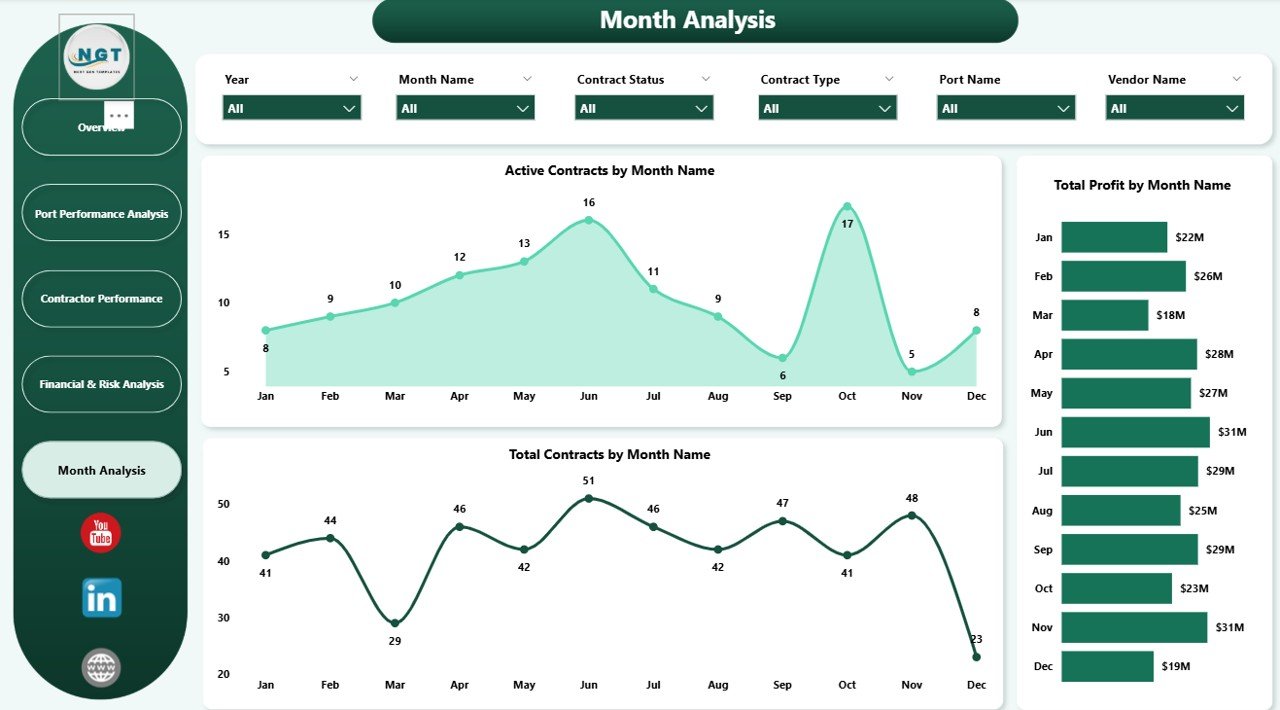
Monthly Analysis – Contract Trends Over Time
Monthly analysis helps track how contracts evolve across the year.
Active Contracts by Month Name
Shows contract activity trends.
Total Contracts by Month Name
Helps monitor onboarding and closure patterns.
Total Profit by Month Name
Reveals financial performance consistency and seasonality.
These trends support forecasting, budgeting, and long-term planning.
Click to Buy Port Contract Management Dashboard in Power BI
Key Benefits of the Port Contract Management Dashboard
1. Centralized Contract Visibility
All contract data stays in one interactive dashboard.
2. Improved Financial Control
Track revenue, cost, and profit accurately.
3. Better Renewal Management
Identify contracts nearing renewal before deadlines.
4. Enhanced Vendor Oversight
Monitor vendor contribution and dependency.
5. Risk Reduction
Spot cost overruns and low-profit contracts early.
6. Faster Decision-Making
Interactive visuals replace static reports.
Best Practices for Using This Dashboard
Click to Buy Port Contract Management Dashboard in Power BI
-
Update contract data regularly
-
Review renewal KPIs monthly
-
Monitor cost vs revenue at port and vendor level
-
Use monthly trends for forecasting
-
Combine financial and operational insights in reviews
Following these practices ensures long-term value from the dashboard.
Who Can Use This Dashboard?
This dashboard is ideal for:
-
Port Authorities
-
Contract Management Teams
-
Finance & Accounting Teams
-
Operations Managers
-
Risk & Compliance Teams
-
Executive Leadership
Conclusion
Click to Buy Port Contract Management Dashboard in Power BI
A Port Contract Management Dashboard in Power BI transforms how ports manage contracts. It brings transparency, financial discipline, and strategic clarity into contract operations. By combining real-time KPIs, interactive charts, and detailed analysis, this dashboard helps ports reduce risk, improve profitability, and strengthen vendor relationships.
Visit our YouTube channel to learn step-by-step video tutorials
Watch the step-by-step video tutorial:
Click to Buy Port Contract Management Dashboard in Power BI